Eunice, LA (Louisiana) Houses and Residents
| Eunice: | $98,083 |
| Louisiana: | $209,200 |
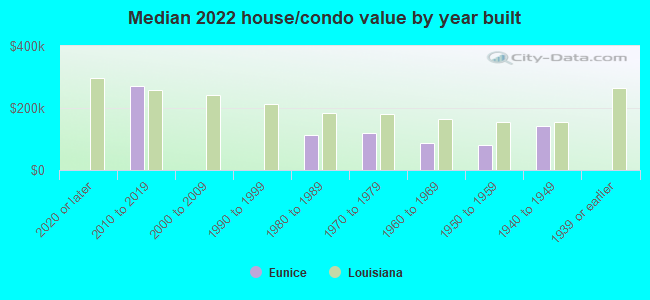
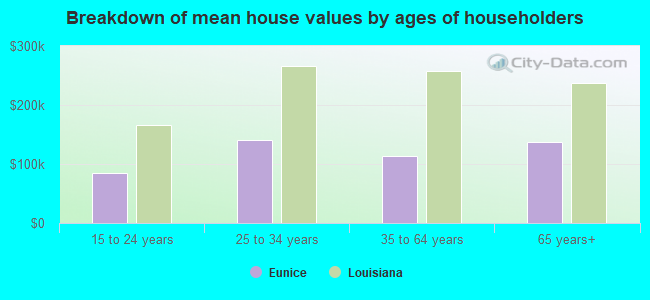
Mean price in 2022:
Detached houses: $160,573
Here: $160,573 State: $273,555 Mobile homes: $87,489
Here: $87,489 State: $89,857
Total population: 10,330 (All urban)
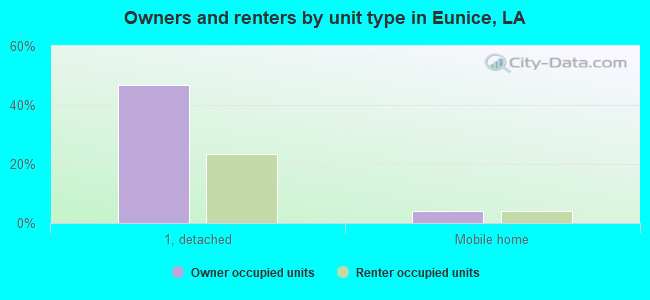
Houses: 4,526 (3,809 occupied: 1,983 owner occupied, 1,926 renter occupied)
| % of renters here: | 49% |
| State: | 32% |
Housing density: 968 houses/condos per square mile
Median price asked for vacant for-sale houses and condos in 2022: $88,836.
Median contract rent in 2022: $565 (lower quartile is $490, upper quartile is $748)
Median rent asked for vacant for-rent units in 2022: $812
Median gross rent in Eunice, LA in 2022: $783
Housing units in Eunice with a mortgage: 691 (13 second mortgage, 0 home equity loan, 3 both second mortgage and home equity loan)
Houses without a mortgage: 0
Median household income for houses/condos with a mortgage: $76,476
Median household income for apartments without a mortgage: $39,217
Median monthly housing costs: $633
Compare current foreclosures in Eunice, LA:
| Photo | Address | Area | Beds / Baths | Price | Details |
|---|---|---|---|---|---|

|
#1
Boudreaux St
Eunice, LA 70535
|
- sq. feet
|
- baths - beds |
$6,508
|
show details |

|
#2
S Saint George St
Eunice, LA 70535
|
- sq. feet
|
- baths - beds |
$5,295
|
show details |

|
#3
Benoit St
Eunice, LA 70535
|
- sq. feet
|
- baths - beds |
$5,295
|
show details |

|
#4
S Cane St
Eunice, LA 70535
|
- sq. feet
|
- baths - beds |
$5,295
|
show details |

|
#5
Highway 190
Eunice, LA 70535
|
- sq. feet
|
2 baths 2 beds |
show details | |

|
#6
N 6th St
Eunice, LA 70535
|
- sq. feet
|
2 baths 3 beds |
show details | |

|
#7
Amazon St
Eunice, LA 70535
|
- sq. feet
|
2 baths 3 beds |
show details | |

|
#8
N East St
Eunice, LA 70535
|
- sq. feet
|
- baths - beds |
$5,295
|
show details |

|
#9
College Rd
Eunice, LA 70535
|
- sq. feet
|
- baths - beds |
$5,670
|
show details |

|
#10
Wayne Rd
Eunice, LA 70535
|
1,120 sq. feet
|
- baths - beds |
show details |
| Photo | Address | Area | Beds / Baths | Price | Details |
|---|---|---|---|---|---|

|
#11
Beck Miller Rd
Eunice, LA 70535
|
- sq. feet
|
- baths - beds |
show details | |

|
#12
Saint Henry Dr
Eunice, LA 70535
|
- sq. feet
|
- baths - beds |
show details | |

|
#13
Faris Ave
Eunice, LA 70535
|
- sq. feet
|
- baths - beds |
show details | |

|
#14
Arpent Dr
Eunice, LA 70535
|
- sq. feet
|
- baths - beds |
show details | |

|
#15
N Saint George St
Eunice, LA 70535
|
- sq. feet
|
- baths - beds |
show details | |

|
#16
Eugenne Ln
Eunice, LA 70535
|
- sq. feet
|
- baths - beds |
show details | |

|
#17
Highway 13
Eunice, LA 70535
|
- sq. feet
|
- baths - beds |
show details | |

|
#18
Fournerat Rd
Eunice, LA 70535
|
- sq. feet
|
- baths - beds |
show details | |

|
#19
S 6th St # B
Eunice, LA 70535
|
- sq. feet
|
- baths - beds |
show details | |

|
#20
Dudley St
Eunice, LA 70535
|
- sq. feet
|
- baths - beds |
show details |
| Photo | Address | Area | Beds / Baths | Price | Details |
|---|---|---|---|---|---|

|
#21
E Vine Ave
Eunice, LA 70535
|
- sq. feet
|
- baths - beds |
show details | |

|
#22
Samuel Dr Lot A
Eunice, LA 70535
|
- sq. feet
|
- baths - beds |
show details | |

|
#23
Hundley Rd
Eunice, LA 70535
|
- sq. feet
|
- baths - beds |
show details | |

|
#24
Dudley St
Eunice, LA 70535
|
- sq. feet
|
- baths - beds |
show details | |

|
#25
Highway 190
Eunice, LA 70535
|
- sq. feet
|
- baths - beds |
show details | |

|
#26
Laura Ln
Eunice, LA 70535
|
- sq. feet
|
- baths - beds |
show details | |

|
#27
N 2nd St, Trlr 10
Eunice, LA 70535
|
- sq. feet
|
- baths - beds |
show details | |

|
#28
Hundley Rd
Eunice, LA 70535
|
- sq. feet
|
- baths - beds |
show details | |

|
#29
Mallet Cove Loop
Eunice, LA 70535
|
- sq. feet
|
- baths - beds |
show details | |

|
#30
Nile St
Eunice, LA 70535
|
- sq. feet
|
- baths - beds |
show details |
| Photo | Address | Area | Beds / Baths | Price | Details |
|---|---|---|---|---|---|

|
#31
N 9th St
Eunice, LA 70535
|
- sq. feet
|
- baths - beds |
show details | |

|
#32
Norma Ave # 3
Eunice, LA 70535
|
- sq. feet
|
- baths - beds |
show details | |

|
#33
Mill St
Eunice, LA 70535
|
- sq. feet
|
- baths - beds |
show details | |

|
#34
Williams Ave
Eunice, LA 70535
|
- sq. feet
|
- baths - beds |
show details | |

|
#35
E Ardoin St
Eunice, LA 70535
|
- sq. feet
|
- baths - beds |
show details | |

|
#36
Highway 190
Eunice, LA 70535
|
- sq. feet
|
- baths - beds |
show details | |

|
#37
Lee Rd
Eunice, LA 70535
|
- sq. feet
|
- baths - beds |
show details | |

|
#38
S 3rd St
Eunice, LA 70535
|
- sq. feet
|
- baths - beds |
show details | |

|
#39
Dudley St
Eunice, LA 70535
|
- sq. feet
|
- baths - beds |
show details | |

|
#40
Forest Rd
Eunice, LA 70535
|
- sq. feet
|
- baths - beds |
show details |
| Photo | Address | Area | Beds / Baths | Price | Details |
|---|---|---|---|---|---|

|
#41
Athabaska St
Eunice, LA 70535
|
- sq. feet
|
- baths - beds |
show details | |

|
#42
Bruce Ave
Eunice, LA 70535
|
- sq. feet
|
- baths - beds |
show details | |

|
#43
Mercedes Ave
Eunice, LA 70535
|
- sq. feet
|
- baths - beds |
show details | |

|
#44
Cotton Ave
Eunice, LA 70535
|
- sq. feet
|
- baths - beds |
show details | |

|
#45
Perchville Rd
Eunice, LA 70535
|
- sq. feet
|
- baths - beds |
show details | |

|
#46
N Tanglewood Dr
Eunice, LA 70535
|
- sq. feet
|
- baths - beds |
show details | |

|
#47
Soileau Rd
Eunice, LA 70535
|
- sq. feet
|
- baths - beds |
show details | |

|
#48
Richard School Rd
Eunice, LA 70535
|
- sq. feet
|
- baths - beds |
show details | |

|
#49
N 6th St
Eunice, LA 70535
|
- sq. feet
|
- baths - beds |
show details | |

|
Check over 1 million property listings on Foreclosure.com!
|
browse all offers | |||

Latest news about housing in Eunice, LA collected exclusively by city-data.com from local newspapers, TV, and radio stations

 | Relocating to LA (13 replies) |
| Relocating to Eunice area (12 replies) |
| Advice on Lafayette.... (16 replies) |
| 2010 Census results! (49 replies) |
| How many people speak Cajun French in La (81 replies) |
| single mom looking for her future small town to raise her son (14 replies) |

Median year apartment built: 1978
Household type by relationship:
Households: 9,348- Male householders: 1,619 (630 living alone), Female householders: 2,115 (727 living alone)
1,305 spouses (1,263 opposite-sex spouses), 296 unmarried partners, (289 opposite-sex unmarried partners), 2,950 children (2,797 natural, 67 adopted, 85 stepchildren), 298 grandchildren, 143 brothers or sisters, 96 parents, 11 foster children, 117 other relatives, 234 non-relatives
- In group quarters: 160
Size of family households: 1,014 2-persons, 495 3-persons, 300 4-persons, 216 5-persons, 89 6-persons, 19 7-or-more-persons.
Size of nonfamily households: 1,539 1-person, 238 2-persons, 14 3-persons, 11 4-persons.
926 married couples with children.
1,199 single-parent households (200 men, 999 women).
91.5% of residents of Eunice speak English at home.
2.3% of residents speak Spanish at home (88% speak English very well, 1% speak English well, 11% speak English not well, 1% don't speak English at all).
4.9% of residents speak other Indo-European language at home (82% speak English very well, 18% speak English well).
0.6% of residents speak Asian or Pacific Island language at home (100% speak English very well).
0.4% of residents speak other language at home (100% speak English very well).
Foreign born population: 147 (1.6%)
(7.5% of them are naturalized citizens)
| Here: | 5.9 |
| State: | 6.2 |
| Here: | 4.6 |
| State: | 4.4 |
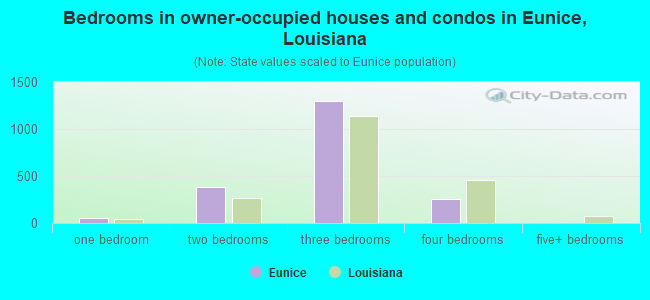
- Bedrooms in owner-occupied houses and condos in Eunice, Louisiana
- 0no bedroom
- 551 bedroom
- 3782 bedrooms
- 1,2953 bedrooms
- 2554 bedrooms
- 05+ bedrooms
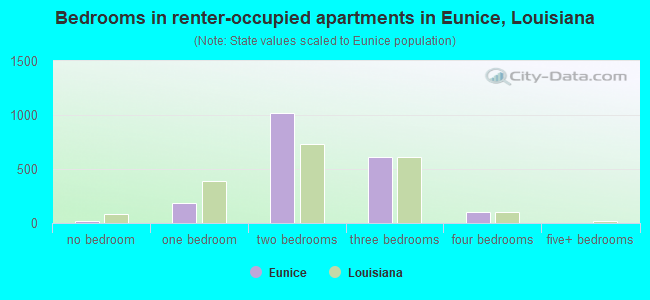
- Bedrooms in renter-occupied apartments in Eunice, Louisiana
- 16no bedroom
- 1851 bedroom
- 1,0142 bedrooms
- 6103 bedrooms
- 1034 bedrooms
- 05+ bedrooms
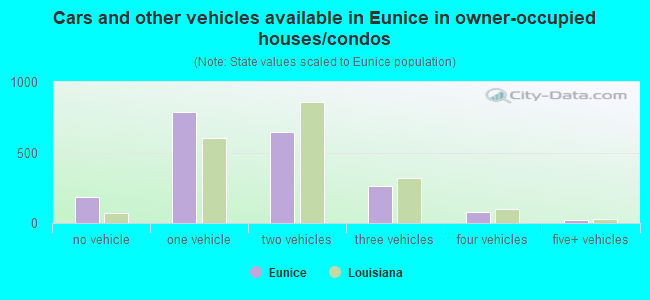
- Cars and other vehicles available in Eunice in owner-occupied houses/condos
- 187no vehicle
- 7871 vehicle
- 6482 vehicles
- 2643 vehicles
- 804 vehicles
- 185+ vehicles
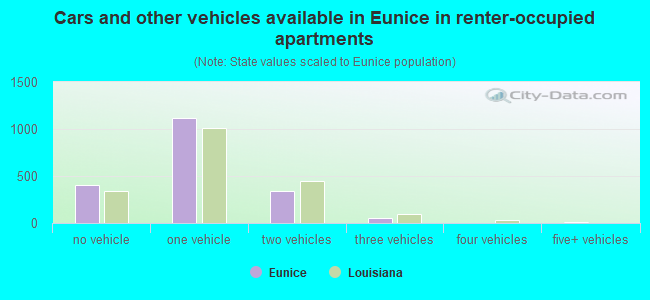
- Cars and other vehicles available in Eunice in renter-occupied apartments
- 399no vehicle
- 1,1141 vehicle
- 3422 vehicles
- 573 vehicles
- 04 vehicles
- 135+ vehicles
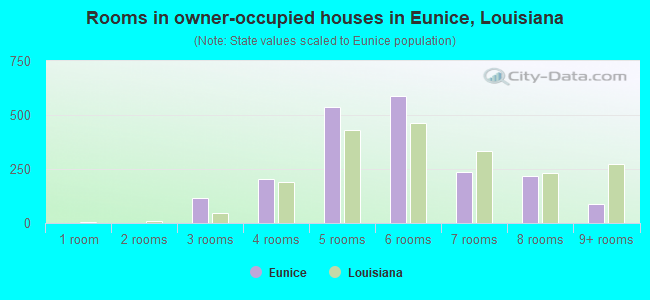
- Rooms in owner-occupied houses in Eunice, Louisiana
- 01 room
- 02 rooms
- 1163 rooms
- 2044 rooms
- 5355 rooms
- 5886 rooms
- 2367 rooms
- 2188 rooms
- 869+ rooms
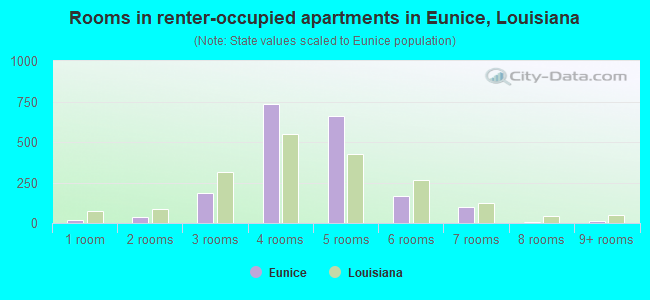
- Rooms in renter-occupied apartments in Eunice, Louisiana
- 161 room
- 362 rooms
- 1883 rooms
- 7374 rooms
- 6635 rooms
- 1696 rooms
- 977 rooms
- 98 rooms
- 109+ rooms
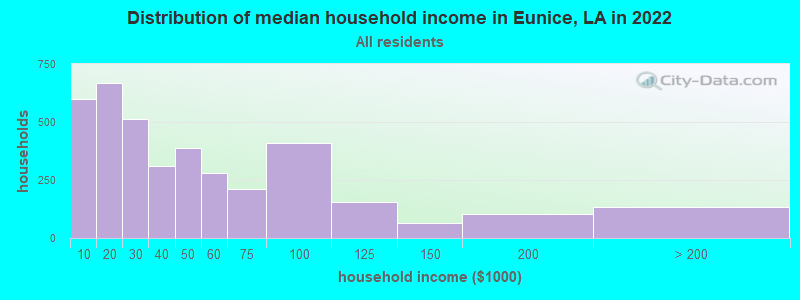
Eunice, LA household income distribution

- 600Less than $10,000
- 669$10,000 to $19,999
- 511$20,000 to $29,999
- 312$30,000 to $39,999
- 390$40,000 to $49,999
- 279$50,000 to $59,999
- 211$60,000 to $74,999
- 411$75,000 to $99,999
- 156$100,000 to $124,999
- 66$125,000 to $149,999
- 104$150,000 to $199,999
- 135$200,000 or more
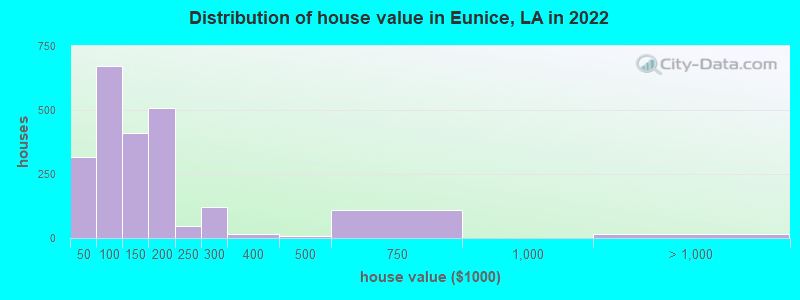
Home value of owner - occupied houses in 2022 in Eunice, LA
-
- 80Less than $10,000
- 43$10,000 to $14,999
- 21$15,000 to $19,999
- 36$20,000 to $24,999
- 16$30,000 to $34,999
- 21$35,000 to $39,999
- 96$40,000 to $49,999
- 29$50,000 to $59,999
- 19$60,000 to $69,999
- 140$70,000 to $79,999
- 294$80,000 to $89,999
- 91$90,000 to $99,999
- 226$100,000 to $124,999
- 185$125,000 to $149,999
- 234$150,000 to $174,999
- 274$175,000 to $199,999
- 47$200,000 to $249,999
- 121$250,000 to $299,999
- 14$300,000 to $399,999
- 7$400,000 to $499,999
- 109$500,000 to $749,999
- 15$1,500,000 to $1,999,999
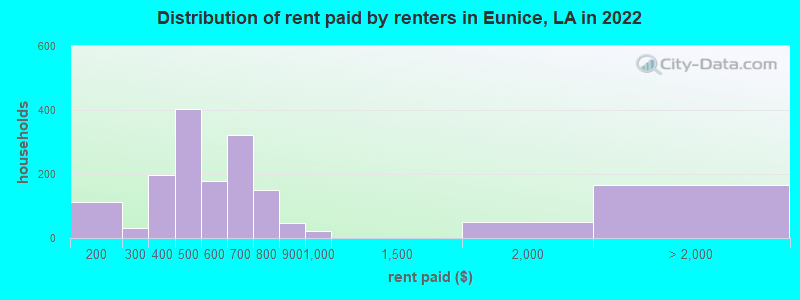
Rent paid by renters in 2022 in Eunice, LA
-
- 30$100 to $149
- 79$150 to $199
- 12$200 to $249
- 19$250 to $299
- 77$300 to $349
- 119$350 to $399
- 125$400 to $449
- 277$450 to $499
- 61$500 to $549
- 116$550 to $599
- 247$600 to $649
- 74$650 to $699
- 123$700 to $749
- 26$750 to $799
- 45$800 to $899
- 22$900 to $999
- 51$1,500 to $1,999
- 167No cash rent
Percentage of workers working in this county: 56.3%
Number of people working at home: 119 (3.5% of all workers)
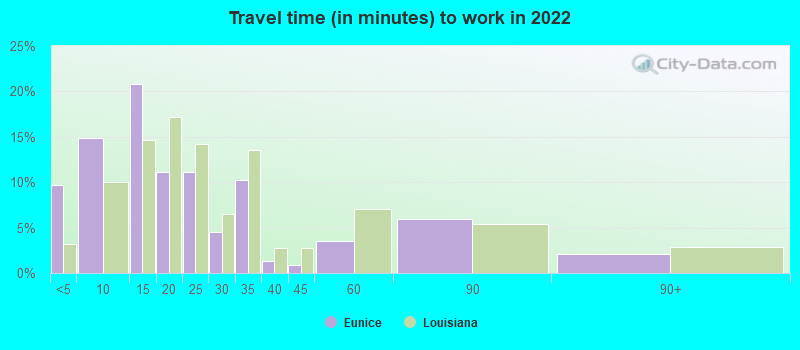
Travel time to work (commute)
- Less than 5 minutes: 274
- 5 to 9 minutes: 462
- 10 to 14 minutes: 424
- 15 to 19 minutes: 276
- 20 to 24 minutes: 355
- 25 to 29 minutes: 97
- 30 to 34 minutes: 263
- 35 to 39 minutes: 32
- 40 to 44 minutes: 49
- 45 to 59 minutes: 105
- 60 to 89 minutes: 488
- 90 or more minutes: 277
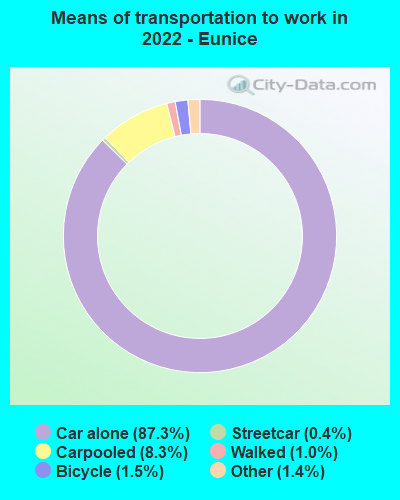
Means of transportation to work:
- Drove a car alone: 3,707 (83.7%)
- Carpooled: 352 (7.9%)
- Subway or elevated rail: 33 (0.7%)
- Taxi: 67 (1.5%)
- Bicycle: 51 (1.2%)
- Walked: 47 (1.1%)
- Worked at home: 119 (2.7%)
- Unemployment by race in 2022
- Unemployment rate for White non-Hispanic residents
- 4.4%Males
- 11.3%Females
- Unemployment rate for Black residents
- 31.5%Males
- 4.0%Females
- Unemployment rate for American Indian and Alaska Native residents
- 16.2%Males
- Unemployment rate for two or more race residents
- 44.1%Males
- Unemployment rate for Hispanic or Latino residents
- 29.8%Males
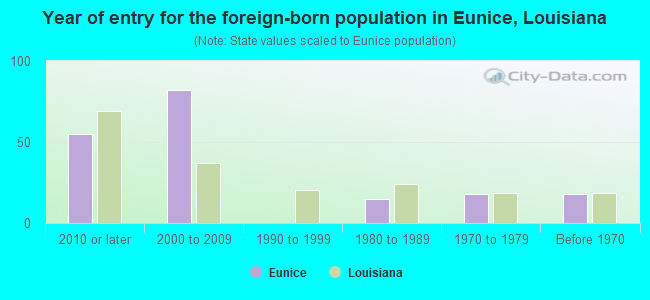
- Year of entry for the foreign-born population in Eunice, Louisiana
- 552010 or later
- 822000 to 2009
- 01990 to 1999
- 151980 to 1989
- 181970 to 1979
- 18Before 1970
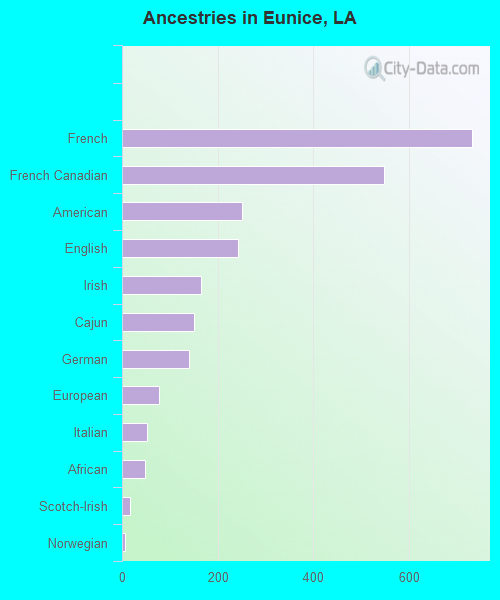
First ancestries reported:
- French: 731 (11.5%)
- French Canadian: 548 (8.7%)
- American: 252 (4.0%)
- English: 242 (3.8%)
- Irish: 166 (2.6%)
- Cajun: 151 (2.4%)
- German: 141 (2.2%)
- European: 78 (1.2%)
- Italian: 52 (0.8%)
- African: 49 (0.8%)
- Scotch-Irish: 16 (0.3%)
- Norwegian: 7 (0.1%)
- Slovak: 6 (0.09%)
- Lebanese: 1 (0.02%)
Most common places of birth for foreign-born residents (%):
| Eunice: | 53.0% (80) |
| Louisiana: | 12.1% (23,732) |
| Eunice: | 31.8% (48) |
| Louisiana: | 0.3% (516) |
| Eunice: | 15.9% (24) |
| Louisiana: | 2.8% (5,576) |
Place of birth for U.S.-born residents:
- This state: 8,431
- Other state: 686
- Northeast: 98
- Midwest: 87
- South: 498
- West: 101
85.2% of Eunice residents lived in the same house 1 years ago.
Out of people who lived in different houses, 43.1% lived in this county.
Out of people who lived in different counties, 89.6% lived in Louisiana.
| Eunice: | 85.2% |
| State average: | 88.3% |
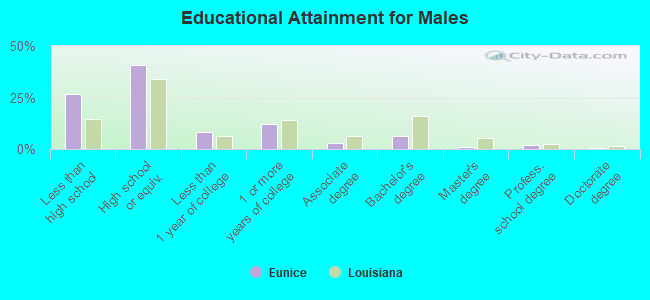
Education attainment for males 25 years and older:
- No schooling: 22
- Nursery to 4th grade: 20
- 5th and 6th grade: 15
- 7th and 8th grade: 91
- 9th grade: 68
- 10th grade: 81
- 11th grade: 229
- 12th grade, no diploma: 173
- High school graduate (or equivalency): 1,060
- Less than 1 year of college: 216
- Some college more than 1 year, no degree: 311
- Associate degree: 70
- Bachelor's degree: 164
- Master's degree: 27
- Professional school degree: 49
- Doctorate degree: 12
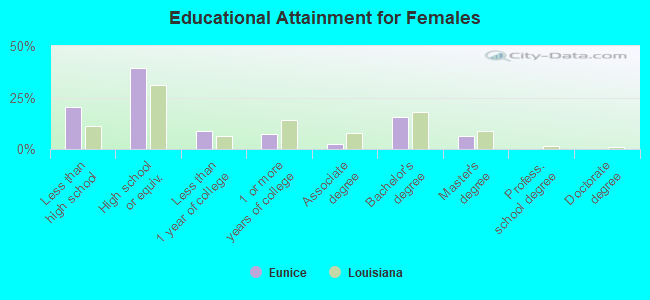
Education attainment for females 25 years and older:
- No schooling: 43
- Nursery to 4th grade: 19
- 5th and 6th grade: 22
- 7th and 8th grade: 144
- 9th grade: 116
- 10th grade: 102
- 11th grade: 131
- 12th grade, no diploma: 79
- High school graduate (or equivalency): 1,257
- Less than 1 year of college: 279
- Some college more than 1 year, no degree: 225
- Associate degree: 71
- Bachelor's degree: 500
- Master's degree: 195
- Professional school degree: 0
- Doctorate degree: 0


Housing units in structures:
- One, detached: 3,227
- One, attached: 5
- Two: 266
- 3 or 4: 176
- 5 to 9: 315
- 10 to 19: 72
- 20 to 49: 43
- 50 or more: 93
- Mobile homes: 325
Median worth of mobile homes: $10,410
Housing units lacking complete kitchen facilities in 2022: 4.8%
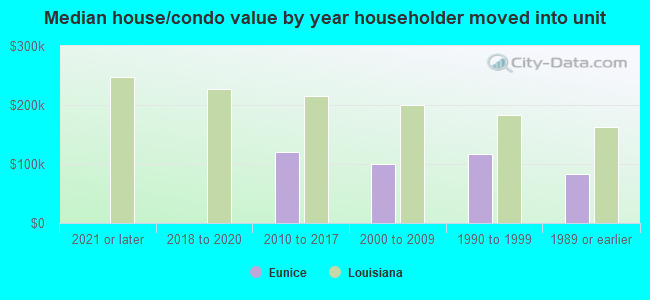
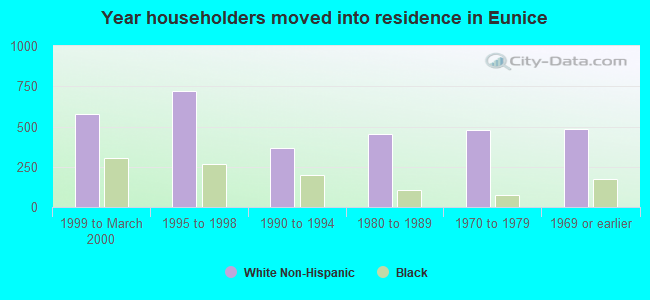
House/condo owner moved in on average 18 years ago
Renter moved in on average 1 years ago
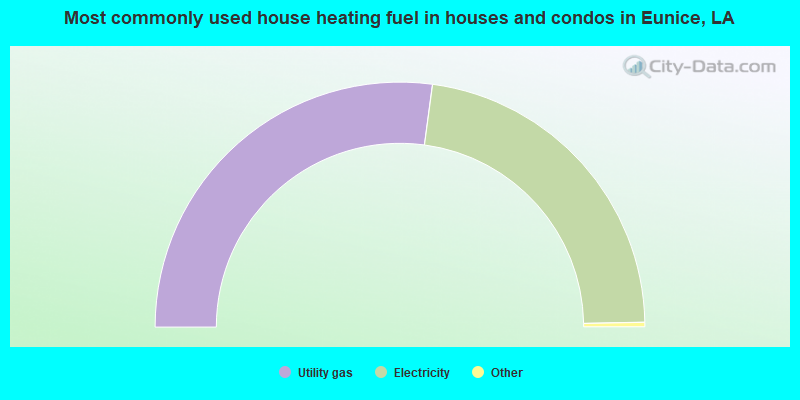
- 54.3%Utility gas
- 45.2%Electricity
- 0.3%Bottled, tank, or LP gas
- 0.2%Solar energy
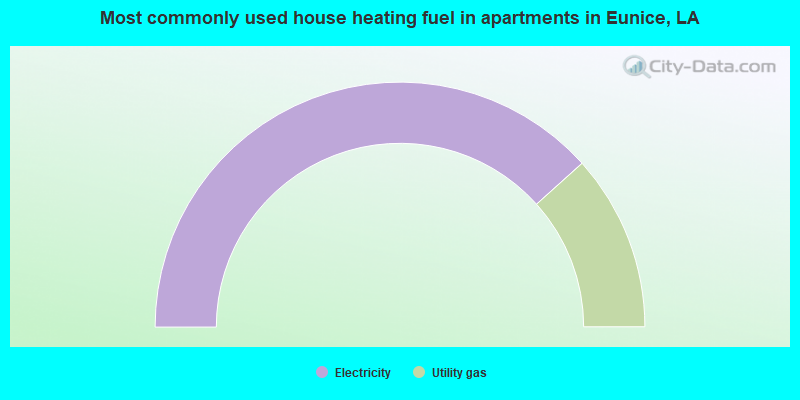
- 76.7%Electricity
- 23.3%Utility gas
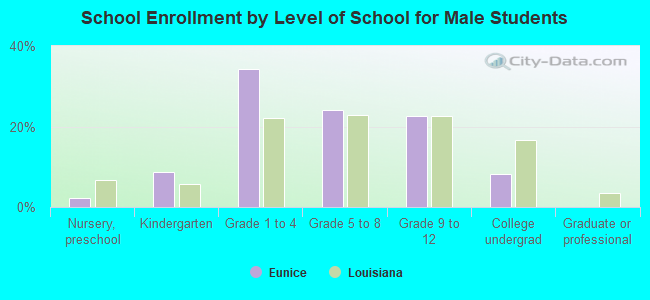
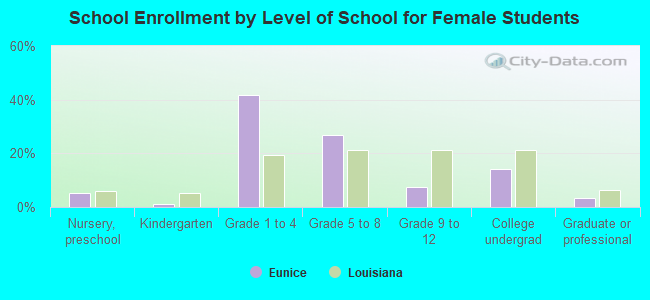
Private vs. public school enrollment:
| Here: | 13.1% |
| Louisiana: | 19.6% |
| Here: | 12.6% |
| Louisiana: | 18.3% |
| Here: | 6.0% |
| Louisiana: | 17.4% |