Flanagan, IL (Illinois) Houses and Residents
| Flanagan: | $107,017 |
| Illinois: | $251,600 |
Mean price in 2022:
Detached houses: $153,774
Here: $153,774 State: $310,164 Townhouses or other attached units: $106,516
Here: $106,516 State: $286,230
Total population: 1,086 (Urban population: 0, Rural population: 1,099 (all nonfarm))
Houses: 473 (379 occupied: 301 owner occupied, 83 renter occupied)
| % of renters here: | 22% |
| State: | 33% |
Housing density: 886 houses/condos per square mile
Median price asked for vacant for-sale houses and condos in 2022: $192,586.
Median contract rent in 2022: $572 (lower quartile is $469, upper quartile is $689)
Median rent asked for vacant for-rent units in 2022: $1,938
Median gross rent in Flanagan, IL in 2022: $831
Housing units in Flanagan with a mortgage: 157 (3 second mortgage, 0 home equity loan, 1 both second mortgage and home equity loan)
Houses without a mortgage: 6
Median household income for houses/condos with a mortgage: $82,104
Median household income for apartments without a mortgage: $85,890
Median monthly housing costs: $755
Compare current foreclosures near Flanagan, IL:
| Photo | Address | Area | Beds / Baths | Price | Details |
|---|---|---|---|---|---|

|
#1
S Jackson St
Flanagan, IL 61740
|
2,596 sq. feet
|
- baths 5 beds |
show details | |

|
#2
N Monroe St
Flanagan, IL 61740
|
1,248 sq. feet
|
- baths 3 beds |
show details | |

|
#3
S Main St
Flanagan, IL 61740
|
- sq. feet
|
- baths 3 beds |
show details | |

|
#4
N Jackson St
Flanagan, IL 61740
|
- sq. feet
|
- baths - beds |
show details | |

|
#5
S Main St
Flanagan, IL 61740
|
- sq. feet
|
- baths - beds |
show details | |

|
#6
S Main St
Flanagan, IL 61740
|
- sq. feet
|
- baths 4 beds |
show details | |

|
#7
N Jefferson St
Flanagan, IL 61740
|
- sq. feet
|
- baths - beds |
show details | |

|
#8
Center St
Chenoa, IL 61726
|
1,496 sq. feet
|
1 baths 3 beds |
show details | |

|
#9
E 1st St
El Paso, IL 61738
|
1,930 sq. feet
|
3 baths 6 beds |
show details | |

|
#10
E 3000 North Rd
Cornell, IL 61319
|
1,241 sq. feet
|
1 baths 2 beds |
show details |
| Photo | Address | Area | Beds / Baths | Price | Details |
|---|---|---|---|---|---|

|
#11
Reading St
Streator, IL 61364
|
1,350 sq. feet
|
2 baths 3 beds |
show details | |

|
#12
W Santa Fe Ave
Toluca, IL 61369
|
2 sq. feet
|
2 baths 4 beds |
show details | |

|
#13
S Willow St
Toluca, IL 61369
|
1,175 sq. feet
|
1 baths 4 beds |
show details | |

|
#14
W 3rd St
Gridley, IL 61744
|
1,404 sq. feet
|
2 baths - beds |
show details | |

|
#15
Grant St
Chenoa, IL 61726
|
1,236 sq. feet
|
2 baths - beds |
show details | |

|
#16
Kenneth Dr
Lexington, IL 61753
|
1,116 sq. feet
|
1 baths - beds |
show details | |

|
#17
S Hawthorne Rd
Streator, IL 61364
|
1,507 sq. feet
|
- baths 3 beds |
show details | |

|
#18
N 3rd Ave
Chenoa, IL 61726
|
1,628 sq. feet
|
1 baths - beds |
show details | |

|
#19
S 3rd Ave
Streator, IL 61364
|
936 sq. feet
|
- baths - beds |
show details | |

|
#20
E Payson St
Pontiac, IL 61764
|
1,641 sq. feet
|
- baths 3 beds |
show details |
| Photo | Address | Area | Beds / Baths | Price | Details |
|---|---|---|---|---|---|

|
#21
W Olive St
Pontiac, IL 61764
|
1,466 sq. feet
|
- baths 2 beds |
show details | |

|
#22
N Walnut St
Pontiac, IL 61764
|
1,188 sq. feet
|
- baths 3 beds |
show details | |

|
#23
Watson St
Streator, IL 61364
|
1,056 sq. feet
|
- baths - beds |
show details | |

|
#24
E 3000 North Rd Bldg 178
Streator, IL 61364
|
946 sq. feet
|
- baths 3 beds |
show details | |

|
#25
S 5th Ave
Streator, IL 61364
|
909 sq. feet
|
- baths - beds |
show details | |

|
#26
N 675 East Rd
Cornell, IL 61319
|
816 sq. feet
|
- baths 2 beds |
show details | |

|
#27
S Jackson St
Streator, IL 61364
|
960 sq. feet
|
- baths 3 beds |
show details | |

|
#28
E Walnut St
Lexington, IL 61753
|
836 sq. feet
|
1 baths - beds |
show details | |

|
#29
N Main St
Pontiac, IL 61764
|
2,409 sq. feet
|
- baths 3 beds |
show details | |

|
#30
W Walnut St
Lexington, IL 61753
|
956 sq. feet
|
1 baths - beds |
show details |
| Photo | Address | Area | Beds / Baths | Price | Details |
|---|---|---|---|---|---|

|
#31
W Humiston St
Pontiac, IL 61764
|
1,038 sq. feet
|
- baths 3 beds |
show details | |

|
#32
E Howard St
Pontiac, IL 61764
|
768 sq. feet
|
- baths 2 beds |
show details | |

|
#33
E 3000 North Rd
Chenoa, IL 61726
|
1,898 sq. feet
|
1 baths - beds |
show details | |

|
#34
Hamilton St
Chenoa, IL 61726
|
2,196 sq. feet
|
1 baths - beds |
show details | |

|
#35
Livingston St
Gridley, IL 61744
|
1,381 sq. feet
|
1 baths - beds |
show details | |

|
#36
N Ford St
Gridley, IL 61744
|
864 sq. feet
|
1 baths - beds |
show details | |

|
#37
N 1000 East Rd
Pontiac, IL 61764
|
1,740 sq. feet
|
- baths 3 beds |
show details | |

|
#38
W Prairie St
Pontiac, IL 61764
|
960 sq. feet
|
- baths 3 beds |
show details | |

|
#39
W Livingston St
Pontiac, IL 61764
|
1,260 sq. feet
|
- baths 2 beds |
show details | |

|
#40
N 2nd Rd
Dana, IL 61321
|
2,052 sq. feet
|
- baths - beds |
show details |
| Photo | Address | Area | Beds / Baths | Price | Details |
|---|---|---|---|---|---|

|
#41
N Locust St
Wenona, IL 61377
|
- sq. feet
|
- baths - beds |
show details | |

|
#42
E 1st St
Gridley, IL 61744
|
- sq. feet
|
- baths - beds |
show details | |

|
#43
N Center St
Gridley, IL 61744
|
- sq. feet
|
- baths - beds |
show details | |

|
#44
Penn St
Streator, IL 61364
|
- sq. feet
|
- baths - beds |
show details | |

|
#45
Anvil Dr
Lexington, IL 61753
|
- sq. feet
|
- baths - beds |
show details | |

|
#46
S Park St Apt 5
Streator, IL 61364
|
- sq. feet
|
- baths - beds |
show details | |

|
#47
E 6th St
Long Point, IL 61333
|
- sq. feet
|
- baths - beds |
show details | |

|
#48
W 6th St
Minonk, IL 61760
|
- sq. feet
|
- baths - beds |
show details | |

|
#49
N Lee St
Lexington, IL 61753
|
- sq. feet
|
- baths - beds |
show details | |

|
Check over 1 million property listings on Foreclosure.com!
|
browse all offers | |||

Latest news about housing in Flanagan, IL collected exclusively by city-data.com from local newspapers, TV, and radio stations

 | Preventing voters from moving to Madigan's District (5 replies) |
| info on living in Flanagan,Il. (7 replies) |

Median year apartment built: 1961
Household type by relationship:
Households: 925- Male householders: 206 (47 living alone), Female householders: 166 (57 living alone)
176 spouses (176 opposite-sex spouses), 11 unmarried partners, (11 opposite-sex unmarried partners), 260 children (214 natural, 26 adopted, 19 stepchildren), 11 grandchildren, 0 brothers or sisters, 3 parents, 0 foster children, 6 other relatives, 8 non-relatives
- In group quarters: 71
Size of family households: 155 2-persons, 44 3-persons, 40 4-persons, 12 5-persons, 13 6-persons, 4 7-or-more-persons.
Size of nonfamily households: 110 1-person, 4 2-persons.
92 married couples with children.
113 single-parent households (60 men, 53 women).
98.8% of residents of Flanagan speak English at home.
0.8% of residents speak Spanish at home (100% speak English very well).
0.7% of residents speak other Indo-European language at home (100% speak English very well).
Foreign born population: 6 (0.6%)
(100.0% of them are naturalized citizens)
| Here: | 6.6 |
| State: | 6.4 |
| Here: | 4.3 |
| State: | 4.1 |

- Bedrooms in owner-occupied houses and condos in Flanagan, Illinois
- 3no bedroom
- 21 bedroom
- 832 bedrooms
- 1363 bedrooms
- 694 bedrooms
- 75+ bedrooms

- Bedrooms in renter-occupied apartments in Flanagan, Illinois
- 4no bedroom
- 61 bedroom
- 562 bedrooms
- 173 bedrooms
- 04 bedrooms
- 05+ bedrooms

- Cars and other vehicles available in Flanagan in owner-occupied houses/condos
- 10no vehicle
- 931 vehicle
- 972 vehicles
- 903 vehicles
- 34 vehicles
- 95+ vehicles

- Cars and other vehicles available in Flanagan in renter-occupied apartments
- 3no vehicle
- 491 vehicle
- 322 vehicles
- 03 vehicles
- 04 vehicles
- 05+ vehicles

- Rooms in owner-occupied houses in Flanagan, Illinois
- 31 room
- 02 rooms
- 03 rooms
- 194 rooms
- 585 rooms
- 636 rooms
- 627 rooms
- 248 rooms
- 719+ rooms

- Rooms in renter-occupied apartments in Flanagan, Illinois
- 01 room
- 72 rooms
- 43 rooms
- 364 rooms
- 185 rooms
- 46 rooms
- 107 rooms
- 48 rooms
- 09+ rooms


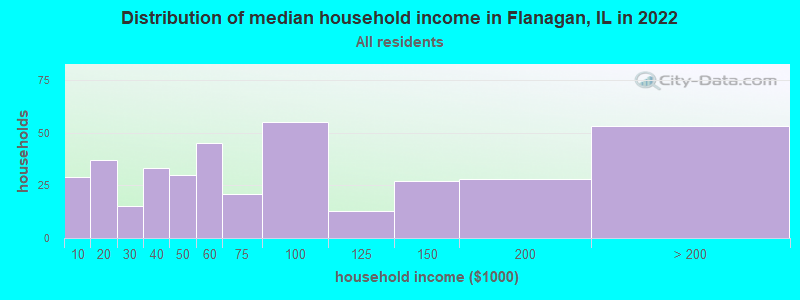
Flanagan, IL household income distribution

- 29Less than $10,000
- 37$10,000 to $19,999
- 15$20,000 to $29,999
- 33$30,000 to $39,999
- 30$40,000 to $49,999
- 45$50,000 to $59,999
- 21$60,000 to $74,999
- 55$75,000 to $99,999
- 13$100,000 to $124,999
- 27$125,000 to $149,999
- 28$150,000 to $199,999
- 53$200,000 or more
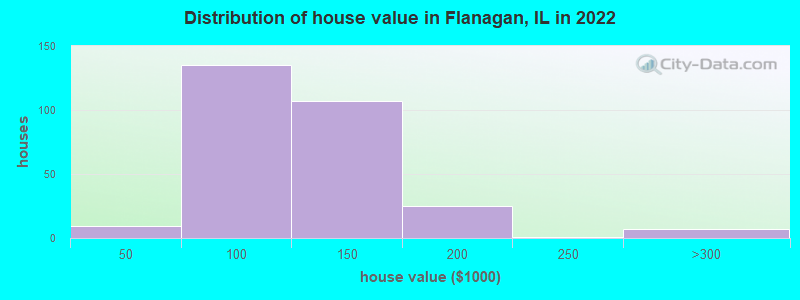
Home value of owner - occupied houses in 2022 in Flanagan, IL
-
- 1$30,000 to $34,999
- 7$40,000 to $49,999
- 18$50,000 to $59,999
- 26$60,000 to $69,999
- 23$70,000 to $79,999
- 26$80,000 to $89,999
- 32$90,000 to $99,999
- 41$100,000 to $124,999
- 65$125,000 to $149,999
- 13$150,000 to $174,999
- 11$175,000 to $199,999
- 0$200,000 to $249,999
- 7$250,000 to $299,999
Rent paid by renters in 2022 in Flanagan, IL
-
- 6$200 to $249
- 4$350 to $399
- 18$450 to $499
- 11$550 to $599
- 19$650 to $699
- 1$700 to $749
- 11$900 to $999
- 2$2,000 to $2,499


Percentage of workers working in this county: 79.7%
Number of people working at home: 103 (27.5% of all workers)
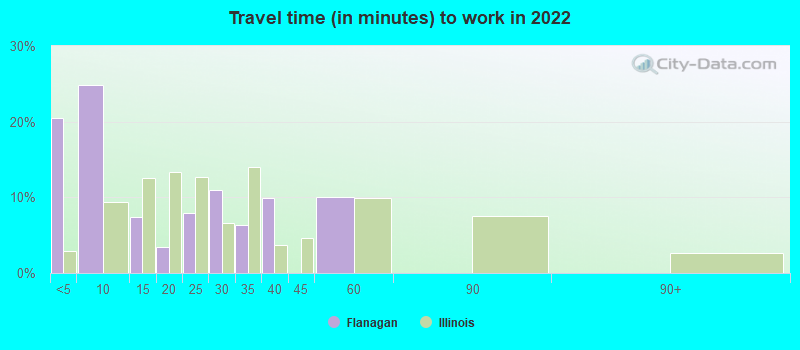
Travel time to work (commute)
- Less than 5 minutes: 76
- 5 to 9 minutes: 35
- 10 to 14 minutes: 23
- 15 to 19 minutes: 25
- 20 to 24 minutes: 27
- 25 to 29 minutes: 20
- 30 to 34 minutes: 19
- 35 to 39 minutes: 25
- 40 to 44 minutes: 4
- 45 to 59 minutes: 10
- 60 to 89 minutes: 3
- 90 or more minutes: 10
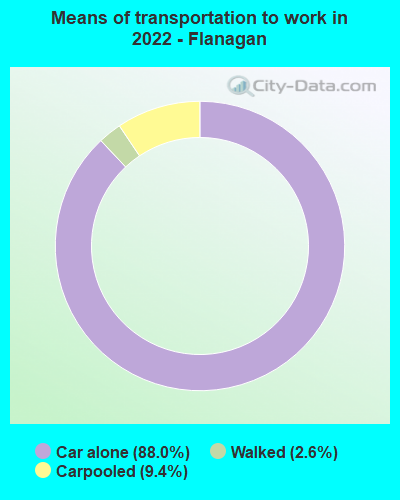
Means of transportation to work:
- Drove a car alone: 229 (79.8%)
- Carpooled: 22 (7.7%)
- Walked: 6 (2.1%)
- Worked at home: 25 (8.7%)

- Unemployment by race in 2022
- Unemployment rate for White non-Hispanic residents
- 5.2%Males
- 5.0%Females
- Unemployment rate for Hispanic or Latino residents
- 100.0%Males

- Year of entry for the foreign-born population in Flanagan, Illinois
- 02010 or later
- 02000 to 2009
- 01990 to 1999
- 01980 to 1989
- 01970 to 1979
- 5Before 1970

First ancestries reported:
- German: 152 (37.0%)
- English: 109 (26.5%)
- American: 67 (16.3%)
- Irish: 16 (3.9%)
- Italian: 14 (3.4%)
- European: 8 (1.9%)
- Polish: 8 (1.9%)
- French: 3 (0.7%)
- Norwegian: 3 (0.7%)
- Scottish: 3 (0.7%)
- Slovak: 3 (0.7%)
- Dutch: 2 (0.5%)
- Czech: 1 (0.2%)
- Danish: 1 (0.2%)
Most common places of birth for foreign-born residents (%):
| Flanagan: | 100.0% (6) |
| Illinois: | 1.6% (29,519) |
Place of birth for U.S.-born residents:
- This state: 834
- Other state: 76
- Northeast: 3
- Midwest: 43
- South: 14
- West: 16
88.5% of Flanagan residents lived in the same house 1 years ago.
Out of people who lived in different houses, 34.6% lived in this county.
Out of people who lived in different counties, 24.5% lived in Illinois.
| Flanagan: | 88.5% |
| State average: | 88.3% |
Education attainment for males 25 years and older:
- No schooling: 0
- Nursery to 4th grade: 0
- 5th and 6th grade: 0
- 7th and 8th grade: 0
- 9th grade: 7
- 10th grade: 0
- 11th grade: 2
- 12th grade, no diploma: 5
- High school graduate (or equivalency): 135
- Less than 1 year of college: 9
- Some college more than 1 year, no degree: 53
- Associate degree: 20
- Bachelor's degree: 36
- Master's degree: 11
- Professional school degree: 7
- Doctorate degree: 0

Education attainment for females 25 years and older:
- No schooling: 1
- Nursery to 4th grade: 0
- 5th and 6th grade: 0
- 7th and 8th grade: 4
- 9th grade: 3
- 10th grade: 7
- 11th grade: 0
- 12th grade, no diploma: 0
- High school graduate (or equivalency): 182
- Less than 1 year of college: 26
- Some college more than 1 year, no degree: 33
- Associate degree: 21
- Bachelor's degree: 58
- Master's degree: 8
- Professional school degree: 1
- Doctorate degree: 3


Housing units in structures:
- One, detached: 381
- One, attached: 59
- Two: 14
- 3 or 4: 7
- 5 to 9: 8
- 20 to 49: 3
Housing units lacking complete kitchen facilities in 2022: 3.2%
House/condo owner moved in on average 15 years ago
Renter moved in on average 2 years ago

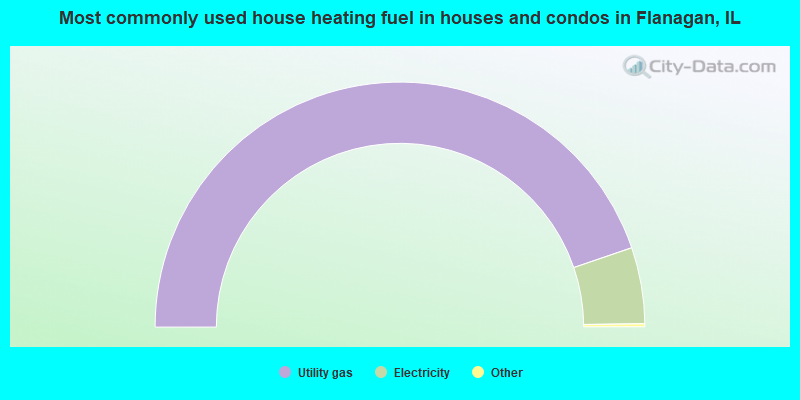
- 89.9%Utility gas
- 10.1%Electricity
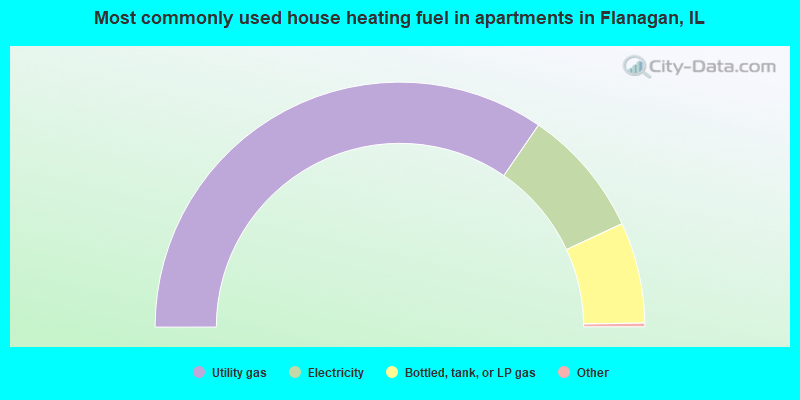
- 69.5%Utility gas
- 17.1%Electricity
- 13.4%Bottled, tank, or LP gas
Private vs. public school enrollment:
| Here: | 1.7% |
| Illinois: | 13.3% |
| Here: | 0.0% |
| Illinois: | 9.9% |
| Here: | 14.3% |
| Illinois: | 27.4% |


