Georgetown, IL (Illinois) Houses and Residents
| Georgetown: | $71,871 |
| Illinois: | $251,600 |
Total population: 3,386 (All urban)
Houses: 1,580 (1,374 occupied: 1,054 owner occupied, 376 renter occupied)
| % of renters here: | 26% |
| State: | 33% |
Housing density: 980 houses/condos per square mile
Median price asked for vacant for-sale houses and condos in 2022: $96,905.
Median contract rent in 2022: $526 (lower quartile is $505, upper quartile is $580)
Median rent asked for vacant for-rent units in 2022: $459
Median gross rent in Georgetown, IL in 2022: $688
Housing units in Georgetown with a mortgage: 370 (7 second mortgage, 0 home equity loan, 9 both second mortgage and home equity loan)
Houses without a mortgage: 11
Median household income for houses/condos with a mortgage: $59,476
Median household income for apartments without a mortgage: $69,080
Median monthly housing costs: $607
Compare current foreclosures near Georgetown, IL:
| Photo | Address | Area | Beds / Baths | Price | Details |
|---|---|---|---|---|---|

|
#1
Mack St
Georgetown, IL 61846
|
- sq. feet
|
1 baths 2 beds |
show details | |

|
#2
Mill Rd
Georgetown, IL 61846
|
- sq. feet
|
- baths - beds |
show details | |

|
#3
E 9th St
Georgetown, IL 61846
|
- sq. feet
|
- baths - beds |
show details | |

|
#4
E N 3rd St Apt 4
Georgetown, IL 61846
|
- sq. feet
|
- baths - beds |
show details | |

|
#5
Oak St
Danville, IL 61832
|
1,200 sq. feet
|
1 baths 3 beds |
$139,000
|
show details |

|
#6
W 9th St
Georgetown, IL 61846
|
- sq. feet
|
- baths - beds |
show details | |

|
#7
Guy St
Georgetown, IL 61846
|
- sq. feet
|
- baths - beds |
show details | |

|
#8
Illinois Ave
Georgetown, IL 61846
|
- sq. feet
|
- baths - beds |
show details | |

|
#9
N 1650 East Rd
Ridge Farm, IL 61870
|
- sq. feet
|
- baths - beds |
$19,900
|
show details |

|
#10
1/2 W 13th St
Tilton, IL 61833
|
730 sq. feet
|
1 baths 2 beds |
show details |
| Photo | Address | Area | Beds / Baths | Price | Details |
|---|---|---|---|---|---|

|
#11
E Fairchild St
Danville, IL 61832
|
- sq. feet
|
- baths - beds |
$12,900
|
show details |

|
#12
N Birch St
Dana, IN 47847
|
- sq. feet
|
1 baths 4 beds |
show details | |

|
#13
Fairway Dr
Danville, IL 61832
|
- sq. feet
|
2 baths 4 beds |
show details | |

|
#14
Eagle Bluff Dr
Oakwood, IL 61858
|
1,963 sq. feet
|
2 baths 3 beds |
show details | |

|
#15
South St
Danville, IL 61832
|
- sq. feet
|
- baths - beds |
$4,000
|
show details |

|
#16
N Vermilion Ave
Allerton, IL 61810
|
1,560 sq. feet
|
2 baths 3 beds |
show details | |

|
#17
Columbus St
Danville, IL 61832
|
- sq. feet
|
1 baths 3 beds |
show details | |

|
#18
Kingsdale Ave
Tilton, IL 61833
|
969 sq. feet
|
1 baths 2 beds |
show details | |

|
#19
N Colorado St
Chrisman, IL 61924
|
- sq. feet
|
1 baths 2 beds |
show details | |

|
#20
N Franklin St
Danville, IL 61832
|
- sq. feet
|
2 baths 2 beds |
show details |
| Photo | Address | Area | Beds / Baths | Price | Details |
|---|---|---|---|---|---|

|
#21
N 1525th St
Chrisman, IL 61924
|
- sq. feet
|
- baths - beds |
show details | |

|
#22
Johnson St
Danville, IL 61832
|
- sq. feet
|
- baths - beds |
show details | |

|
#23
S 3rd St
Cayuga, IN 47928
|
- sq. feet
|
- baths - beds |
show details | |

|
#24
Griggs St
Danville, IL 61832
|
- sq. feet
|
- baths - beds |
show details | |

|
#25
W Main St
Perrysville, IN 47974
|
- sq. feet
|
- baths - beds |
show details | |

|
#26
Oak St # 9
Danville, IL 61832
|
- sq. feet
|
- baths - beds |
show details | |

|
#27
Shasta Dr
Danville, IL 61832
|
- sq. feet
|
- baths - beds |
show details | |

|
#28
Oak St
Danville, IL 61832
|
- sq. feet
|
- baths - beds |
show details | |

|
#29
N Walnut St
Danville, IL 61832
|
- sq. feet
|
- baths - beds |
show details | |

|
#30
N Market St
Kingman, IN 47952
|
- sq. feet
|
- baths - beds |
show details |
| Photo | Address | Area | Beds / Baths | Price | Details |
|---|---|---|---|---|---|

|
#31
Sunset Rdg
Danville, IL 61832
|
- sq. feet
|
- baths - beds |
show details | |

|
#32
N Vermilion St Apt 405
Danville, IL 61832
|
- sq. feet
|
- baths - beds |
show details | |

|
#33
S 300 W
Dana, IN 47847
|
- sq. feet
|
- baths - beds |
show details | |

|
#34
N Eugene Ave
Cayuga, IN 47928
|
- sq. feet
|
- baths - beds |
show details | |

|
#35
N Vermilion Ave
Allerton, IL 61810
|
- sq. feet
|
- baths - beds |
show details | |

|
#36
Meadowlane Dr
Catlin, IL 61817
|
- sq. feet
|
- baths - beds |
show details | |

|
#37
E 5th St
Tilton, IL 61833
|
- sq. feet
|
- baths - beds |
show details | |

|
#38
King St
Danville, IL 61832
|
- sq. feet
|
- baths - beds |
show details | |

|
#39
W Center St
Catlin, IL 61817
|
- sq. feet
|
- baths - beds |
show details | |

|
#40
W Grant St
Tilton, IL 61833
|
- sq. feet
|
- baths - beds |
show details |
| Photo | Address | Area | Beds / Baths | Price | Details |
|---|---|---|---|---|---|

|
#41
W Grant St
Tilton, IL 61833
|
- sq. feet
|
- baths - beds |
show details | |

|
#42
S Washington St Apt F
Tilton, IL 61833
|
- sq. feet
|
- baths - beds |
show details | |

|
#43
Westwood Dr
Catlin, IL 61817
|
- sq. feet
|
- baths - beds |
show details | |

|
#44
Dodge Ave
Danville, IL 61832
|
- sq. feet
|
- baths - beds |
show details | |

|
#45
N Gilbert St
Danville, IL 61832
|
- sq. feet
|
- baths - beds |
show details | |

|
#46
N Webster St
Catlin, IL 61817
|
- sq. feet
|
- baths - beds |
show details | |

|
#47
W Vermilion St
Catlin, IL 61817
|
- sq. feet
|
- baths - beds |
show details | |

|
#48
E Owen St
Ridge Farm, IL 61870
|
- sq. feet
|
- baths - beds |
show details | |

|
#49
E North St
Ridge Farm, IL 61870
|
- sq. feet
|
- baths - beds |
show details | |

|
Check over 1 million property listings on Foreclosure.com!
|
browse all offers | |||

Latest news about housing in Georgetown, IL collected exclusively by city-data.com from local newspapers, TV, and radio stations

 | How likely would you relocate from Chicago Suburbs to TX, NC, or SC if your job moved there? (76 replies) |
| Vernon Township Help (9 replies) |
| Georgetown Square (2 replies) |
| Cities similar to Chicago? (88 replies) |
| Chicago, DC, ATL for Black Professional (233 replies) |
| High School Admissions Hysteria -- Does Chicago Have It Too? (32 replies) |

Median year apartment built: 1950
Household type by relationship:
Households: 3,068- Male householders: 616 (250 living alone), Female householders: 732 (205 living alone)
524 spouses (524 opposite-sex spouses), 61 unmarried partners, (53 opposite-sex unmarried partners), 911 children (833 natural, 29 adopted, 48 stepchildren), 122 grandchildren, 31 brothers or sisters, 8 parents, 0 foster children, 16 other relatives, 43 non-relatives
Size of family households: 448 2-persons, 100 3-persons, 201 4-persons, 9 5-persons, 26 6-persons.
Size of nonfamily households: 550 1-person, 67 2-persons, 10 4-persons.
327 married couples with children.
201 single-parent households (55 men, 146 women).
99.4% of residents of Georgetown speak English at home.
0.2% of residents speak other Indo-European language at home (100% speak English very well).
Foreign born population: 2 (0.1%)
(150.0% of them are naturalized citizens)
| Here: | 5.7 |
| State: | 6.4 |
| Here: | 4.6 |
| State: | 4.1 |

- Bedrooms in owner-occupied houses and condos in Georgetown, Illinois
- 0no bedroom
- 291 bedroom
- 5142 bedrooms
- 4083 bedrooms
- 914 bedrooms
- 125+ bedrooms

- Bedrooms in renter-occupied apartments in Georgetown, Illinois
- 27no bedroom
- 411 bedroom
- 2452 bedrooms
- 633 bedrooms
- 04 bedrooms
- 05+ bedrooms

- Cars and other vehicles available in Georgetown in owner-occupied houses/condos
- 9no vehicle
- 4041 vehicle
- 4312 vehicles
- 1133 vehicles
- 864 vehicles
- 115+ vehicles

- Cars and other vehicles available in Georgetown in renter-occupied apartments
- 34no vehicle
- 2371 vehicle
- 962 vehicles
- 93 vehicles
- 04 vehicles
- 05+ vehicles

- Rooms in owner-occupied houses in Georgetown, Illinois
- 01 room
- 02 rooms
- 03 rooms
- 2114 rooms
- 2945 rooms
- 2866 rooms
- 1477 rooms
- 1018 rooms
- 149+ rooms

- Rooms in renter-occupied apartments in Georgetown, Illinois
- 241 room
- 32 rooms
- 493 rooms
- 884 rooms
- 1545 rooms
- 456 rooms
- 87 rooms
- 68 rooms
- 09+ rooms


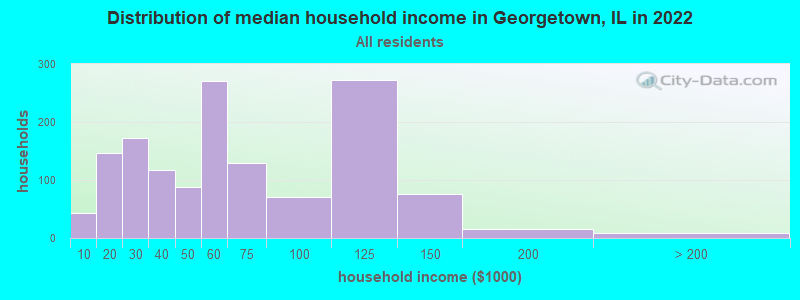
Georgetown, IL household income distribution

- 43Less than $10,000
- 146$10,000 to $19,999
- 172$20,000 to $29,999
- 118$30,000 to $39,999
- 88$40,000 to $49,999
- 271$50,000 to $59,999
- 129$60,000 to $74,999
- 70$75,000 to $99,999
- 272$100,000 to $124,999
- 76$125,000 to $149,999
- 15$150,000 to $199,999
- 9$200,000 or more
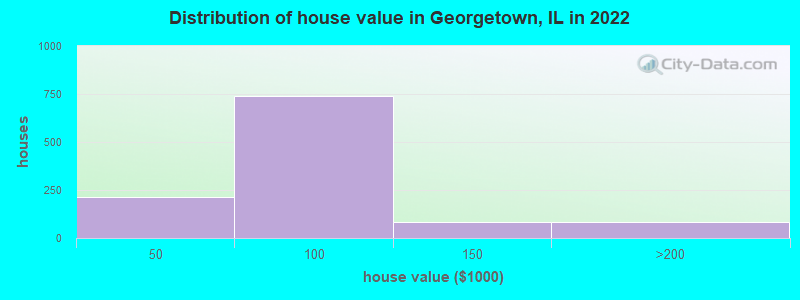
Home value of owner - occupied houses in 2022 in Georgetown, IL
-
- 13Less than $10,000
- 33$10,000 to $14,999
- 17$20,000 to $24,999
- 15$25,000 to $29,999
- 95$35,000 to $39,999
- 40$40,000 to $49,999
- 63$50,000 to $59,999
- 209$60,000 to $69,999
- 280$70,000 to $79,999
- 84$80,000 to $89,999
- 59$90,000 to $99,999
- 67$100,000 to $124,999
- 14$125,000 to $149,999
- 23$150,000 to $174,999
- 45$175,000 to $199,999
- 12$200,000 to $249,999
Rent paid by renters in 2022 in Georgetown, IL
-
- 18$100 to $149
- 15$200 to $249
- 22$250 to $299
- 4$300 to $349
- 69$450 to $499
- 144$500 to $549
- 103$550 to $599
- 52$600 to $649
- 25$650 to $699
- 1$700 to $749
- 9$900 to $999


Percentage of workers working in this county: 76.2%
Number of people working at home: 284 (19.5% of all workers)
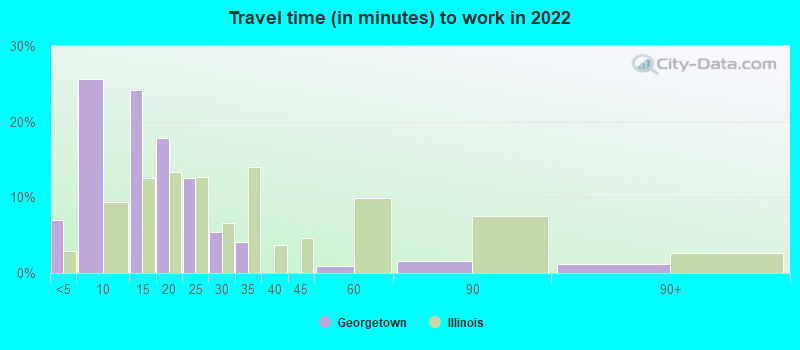
Travel time to work (commute)
- Less than 5 minutes: 72
- 5 to 9 minutes: 16
- 10 to 14 minutes: 36
- 15 to 19 minutes: 199
- 20 to 24 minutes: 179
- 25 to 29 minutes: 116
- 30 to 34 minutes: 227
- 35 to 39 minutes: 44
- 40 to 44 minutes: 69
- 45 to 59 minutes: 171
- 60 to 89 minutes: 0
- 90 or more minutes: 45
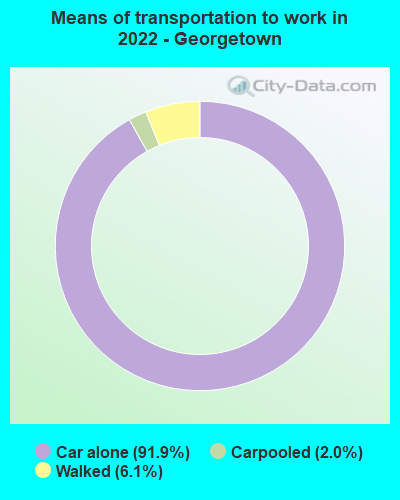
Means of transportation to work:
- Drove a car alone: 396 (78.4%)
- Carpooled: 8 (1.6%)
- Walked: 25 (5.0%)
- Worked at home: 119 (23.6%)

- Unemployment by race in 2022
- Unemployment rate for White non-Hispanic residents
- 8.1%Females
- Unemployment rate for Black residents
- 100.0%Females
- Unemployment rate for other race residents
- 100.0%Females
- Unemployment rate for two or more race residents
- 100.0%Males
- Unemployment rate for Hispanic or Latino residents
- 100.0%Females

- Year of entry for the foreign-born population in Georgetown, Illinois
- 02010 or later
- 02000 to 2009
- 01990 to 1999
- 61980 to 1989
- 01970 to 1979
- 11Before 1970

First ancestries reported:
- Irish: 181 (15.9%)
- English: 169 (14.9%)
- German: 153 (13.5%)
- American: 97 (8.5%)
- Scottish: 43 (3.8%)
- Polish: 40 (3.5%)
- Finnish: 17 (1.5%)
- Lithuanian: 8 (0.7%)
- French: 7 (0.6%)
- Dutch: 6 (0.5%)
- Scotch-Irish: 5 (0.4%)
- Russian: 2 (0.2%)
Most common places of birth for foreign-born residents (%):
| Georgetown: | 100.0% (3) |
| Illinois: | 1.0% (18,753) |
Place of birth for U.S.-born residents:
- This state: 2,508
- Other state: 559
- Northeast: 100
- Midwest: 230
- South: 89
- West: 135
92.6% of Georgetown residents lived in the same house 1 years ago.
Out of people who lived in different houses, 40.9% lived in this county.
Out of people who lived in different counties, 2.6% lived in Illinois.
| Georgetown: | 92.6% |
| State average: | 88.3% |
Education attainment for males 25 years and older:
- No schooling: 0
- Nursery to 4th grade: 0
- 5th and 6th grade: 0
- 7th and 8th grade: 0
- 9th grade: 28
- 10th grade: 8
- 11th grade: 0
- 12th grade, no diploma: 0
- High school graduate (or equivalency): 599
- Less than 1 year of college: 102
- Some college more than 1 year, no degree: 149
- Associate degree: 68
- Bachelor's degree: 201
- Master's degree: 11
- Professional school degree: 0
- Doctorate degree: 0

Education attainment for females 25 years and older:
- No schooling: 0
- Nursery to 4th grade: 0
- 5th and 6th grade: 0
- 7th and 8th grade: 4
- 9th grade: 5
- 10th grade: 13
- 11th grade: 37
- 12th grade, no diploma: 4
- High school graduate (or equivalency): 472
- Less than 1 year of college: 62
- Some college more than 1 year, no degree: 107
- Associate degree: 230
- Bachelor's degree: 40
- Master's degree: 38
- Professional school degree: 0
- Doctorate degree: 5


Housing units in structures:
- One, detached: 1,358
- One, attached: 14
- Two: 65
- 3 or 4: 108
- 20 to 49: 22
- Mobile homes: 10
Housing units lacking complete kitchen facilities in 2022: 4.4%
House/condo owner moved in on average 15 years ago
Renter moved in on average 5 years ago

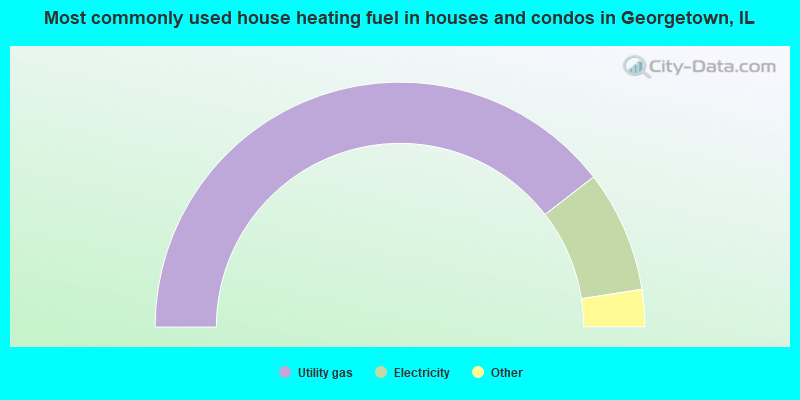
- 79.1%Utility gas
- 16.1%Electricity
- 2.5%Wood
- 2.4%Bottled, tank, or LP gas
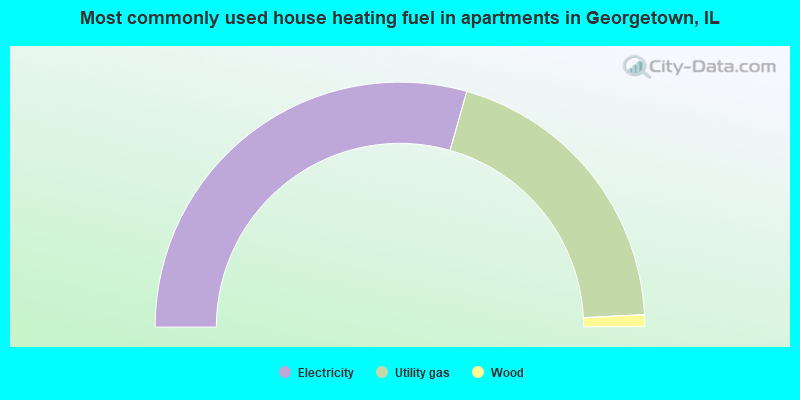
- 58.8%Electricity
- 39.6%Utility gas
- 1.6%Wood
Private vs. public school enrollment:
| Here: | 40.5% |
| Illinois: | 13.3% |
| Here: | 18.8% |
| Illinois: | 9.9% |
| Here: | 0.0% |
| Illinois: | 27.4% |


