Grand Forks, ND (North Dakota) Houses and Residents
| Grand Forks: | $244,954 |
| North Dakota: | $243,100 |
Mean price in 2022:
Detached houses: $307,831
Here: $307,831 State: $284,144 Townhouses or other attached units: $166,215
Here: $166,215 State: $250,572 In 2-unit structures: $309,638
Here: $309,638 State: $200,034 In 3-to-4-unit structures: $228,012
Here: $228,012 State: $229,360 In 5-or-more-unit structures: $137,992
Here: $137,992 State: $231,934 Mobile homes: $44,742
Here: $44,742 State: $85,388
Total population: 56,057 (Urban population: 49,123, Rural population: 159 (34 farm, 125 nonfarm))
Houses: 27,971 (25,806 occupied: 11,360 owner occupied, 13,573 renter occupied)
| % of renters here: | 54% |
| State: | 35% |
Housing density: 1,454 houses/condos per square mile
Median price asked for vacant for-sale houses and condos in 2022: $157,989.
Median contract rent in 2022: $771 (lower quartile is $617, upper quartile is $1,062)
Median rent asked for vacant for-rent units in 2022: $1,977
Median gross rent in Grand Forks, ND in 2022: $851
Housing units in Grand Forks with a mortgage: 7,754 (542 second mortgage, 88 home equity loan, 265 both second mortgage and home equity loan)
Houses without a mortgage: 64
Median household income for houses/condos with a mortgage: $96,162
Median household income for apartments without a mortgage: $75,666
Median monthly housing costs: $990
Compare current foreclosures in Grand Forks, ND:
| Photo | Address | Area | Beds / Baths | Price | Details |
|---|---|---|---|---|---|

|
#1
S 19th St
Grand Forks, ND 58201
|
960 sq. feet
|
1 baths 2 beds |
show details | |

|
#2
Cottonwood St
Grand Forks, ND 58201
|
1,008 sq. feet
|
1 baths 3 beds |
show details | |

|
#3
S 11th St
Grand Forks, ND 58201
|
1,516 sq. feet
|
2 baths 3 beds |
show details | |

|
#4
Norkota Ct
Grand Forks, ND 58201
|
2,552 sq. feet
|
1 baths 3 beds |
show details | |

|
#5
11th Ave N
Grand Forks, ND 58203
|
1,736 sq. feet
|
1 baths 2 beds |
show details | |

|
#6
Chestnut St
Grand Forks, ND 58201
|
1,448 sq. feet
|
2 baths 3 beds |
show details | |

|
#7
W Lanark Dr
Grand Forks, ND 58203
|
1,644 sq. feet
|
2 baths 2 beds |
show details | |

|
#8
S 22nd St
Grand Forks, ND 58201
|
960 sq. feet
|
1 baths 3 beds |
show details | |

|
#9
S 11th St
Grand Forks, ND 58201
|
1,175 sq. feet
|
1 baths 2 beds |
show details | |

|
#10
Oak St
Grand Forks, ND 58201
|
877 sq. feet
|
1 baths 2 beds |
show details |
| Photo | Address | Area | Beds / Baths | Price | Details |
|---|---|---|---|---|---|

|
#11
S 11th St
Grand Forks, ND 58201
|
1,568 sq. feet
|
1 baths 2 beds |
show details | |

|
#12
S 25th St
Grand Forks, ND 58201
|
1,920 sq. feet
|
1 baths 3 beds |
show details | |

|
#13
Cottonwood St
Grand Forks, ND 58201
|
2,164 sq. feet
|
1 baths 3 beds |
show details | |

|
#14
Duke Dr Apt 111
Grand Forks, ND 58201
|
1,155 sq. feet
|
1 baths 2 beds |
show details | |

|
#15
Cottonwood St
Grand Forks, ND 58201
|
1,008 sq. feet
|
1 baths 3 beds |
show details | |

|
#16
4th Ave N
Grand Forks, ND 58203
|
1,916 sq. feet
|
1 baths 3 beds |
show details | |

|
#17
S 20th St
Grand Forks, ND 58201
|
1,000 sq. feet
|
1 baths 3 beds |
show details | |

|
#18
6th Ave N
Grand Forks, ND 58203
|
2,007 sq. feet
|
1 baths 2 beds |
show details | |

|
#19
13th Ave N Apt 206
Grand Forks, ND 58203
|
- sq. feet
|
- baths - beds |
show details | |

|
#20
N 4th St
Grand Forks, ND 58203
|
- sq. feet
|
- baths - beds |
show details |
| Photo | Address | Area | Beds / Baths | Price | Details |
|---|---|---|---|---|---|

|
#21
36th Ave S Apt 110
Grand Forks, ND 58201
|
- sq. feet
|
- baths - beds |
show details | |

|
#22
Landeco Ln Apt 1
Grand Forks, ND 58201
|
- sq. feet
|
- baths - beds |
show details | |

|
#23
N Washington St Lot 110
Grand Forks, ND 58203
|
- sq. feet
|
- baths - beds |
show details | |

|
#24
Fountain Vista Dr
Grand Forks, ND 58201
|
- sq. feet
|
- baths - beds |
show details | |

|
#25
Curran Ct Apt 112
Grand Forks, ND 58201
|
- sq. feet
|
- baths - beds |
show details | |

|
#26
N 3rd St # 108
Grand Forks, ND 58203
|
- sq. feet
|
- baths - beds |
show details | |

|
#27
36th Ave S Apt B14
Grand Forks, ND 58201
|
- sq. feet
|
- baths - beds |
show details | |

|
#28
36th Ave S, Apt 5
Grand Forks, ND 58201
|
- sq. feet
|
- baths - beds |
show details | |

|
#29
N 39th St Apt 206e
Grand Forks, ND 58203
|
- sq. feet
|
- baths - beds |
show details | |

|
#30
1st Ave N Apt 313
Grand Forks, ND 58203
|
- sq. feet
|
- baths - beds |
show details |
| Photo | Address | Area | Beds / Baths | Price | Details |
|---|---|---|---|---|---|

|
#31
S 34th St Apt 305
Grand Forks, ND 58201
|
- sq. feet
|
- baths - beds |
show details | |

|
#32
26th Ave S Apt 22
Grand Forks, ND 58201
|
- sq. feet
|
- baths - beds |
show details | |

|
#33
S 3rd St Apt 4
Grand Forks, ND 58201
|
- sq. feet
|
- baths - beds |
show details | |

|
#34
20th Ave S Apt 110
Grand Forks, ND 58201
|
- sq. feet
|
- baths - beds |
show details | |

|
#35
Lawndale Rd
Grand Forks, ND 58201
|
- sq. feet
|
- baths - beds |
show details | |

|
#36
S 17th St
Grand Forks, ND 58201
|
- sq. feet
|
- baths - beds |
show details | |

|
#37
2nd Ave N
Grand Forks, ND 58203
|
- sq. feet
|
- baths - beds |
show details | |

|
#38
28th Ave S Apt 1
Grand Forks, ND 58201
|
- sq. feet
|
- baths - beds |
show details | |

|
#39
36th Ave S Apt 219
Grand Forks, ND 58201
|
- sq. feet
|
- baths - beds |
show details | |

|
#40
Cleveland Ave
Grand Forks, ND 58201
|
- sq. feet
|
- baths - beds |
show details |
| Photo | Address | Area | Beds / Baths | Price | Details |
|---|---|---|---|---|---|

|
Check over 1 million property listings on Foreclosure.com!
|
browse all offers | |||
| Photo | Address | Area | Beds / Baths | Price | Details |
|---|


 | Luxury Apartments in Grand Forks (9 replies) |
| Looking for an apartment/room in Grand Forks, ND (0 replies) |
| Grand Forks single family homes selling fast (0 replies) |
| Need rental house starting Aug 1, 2011 in Grand Forks ND (0 replies) |
| Apartments in Grand Forks? (16 replies) |
| Searching For Good Apartment in Grand Forks, ND (6 replies) |

Median year apartment built: 1992
Household type by relationship:
Households: 58,519- Male householders: 13,694 (5,666 living alone), Female householders: 11,612 (4,367 living alone)
8,298 spouses (8,251 opposite-sex spouses), 2,176 unmarried partners, (2,112 opposite-sex unmarried partners), 13,195 children (12,392 natural, 269 adopted, 534 stepchildren), 388 grandchildren, 329 brothers or sisters, 281 parents, 28 foster children, 379 other relatives, 4,066 non-relatives
- In group quarters: 4,068
Size of family households: 5,180 2-persons, 3,165 3-persons, 1,961 4-persons, 548 5-persons, 299 6-persons, 156 7-or-more-persons.
Size of nonfamily households: 10,635 1-person, 2,188 2-persons, 598 3-persons, 270 4-persons, 1 5-persons, 20 6-persons, 42 7-or-more-persons.
7,631 married couples with children.
2,394 single-parent households (477 men, 1,917 women).
90.5% of residents of Grand Forks speak English at home.
1.8% of residents speak Spanish at home (83% speak English very well, 8% speak English well, 8% speak English not well, 1% don't speak English at all).
3.4% of residents speak other Indo-European language at home (75% speak English very well, 19% speak English well, 5% speak English not well).
1.9% of residents speak Asian or Pacific Island language at home (52% speak English very well, 43% speak English well, 4% speak English not well, 1% don't speak English at all).
1.9% of residents speak other language at home (58% speak English very well, 36% speak English well, 5% speak English not well).
Foreign born population: 3,344 (5.7%)
(19.6% of them are naturalized citizens)
| Here: | 6.7 |
| State: | 7.0 |
| Here: | 3.8 |
| State: | 4.0 |
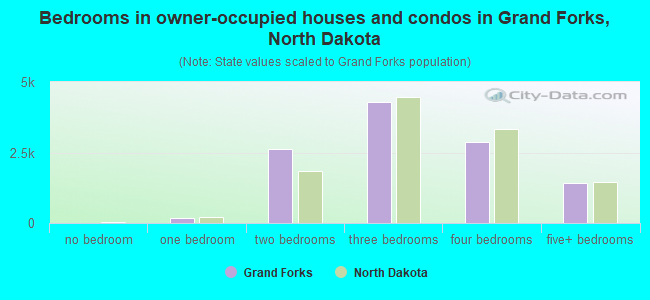
- Bedrooms in owner-occupied houses and condos in Grand Forks, North Dakota
- 11no bedroom
- 1791 bedroom
- 2,6102 bedrooms
- 4,2753 bedrooms
- 2,8824 bedrooms
- 1,4035+ bedrooms
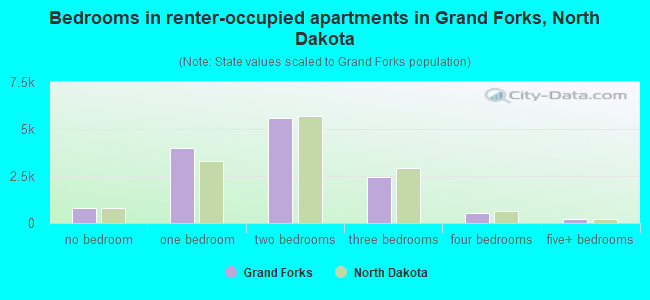
- Bedrooms in renter-occupied apartments in Grand Forks, North Dakota
- 803no bedroom
- 4,0051 bedroom
- 5,5812 bedrooms
- 2,4313 bedrooms
- 5414 bedrooms
- 2125+ bedrooms
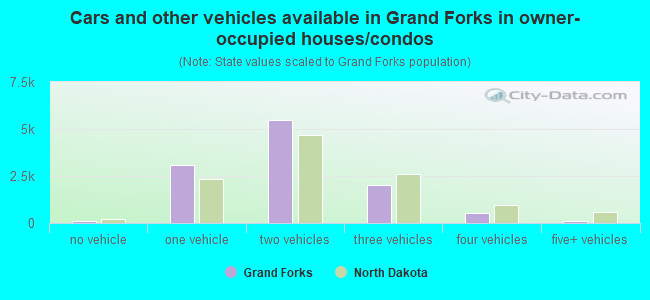
- Cars and other vehicles available in Grand Forks in owner-occupied houses/condos
- 120no vehicle
- 3,0801 vehicle
- 5,4712 vehicles
- 2,0183 vehicles
- 5434 vehicles
- 1285+ vehicles
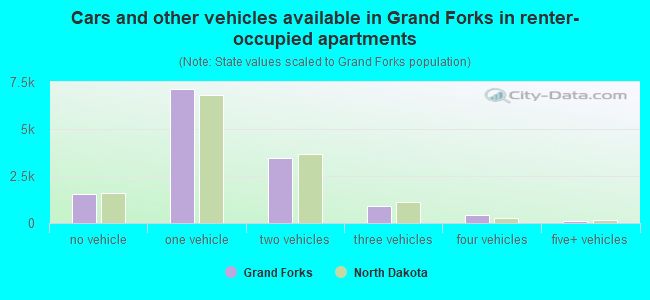
- Cars and other vehicles available in Grand Forks in renter-occupied apartments
- 1,525no vehicle
- 7,1221 vehicle
- 3,4652 vehicles
- 9213 vehicles
- 4524 vehicles
- 895+ vehicles
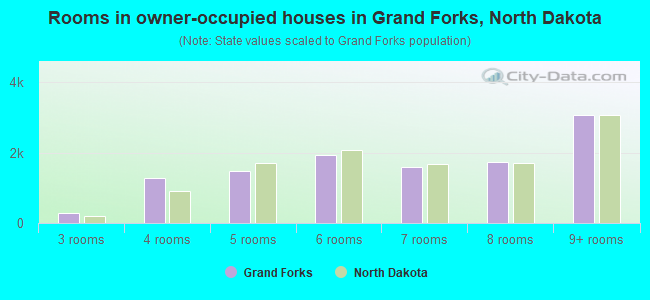
- Rooms in owner-occupied houses in Grand Forks, North Dakota
- 111 room
- 02 rooms
- 2903 rooms
- 1,2794 rooms
- 1,4655 rooms
- 1,9386 rooms
- 1,5927 rooms
- 1,7308 rooms
- 3,0569+ rooms
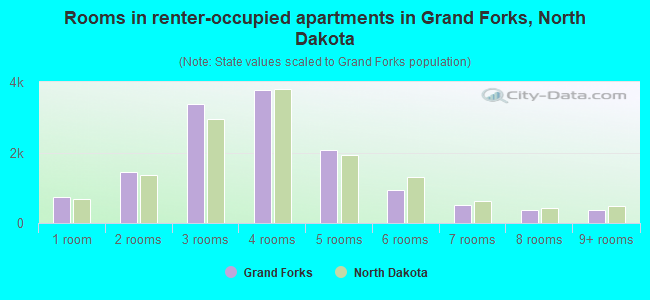
- Rooms in renter-occupied apartments in Grand Forks, North Dakota
- 7331 room
- 1,4412 rooms
- 3,3873 rooms
- 3,7694 rooms
- 2,0625 rooms
- 9506 rooms
- 5087 rooms
- 3648 rooms
- 3609+ rooms
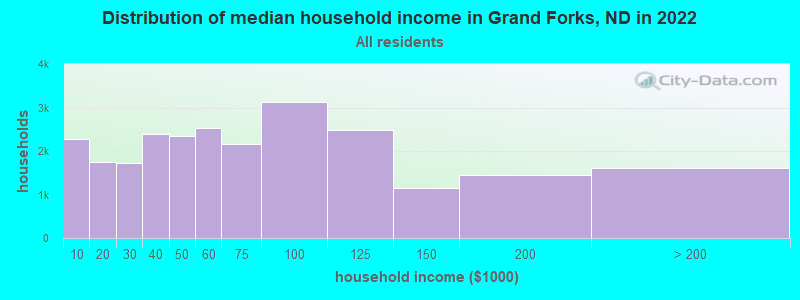
Grand Forks, ND household income distribution

- 2,269Less than $10,000
- 1,751$10,000 to $19,999
- 1,730$20,000 to $29,999
- 2,381$30,000 to $39,999
- 2,348$40,000 to $49,999
- 2,522$50,000 to $59,999
- 2,168$60,000 to $74,999
- 3,121$75,000 to $99,999
- 2,484$100,000 to $124,999
- 1,138$125,000 to $149,999
- 1,458$150,000 to $199,999
- 1,598$200,000 or more
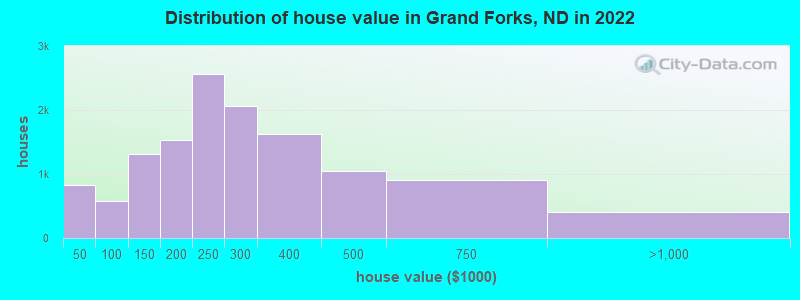
Home value of owner - occupied houses in 2022 in Grand Forks, ND
-
- 200Less than $10,000
- 133$10,000 to $14,999
- 76$15,000 to $19,999
- 176$20,000 to $24,999
- 69$25,000 to $29,999
- 7$30,000 to $34,999
- 68$35,000 to $39,999
- 103$40,000 to $49,999
- 121$50,000 to $59,999
- 13$60,000 to $69,999
- 195$70,000 to $79,999
- 131$80,000 to $89,999
- 15$90,000 to $99,999
- 530$100,000 to $124,999
- 775$125,000 to $149,999
- 1,048$150,000 to $174,999
- 478$175,000 to $199,999
- 2,565$200,000 to $249,999
- 2,060$250,000 to $299,999
- 1,618$300,000 to $399,999
- 1,041$400,000 to $499,999
- 902$500,000 to $749,999
- 373$750,000 to $999,999
- 27$1,000,000 to $1,499,999
- 7$2,000,000 or more
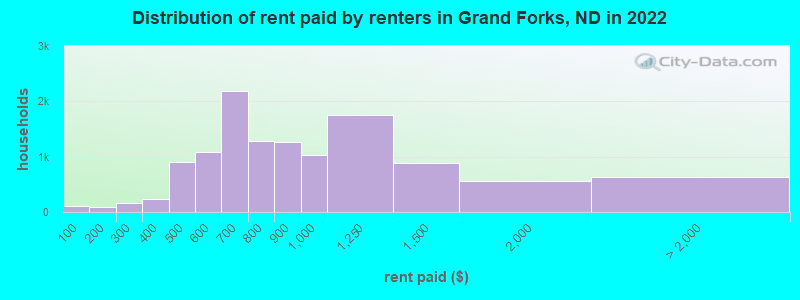
Rent paid by renters in 2022 in Grand Forks, ND
-
- 101Less than $100
- 33$100 to $149
- 52$150 to $199
- 48$200 to $249
- 109$250 to $299
- 168$300 to $349
- 67$350 to $399
- 558$400 to $449
- 350$450 to $499
- 728$500 to $549
- 355$550 to $599
- 815$600 to $649
- 1,375$650 to $699
- 954$700 to $749
- 331$750 to $799
- 1,260$800 to $899
- 1,033$900 to $999
- 1,746$1,000 to $1,249
- 883$1,250 to $1,499
- 563$1,500 to $1,999
- 305$2,000 to $2,499
- 65$2,500 to $2,999
- 129$3,000 to $3,499
- 17$3,500 or more
- 112No cash rent
Percentage of workers working in this county: 91.2%
Number of people working at home: 1,940 (5.9% of all workers)
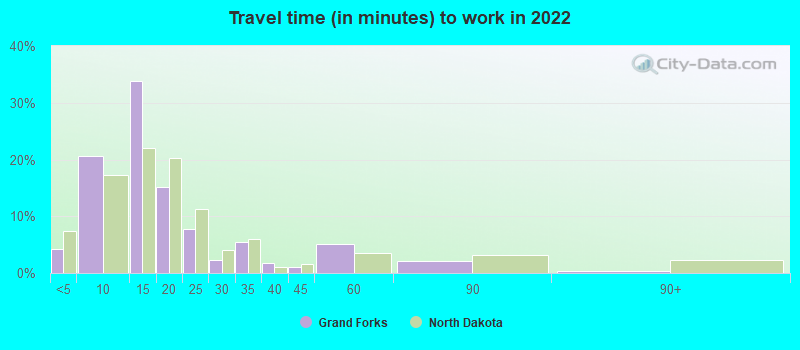
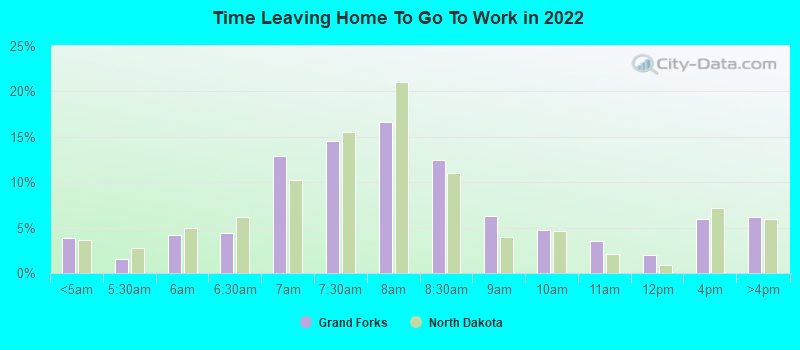
Travel time to work (commute)
- Less than 5 minutes: 1,266
- 5 to 9 minutes: 7,264
- 10 to 14 minutes: 11,746
- 15 to 19 minutes: 4,850
- 20 to 24 minutes: 1,903
- 25 to 29 minutes: 666
- 30 to 34 minutes: 1,524
- 35 to 39 minutes: 266
- 40 to 44 minutes: 248
- 45 to 59 minutes: 921
- 60 to 89 minutes: 403
- 90 or more minutes: 225
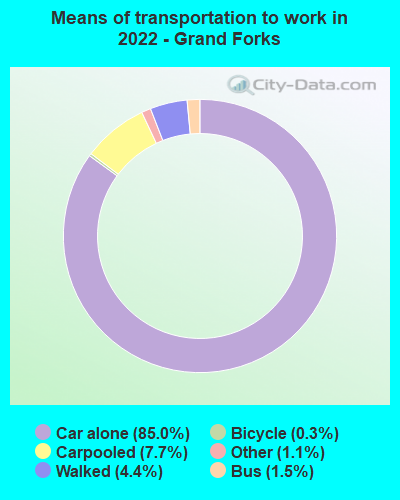
Means of transportation to work:
- Drove a car alone: 29,111 (79.9%)
- Carpooled: 2,772 (7.6%)
- Bus: 345 (0.9%)
- Ferryboat: 13 (0.0%)
- Taxi: 308 (0.8%)
- Bicycle: 130 (0.4%)
- Walked: 1,640 (4.5%)
- Worked at home: 1,940 (5.3%)
- Unemployment by race in 2022
- Unemployment rate for White non-Hispanic residents
- 2.4%Males
- 2.4%Females
- Unemployment rate for Black residents
- 1.6%Males
- 12.9%Females
- Unemployment rate for American Indian and Alaska Native residents
- 7.1%Males
- 1.8%Females
- Unemployment rate for Asian residents
- 0.7%Males
- 1.1%Females
- Unemployment rate for other race residents
- 5.5%Females
- Unemployment rate for two or more race residents
- 7.8%Males
- 3.3%Females
- Unemployment rate for Hispanic or Latino residents
- 15.3%Females
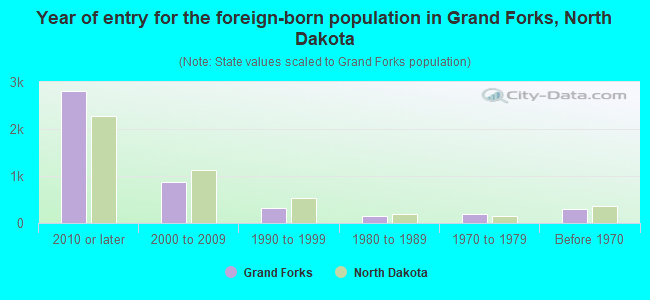
- Year of entry for the foreign-born population in Grand Forks, North Dakota
- 2,8102010 or later
- 8802000 to 2009
- 3241990 to 1999
- 1551980 to 1989
- 1861970 to 1979
- 297Before 1970
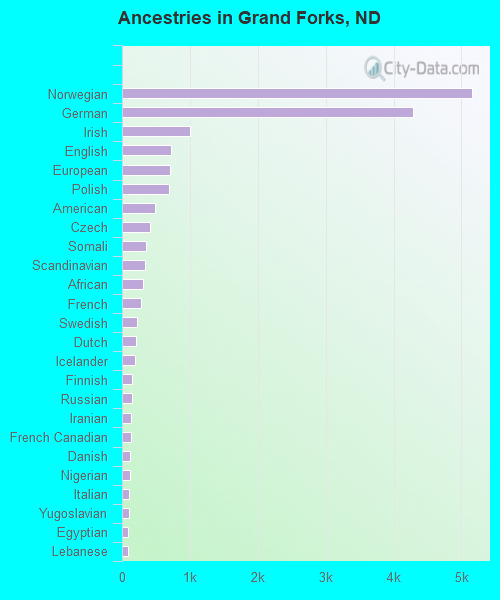
First ancestries reported:
- Norwegian: 5,149 (21.8%)
- German: 4,288 (18.2%)
- Irish: 1,007 (4.3%)
- English: 724 (3.1%)
- European: 702 (3.0%)
- Polish: 687 (2.9%)
- American: 489 (2.1%)
- Czech: 415 (1.8%)
- Somali: 358 (1.5%)
- Scandinavian: 341 (1.4%)
- African: 308 (1.3%)
- French: 284 (1.2%)
- Swedish: 223 (0.9%)
- Dutch: 200 (0.8%)
- Icelander: 195 (0.8%)
- Finnish: 152 (0.6%)
- Russian: 149 (0.6%)
- Iranian: 137 (0.6%)
- French Canadian: 134 (0.6%)
- Danish: 124 (0.5%)
- Nigerian: 112 (0.5%)
- Italian: 106 (0.4%)
- Yugoslavian: 100 (0.4%)
- Egyptian: 91 (0.4%)
- Lebanese: 87 (0.4%)
- Scottish: 85 (0.4%)
- Arab: 75 (0.3%)
- Scotch-Irish: 73 (0.3%)
- Eastern European: 69 (0.3%)
- British: 69 (0.3%)
- British West Indian: 57 (0.2%)
- Jamaican: 54 (0.2%)
- Canadian: 43 (0.2%)
- Turkish: 43 (0.2%)
- Ukrainian: 42 (0.2%)
- Northern European: 41 (0.2%)
- Ghanaian: 30 (0.1%)
- Czechoslovakian: 28 (0.1%)
- Sudanese: 26 (0.1%)
- German Russian: 25 (0.1%)
- Palestinian: 23 (0.10%)
- Kenyan: 18 (0.08%)
- Austrian: 10 (0.04%)
- Swiss: 9 (0.04%)
- Slavic: 9 (0.04%)
- Portuguese: 8 (0.03%)
- Belgian: 8 (0.03%)
- Croatian: 7 (0.03%)
- Liberian: 7 (0.03%)
- Welsh: 5 (0.02%)
- Brazilian: 4 (0.02%)
Most common places of birth for foreign-born residents (%):
| Grand Forks: | 11.8% (490) |
| North Dakota: | 4.2% (1,514) |
| Grand Forks: | 7.3% (302) |
| North Dakota: | 8.7% (3,118) |
| Grand Forks: | 6.5% (271) |
| North Dakota: | 2.2% (778) |
| Grand Forks: | 5.9% (245) |
| North Dakota: | 3.0% (1,073) |
| Grand Forks: | 4.8% (201) |
| North Dakota: | 2.0% (735) |
| Grand Forks: | 4.7% (195) |
| North Dakota: | 2.0% (720) |
| Grand Forks: | 4.2% (175) |
| North Dakota: | 6.9% (2,472) |
| Grand Forks: | 4.2% (175) |
| North Dakota: | 0.7% (267) |
| Grand Forks: | 4.0% (167) |
| North Dakota: | 3.0% (1,068) |
| Grand Forks: | 3.7% (155) |
| North Dakota: | 1.0% (376) |
| Grand Forks: | 2.9% (122) |
| North Dakota: | 8.0% (2,889) |
| Grand Forks: | 2.9% (122) |
| North Dakota: | 0.4% (158) |
| Grand Forks: | 2.9% (121) |
| North Dakota: | 0.7% (259) |
| Grand Forks: | 2.8% (118) |
| North Dakota: | 0.8% (282) |
| Grand Forks: | 2.7% (113) |
| North Dakota: | 0.6% (206) |
| Grand Forks: | 2.0% (85) |
| North Dakota: | 4.3% (1,546) |
| Grand Forks: | 1.9% (79) |
| North Dakota: | 1.5% (542) |
| Grand Forks: | 1.9% (77) |
| North Dakota: | 1.2% (445) |
| Grand Forks: | 1.7% (71) |
| North Dakota: | 0.3% (115) |
Place of birth for U.S.-born residents:
- This state: 32,004
- Other state: 22,553
- Northeast: 1,304
- Midwest: 13,688
- South: 3,542
- West: 3,865
74.7% of Grand Forks residents lived in the same house 1 years ago.
Out of people who lived in different houses, 27.8% lived in this county.
Out of people who lived in different counties, 39.4% lived in North Dakota.
| Grand Forks: | 74.7% |
| State average: | 84.2% |
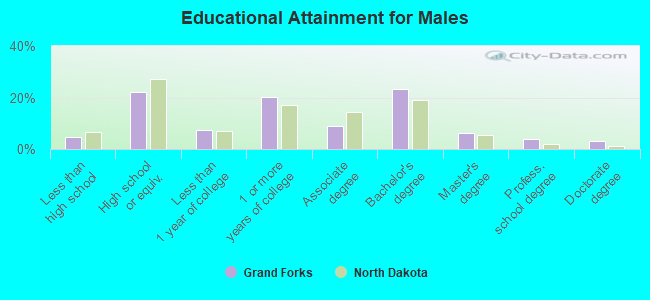
Education attainment for males 25 years and older:
- No schooling: 96
- Nursery to 4th grade: 15
- 5th and 6th grade: 5
- 7th and 8th grade: 47
- 9th grade: 63
- 10th grade: 185
- 11th grade: 197
- 12th grade, no diploma: 204
- High school graduate (or equivalency): 3,809
- Less than 1 year of college: 1,258
- Some college more than 1 year, no degree: 3,468
- Associate degree: 1,511
- Bachelor's degree: 4,032
- Master's degree: 1,092
- Professional school degree: 658
- Doctorate degree: 563
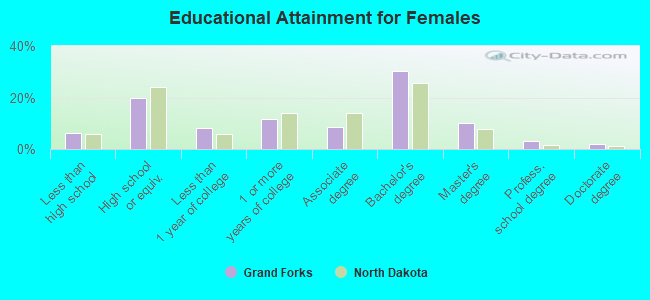
Education attainment for females 25 years and older:
- No schooling: 204
- Nursery to 4th grade: 15
- 5th and 6th grade: 12
- 7th and 8th grade: 351
- 9th grade: 153
- 10th grade: 145
- 11th grade: 81
- 12th grade, no diploma: 68
- High school graduate (or equivalency): 3,293
- Less than 1 year of college: 1,355
- Some college more than 1 year, no degree: 1,979
- Associate degree: 1,421
- Bachelor's degree: 5,099
- Master's degree: 1,666
- Professional school degree: 548
- Doctorate degree: 339


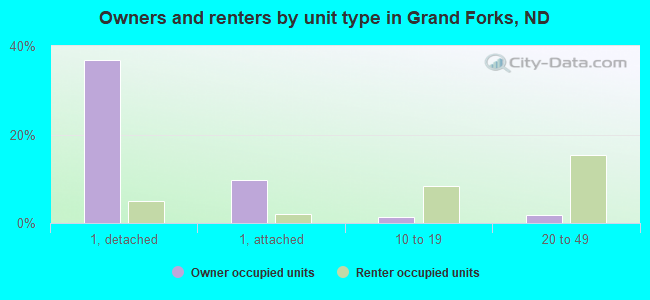
Housing units in structures:
- One, detached: 10,527
- One, attached: 2,529
- Two: 760
- 3 or 4: 1,189
- 5 to 9: 1,382
- 10 to 19: 2,581
- 20 to 49: 4,858
- 50 or more: 3,224
- Mobile homes: 891
- Boats, RVs, vans, etc.: 26
Median worth of mobile homes: $48,065
Housing units lacking complete kitchen facilities in 2022: 0.9%
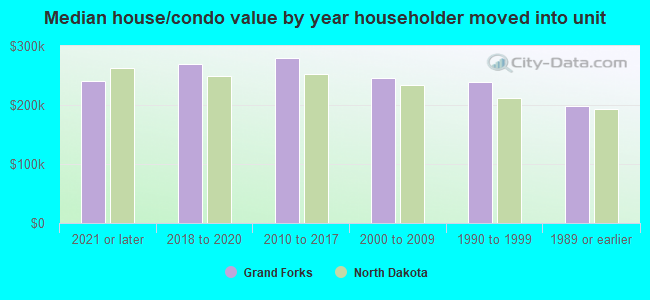
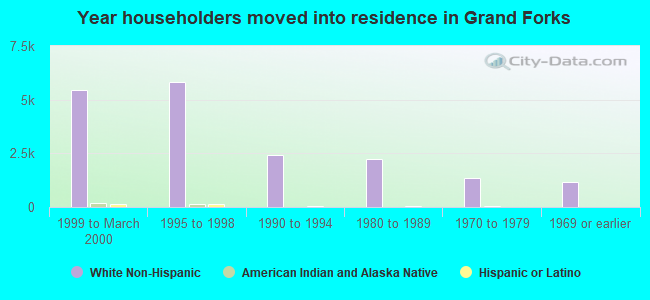
House/condo owner moved in on average 10 years ago
Renter moved in on average 0 years ago
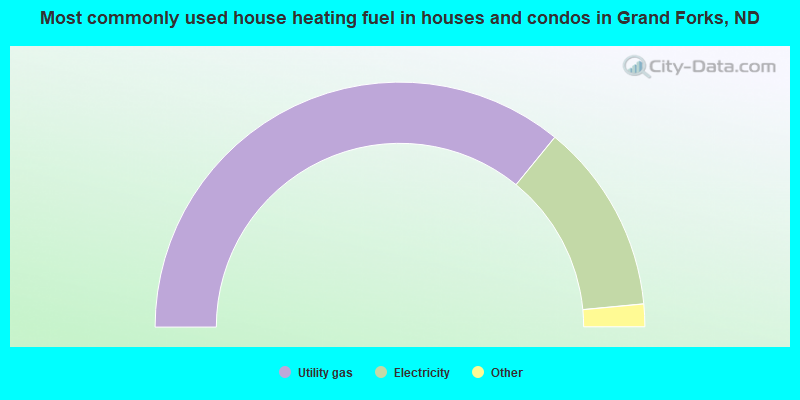
- 71.8%Utility gas
- 25.2%Electricity
- 1.7%Bottled, tank, or LP gas
- 0.7%Fuel oil, kerosene, etc.
- 0.3%Wood
- 0.2%Other fuel
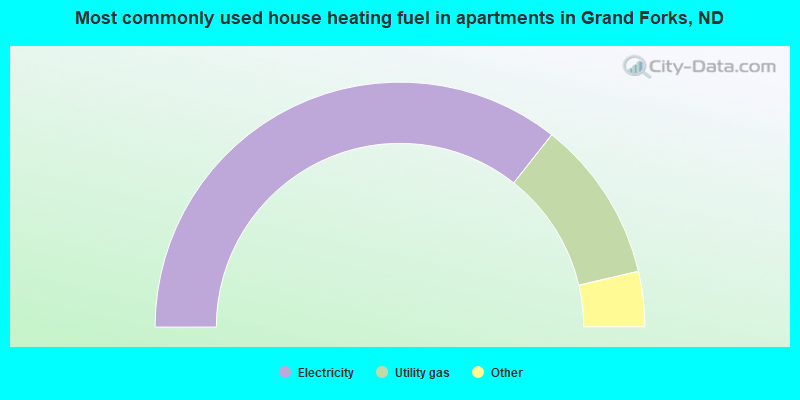
- 71.3%Electricity
- 21.4%Utility gas
- 3.3%No fuel used
- 2.2%Other fuel
- 1.6%Bottled, tank, or LP gas
- 0.3%Coal or coke
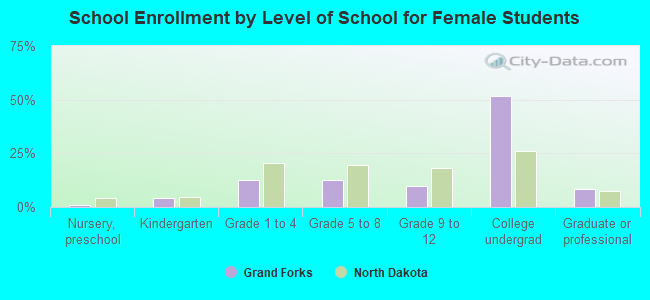
Private vs. public school enrollment:
| Here: | 5.0% |
| North Dakota: | 8.4% |
| Here: | 8.1% |
| North Dakota: | 8.2% |
| Here: | 5.6% |
| North Dakota: | 14.3% |