Knox, IN (Indiana) Houses and Residents
| Knox: | $137,883 |
| Indiana: | $208,700 |
Total population: 3,622 (Urban population: 3,597 (all inside urban clusters), Rural population: 211 (all nonfarm))
Houses: 1,697 (1,476 occupied: 925 owner occupied, 568 renter occupied)
| % of renters here: | 38% |
| State: | 29% |
Housing density: 432 houses/condos per square mile
Median price asked for vacant for-sale houses and condos in 2022: $133,785.
Median contract rent in 2022: $424 (lower quartile is $339, upper quartile is $633)
Median rent asked for vacant for-rent units in 2022: $270
Median gross rent in Knox, IN in 2022: $608
Housing units in Knox with a mortgage: 525 (21 second mortgage, 0 home equity loan, 8 both second mortgage and home equity loan)
Houses without a mortgage: 13
Median household income for houses/condos with a mortgage: $73,101
Median household income for apartments without a mortgage: $58,577
Median monthly housing costs: $669
Compare current foreclosures near Knox, IN:
| Photo | Address | Area | Beds / Baths | Price | Details |
|---|---|---|---|---|---|

|
#1
E 100 N
Knox, IN 46534
|
- sq. feet
|
1 baths 3 beds |
$39,900
|
show details |

|
#2
Williams St
Knox, IN 46534
|
- sq. feet
|
1 baths 3 beds |
show details | |

|
#3
E Debby Dr
Knox, IN 46534
|
1,284 sq. feet
|
1 baths 3 beds |
show details | |

|
#4
S Shield St
Knox, IN 46534
|
1,036 sq. feet
|
1 baths 4 beds |
show details | |

|
#5
S State Road 23
Knox, IN 46534
|
1,392 sq. feet
|
1 baths 3 beds |
show details | |

|
#6
S Shield St
Knox, IN 46534
|
2,158 sq. feet
|
1 baths 4 beds |
show details | |

|
#7
E Washington St
Knox, IN 46534
|
1,141 sq. feet
|
1 baths 2 beds |
show details | |

|
#8
E Washington St
Knox, IN 46534
|
1,190 sq. feet
|
1 baths 2 beds |
show details | |

|
#9
S 350 E
Knox, IN 46534
|
1,500 sq. feet
|
2 baths 3 beds |
show details | |

|
#10
E 200 S
Knox, IN 46534
|
1,080 sq. feet
|
1 baths 3 beds |
show details |
| Photo | Address | Area | Beds / Baths | Price | Details |
|---|---|---|---|---|---|

|
#11
S Shield St
Knox, IN 46534
|
864 sq. feet
|
1 baths 2 beds |
show details | |

|
#12
Binkley Dr
Knox, IN 46534
|
1,008 sq. feet
|
1 baths 3 beds |
show details | |

|
#13
E Toto Rd
Knox, IN 46534
|
1,400 sq. feet
|
2 baths 3 beds |
show details | |

|
#14
S 250 E
Knox, IN 46534
|
2,052 sq. feet
|
1 baths 3 beds |
show details | |

|
#15
E 350 S
Knox, IN 46534
|
1,512 sq. feet
|
2 baths 4 beds |
show details | |

|
#16
E Long Lane Dr
Knox, IN 46534
|
1,584 sq. feet
|
2 baths 3 beds |
show details | |

|
#17
E 150 N
Knox, IN 46534
|
1,248 sq. feet
|
2 baths 3 beds |
show details | |

|
#18
E 100 N
Knox, IN 46534
|
- sq. feet
|
- baths - beds |
show details | |

|
#19
E Washington St
Knox, IN 46534
|
- sq. feet
|
- baths - beds |
show details | |

|
#20
S 300 E
Knox, IN 46534
|
- sq. feet
|
- baths - beds |
show details |
| Photo | Address | Area | Beds / Baths | Price | Details |
|---|---|---|---|---|---|

|
#21
E Lake St
Knox, IN 46534
|
- sq. feet
|
- baths - beds |
show details | |

|
#22
S Bower St
Knox, IN 46534
|
- sq. feet
|
- baths - beds |
show details | |

|
#23
S Bower St
Knox, IN 46534
|
- sq. feet
|
- baths - beds |
show details | |

|
#24
E 50 S
Knox, IN 46534
|
- sq. feet
|
- baths - beds |
show details | |

|
#25
E 150 N
Knox, IN 46534
|
- sq. feet
|
- baths - beds |
show details | |

|
#26
W 250 S
Knox, IN 46534
|
- sq. feet
|
- baths - beds |
show details | |

|
#27
East Indiana State Road 8
Knox, IN 46534
|
- sq. feet
|
- baths - beds |
show details | |

|
#28
N 1200 E
Knox, IN 46534
|
- sq. feet
|
- baths - beds |
show details | |

|
#29
Oakwood St
North Judson, IN 46366
|
1,936 sq. feet
|
2 baths 5 beds |
show details | |

|
#30
Mill St
La Crosse, IN 46348
|
1,632 sq. feet
|
2 baths 4 beds |
show details |
| Photo | Address | Area | Beds / Baths | Price | Details |
|---|---|---|---|---|---|

|
#31
W 800 N
San Pierre, IN 46374
|
1,536 sq. feet
|
2 baths 3 beds |
show details | |

|
#32
Underwood Rd
Walkerton, IN 46574
|
1,560 sq. feet
|
2 baths 4 beds |
show details | |

|
#33
E Wheeler St
Hanna, IN 46340
|
1,620 sq. feet
|
1 baths 3 beds |
show details | |

|
#34
Ivanhoe Rd
Kingsford Heights, IN 46346
|
560 sq. feet
|
1 baths 1 beds |
show details | |

|
#35
N Us Highway 421
San Pierre, IN 46374
|
1,196 sq. feet
|
2 baths 3 beds |
show details | |

|
#36
E 500 S
Laporte, IN 46350
|
1,904 sq. feet
|
2 baths 4 beds |
show details | |

|
#37
Monroe St
Walkerton, IN 46574
|
1,790 sq. feet
|
1 baths 4 beds |
show details | |

|
#38
E Young St
Hanna, IN 46340
|
1,550 sq. feet
|
2 baths 3 beds |
show details | |

|
#39
E 860 S
Hamlet, IN 46532
|
1,152 sq. feet
|
2 baths 3 beds |
show details | |

|
#40
Clark St
Walkerton, IN 46574
|
1,456 sq. feet
|
2 baths 3 beds |
show details |
| Photo | Address | Area | Beds / Baths | Price | Details |
|---|---|---|---|---|---|

|
#41
Grayton Rd
Kingsford Heights, IN 46346
|
1,047 sq. feet
|
2 baths 3 beds |
show details | |

|
#42
N Hazel Rd
Monterey, IN 46960
|
1,872 sq. feet
|
1 baths 1 beds |
show details | |

|
#43
Quince Rd
Plymouth, IN 46563
|
1,800 sq. feet
|
1 baths 3 beds |
show details | |

|
#44
Kentucky St
Walkerton, IN 46574
|
868 sq. feet
|
1 baths 4 beds |
show details | |

|
#45
Sunset Dr
Walkerton, IN 46574
|
1,056 sq. feet
|
1 baths 2 beds |
show details | |

|
#46
Menominee Dr
Plymouth, IN 46563
|
1,048 sq. feet
|
1 baths 3 beds |
show details | |

|
#47
Oak Ct
Plymouth, IN 46563
|
2,640 sq. feet
|
2 baths 4 beds |
show details | |

|
#48
Pennsylvania Ave
Plymouth, IN 46563
|
1,757 sq. feet
|
1 baths 3 beds |
show details | |

|
#49
N Broadway St
San Pierre, IN 46374
|
2,194 sq. feet
|
1 baths 3 beds |
show details | |

|
Check over 1 million property listings on Foreclosure.com!
|
browse all offers | |||

Latest news about housing in Knox, IN collected exclusively by city-data.com from local newspapers, TV, and radio stations

 | Looking for apartments under $500/month in NWI (3 replies) |
| Homes have no basements?? (25 replies) |
| Hamlet, Indiana (1 reply) |
| Illinois To NWI Migration (361 replies) |
| Cabela's, Bass Pro Shops and IKEA (91 replies) |
| Relocating to Greenwood, IN. What areas are good and what to avoid ? (18 replies) |

Median year apartment built: 1979
Household type by relationship:
Households: 3,874- Male householders: 642 (166 living alone), Female householders: 821 (286 living alone)
557 spouses (557 opposite-sex spouses), 252 unmarried partners, (252 opposite-sex unmarried partners), 1,203 children (1,006 natural, 76 adopted, 120 stepchildren), 203 grandchildren, 0 brothers or sisters, 14 parents, 0 foster children, 127 other relatives, 14 non-relatives
- In group quarters: 36
Size of family households: 402 2-persons, 230 3-persons, 93 4-persons, 82 5-persons, 105 6-persons, 42 7-or-more-persons.
Size of nonfamily households: 463 1-person, 80 2-persons.
493 married couples with children.
335 single-parent households (94 men, 241 women).
95.3% of residents of Knox speak English at home.
2.2% of residents speak Spanish at home (91% speak English very well, 9% speak English not well).
1.4% of residents speak other Indo-European language at home (80% speak English very well, 20% speak English well).
0.1% of residents speak Asian or Pacific Island language at home (50% speak English very well, 50% speak English well).
0.7% of residents speak other language at home (100% speak English very well).
Foreign born population: 48 (1.2%)
(12.5% of them are naturalized citizens)
| Here: | 6.5 |
| State: | 6.6 |
| Here: | 4.2 |
| State: | 4.3 |

- Bedrooms in owner-occupied houses and condos in Knox, Indiana
- 0no bedroom
- 111 bedroom
- 1902 bedrooms
- 4813 bedrooms
- 2344 bedrooms
- 95+ bedrooms

- Bedrooms in renter-occupied apartments in Knox, Indiana
- 3no bedroom
- 2441 bedroom
- 902 bedrooms
- 2113 bedrooms
- 214 bedrooms
- 05+ bedrooms

- Cars and other vehicles available in Knox in owner-occupied houses/condos
- 28no vehicle
- 1941 vehicle
- 4502 vehicles
- 1673 vehicles
- 664 vehicles
- 215+ vehicles

- Cars and other vehicles available in Knox in renter-occupied apartments
- 157no vehicle
- 2951 vehicle
- 1052 vehicles
- 113 vehicles
- 04 vehicles
- 05+ vehicles

- Rooms in owner-occupied houses in Knox, Indiana
- 01 room
- 02 rooms
- 03 rooms
- 834 rooms
- 1875 rooms
- 1886 rooms
- 1837 rooms
- 1818 rooms
- 1049+ rooms

- Rooms in renter-occupied apartments in Knox, Indiana
- 31 room
- 622 rooms
- 1233 rooms
- 1154 rooms
- 345 rooms
- 1746 rooms
- 07 rooms
- 588 rooms
- 09+ rooms


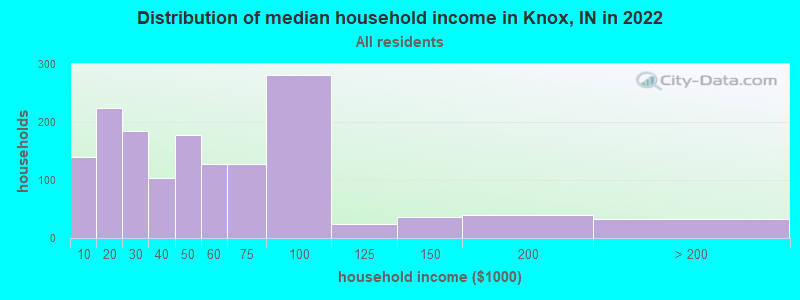
Knox, IN household income distribution

- 140Less than $10,000
- 225$10,000 to $19,999
- 185$20,000 to $29,999
- 104$30,000 to $39,999
- 177$40,000 to $49,999
- 127$50,000 to $59,999
- 127$60,000 to $74,999
- 281$75,000 to $99,999
- 25$100,000 to $124,999
- 36$125,000 to $149,999
- 40$150,000 to $199,999
- 33$200,000 or more
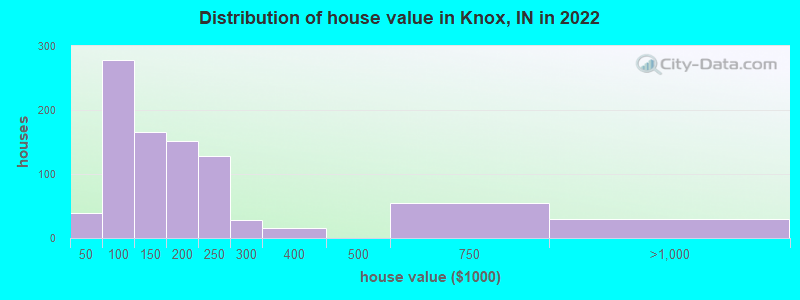
Home value of owner - occupied houses in 2022 in Knox, IN
-
- 20Less than $10,000
- 11$10,000 to $14,999
- 6$35,000 to $39,999
- 32$50,000 to $59,999
- 50$60,000 to $69,999
- 114$70,000 to $79,999
- 59$80,000 to $89,999
- 20$90,000 to $99,999
- 115$100,000 to $124,999
- 49$125,000 to $149,999
- 144$150,000 to $174,999
- 7$175,000 to $199,999
- 127$200,000 to $249,999
- 28$250,000 to $299,999
- 16$300,000 to $399,999
- 54$500,000 to $749,999
- 28$750,000 to $999,999
Rent paid by renters in 2022 in Knox, IN
-
- 6$100 to $149
- 26$150 to $199
- 37$200 to $249
- 27$250 to $299
- 48$300 to $349
- 101$350 to $399
- 16$400 to $449
- 58$450 to $499
- 22$500 to $549
- 21$550 to $599
- 29$600 to $649
- 44$650 to $699
- 49$750 to $799
- 2$800 to $899
- 11$1,000 to $1,249
- 20No cash rent


Percentage of workers working in this county: 42.8%
Number of people working at home: 41 (3.1% of all workers)
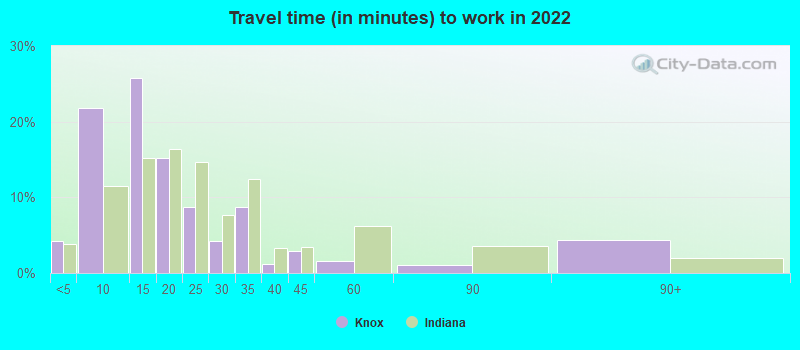
Travel time to work (commute)
- Less than 5 minutes: 62
- 5 to 9 minutes: 209
- 10 to 14 minutes: 155
- 15 to 19 minutes: 41
- 20 to 24 minutes: 36
- 25 to 29 minutes: 177
- 30 to 34 minutes: 272
- 35 to 39 minutes: 0
- 40 to 44 minutes: 45
- 45 to 59 minutes: 116
- 60 to 89 minutes: 112
- 90 or more minutes: 28
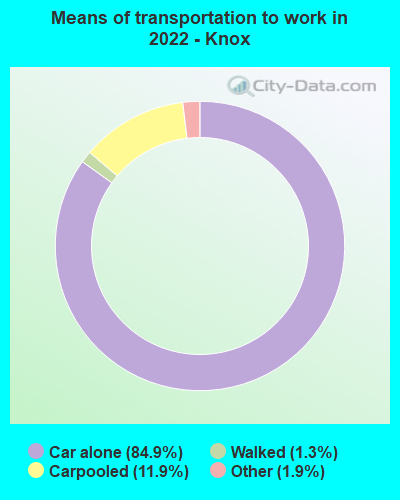
Means of transportation to work:
- Drove a car alone: 1,795 (80.5%)
- Carpooled: 278 (12.5%)
- Taxi: 47 (2.1%)
- Walked: 26 (1.2%)
- Worked at home: 41 (1.8%)

- Unemployment by race in 2022
- Unemployment rate for White non-Hispanic residents
- 2.7%Males
- 1.7%Females

- Year of entry for the foreign-born population in Knox, Indiana
- 212010 or later
- 222000 to 2009
- 01990 to 1999
- 491980 to 1989
- 141970 to 1979
- 38Before 1970

First ancestries reported:
- American: 307 (31.4%)
- German: 257 (26.3%)
- Irish: 36 (3.7%)
- Dutch: 25 (2.6%)
- Scottish: 24 (2.5%)
- Polish: 22 (2.2%)
- English: 19 (1.9%)
- Romanian: 16 (1.6%)
- Welsh: 10 (1.0%)
- Czechoslovakian: 8 (0.8%)
- Italian: 8 (0.8%)
- Lithuanian: 7 (0.7%)
- Scotch-Irish: 7 (0.7%)
- Hungarian: 5 (0.5%)
Most common places of birth for foreign-born residents (%):
| Knox: | 47.9% (23) |
| Indiana: | 0.1% (204) |
| Knox: | 35.4% (17) |
| Indiana: | 27.0% (101,996) |
| Knox: | 16.7% (8) |
| Indiana: | 0.4% (1,537) |
| Knox: | 10.4% (5) |
| Indiana: | 5.3% (19,877) |
Place of birth for U.S.-born residents:
- This state: 2,926
- Other state: 879
- Northeast: 84
- Midwest: 445
- South: 301
- West: 43
86.1% of Knox residents lived in the same house 1 years ago.
Out of people who lived in different houses, 20.5% lived in this county.
Out of people who lived in different counties, 41.8% lived in Indiana.
| Knox: | 86.1% |
| State average: | 87.1% |
Education attainment for males 25 years and older:
- No schooling: 24
- Nursery to 4th grade: 0
- 5th and 6th grade: 5
- 7th and 8th grade: 40
- 9th grade: 56
- 10th grade: 45
- 11th grade: 12
- 12th grade, no diploma: 14
- High school graduate (or equivalency): 520
- Less than 1 year of college: 66
- Some college more than 1 year, no degree: 87
- Associate degree: 9
- Bachelor's degree: 114
- Master's degree: 46
- Professional school degree: 15
- Doctorate degree: 0

Education attainment for females 25 years and older:
- No schooling: 93
- Nursery to 4th grade: 0
- 5th and 6th grade: 0
- 7th and 8th grade: 134
- 9th grade: 15
- 10th grade: 25
- 11th grade: 72
- 12th grade, no diploma: 0
- High school graduate (or equivalency): 544
- Less than 1 year of college: 80
- Some college more than 1 year, no degree: 152
- Associate degree: 52
- Bachelor's degree: 185
- Master's degree: 93
- Professional school degree: 0
- Doctorate degree: 3


Housing units in structures:
- One, detached: 1,195
- Two: 134
- 3 or 4: 46
- 5 to 9: 93
- 10 to 19: 68
- 20 to 49: 107
- 50 or more: 11
- Mobile homes: 41
Housing units lacking complete kitchen facilities in 2022: 0.4%
House/condo owner moved in on average 9 years ago
Renter moved in on average 5 years ago

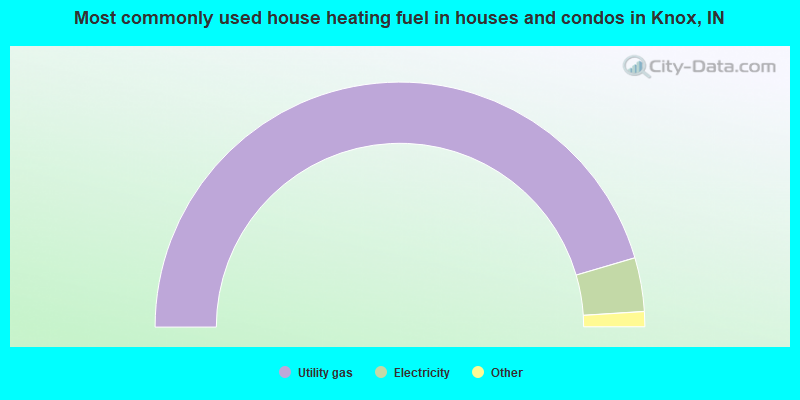
- 91.0%Utility gas
- 7.1%Electricity
- 1.0%Bottled, tank, or LP gas
- 0.9%No fuel used
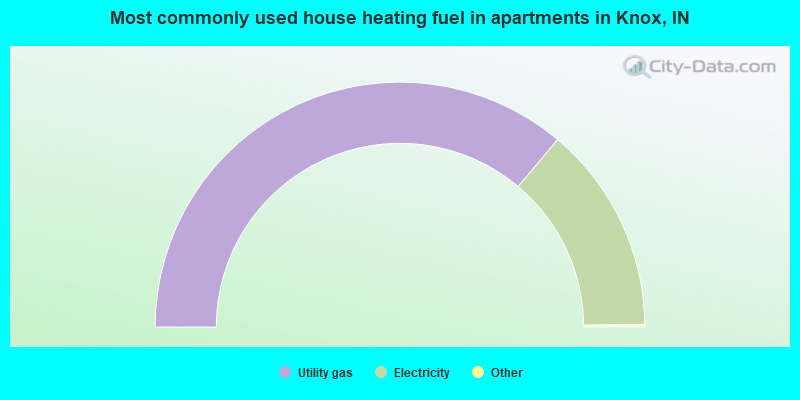
- 72.5%Utility gas
- 27.5%Electricity
Private vs. public school enrollment:
| Here: | 0.0% |
| Indiana: | 14.9% |
| Here: | 10.0% |
| Indiana: | 11.4% |
| Here: | 0.0% |
| Indiana: | 22.3% |


