La Vergne, TN (Tennessee) Houses and Residents
| La Vergne: | $315,034 |
| Tennessee: | $284,800 |
Total population: 34,274 (Urban population: 17,834, Rural population: 1,080 (all nonfarm))
Houses: 14,480 (13,721 occupied: 10,138 owner occupied, 3,946 renter occupied)
| % of renters here: | 28% |
| State: | 33% |
Housing density: 584 houses/condos per square mile
Median price asked for vacant for-sale houses and condos in 2022: $166,394.
Median contract rent in 2022: $1,420 (lower quartile is $1,068, upper quartile is $1,858)
Median rent asked for vacant for-rent units in 2022: $1,049
Median gross rent in La Vergne, TN in 2022: $1,633
Housing units in La Vergne with a mortgage: 7,231 (591 second mortgage, 0 home equity loan, 400 both second mortgage and home equity loan)
Houses without a mortgage: 75
Median household income for houses/condos with a mortgage: $79,863
Median household income for apartments without a mortgage: $65,745
Median monthly housing costs: $1,316
Compare current foreclosures in La Vergne, TN:
| Photo | Address | Area | Beds / Baths | Price | Details |
|---|---|---|---|---|---|

|
#1
Sagi Cir
La Vergne, TN 37086
|
1,280 sq. feet
|
2 baths - beds |
show details | |

|
#2
Briargrove Dr
La Vergne, TN 37086
|
1,555 sq. feet
|
2 baths - beds |
show details | |

|
#3
Lavergne Ln
La Vergne, TN 37086
|
1,215 sq. feet
|
2 baths - beds |
show details | |

|
#4
Center St
La Vergne, TN 37086
|
1,481 sq. feet
|
2 baths - beds |
show details | |

|
#5
James Gafford Dr
La Vergne, TN 37086
|
1,020 sq. feet
|
2 baths - beds |
show details | |

|
#6
Judge Mason Way
La Vergne, TN 37086
|
1,086 sq. feet
|
2 baths - beds |
show details | |

|
#7
Waldron Rd
La Vergne, TN 37086
|
1,475 sq. feet
|
2 baths - beds |
show details | |

|
#8
Cedar Park Cir
La Vergne, TN 37086
|
1,583 sq. feet
|
2 baths - beds |
show details | |

|
#9
Blue Lake Ln
La Vergne, TN 37086
|
1,296 sq. feet
|
2 baths - beds |
show details | |

|
#10
Fruitland Ct
La Vergne, TN 37086
|
1,400 sq. feet
|
2 baths - beds |
show details |
| Photo | Address | Area | Beds / Baths | Price | Details |
|---|---|---|---|---|---|

|
#11
Taylor Dr
La Vergne, TN 37086
|
1,025 sq. feet
|
1 baths - beds |
show details | |

|
#12
Hollandale Rd
La Vergne, TN 37086
|
1,882 sq. feet
|
3 baths - beds |
show details | |

|
#13
Park Ct N
La Vergne, TN 37086
|
1,521 sq. feet
|
2 baths - beds |
show details | |

|
#14
E Lake Cv
La Vergne, TN 37086
|
1,721 sq. feet
|
3 baths - beds |
show details | |

|
#15
Debbie Ln
La Vergne, TN 37086
|
1,714 sq. feet
|
3 baths - beds |
show details | |

|
#16
Walnut Ridge Dr
La Vergne, TN 37086
|
2,025 sq. feet
|
3 baths - beds |
show details | |

|
#17
Mountain Top Trl
La Vergne, TN 37086
|
1,150 sq. feet
|
2 baths - beds |
show details | |

|
#18
Minerva Dr
La Vergne, TN 37086
|
1,075 sq. feet
|
1 baths - beds |
show details | |

|
#19
Margo Cir
La Vergne, TN 37086
|
1,469 sq. feet
|
2 baths - beds |
show details | |

|
#20
Constitution Ave
La Vergne, TN 37086
|
1,413 sq. feet
|
2 baths - beds |
show details |
| Photo | Address | Area | Beds / Baths | Price | Details |
|---|---|---|---|---|---|

|
#21
Campbell Pl
La Vergne, TN 37086
|
1,325 sq. feet
|
1 baths - beds |
show details | |

|
#22
Watersedge Ln
La Vergne, TN 37086
|
1,014 sq. feet
|
1 baths - beds |
show details | |

|
#23
Tuffnell Dr
La Vergne, TN 37086
|
1,270 sq. feet
|
2 baths - beds |
show details | |

|
#24
Stone Meadow Ct
La Vergne, TN 37086
|
2,114 sq. feet
|
2 baths - beds |
show details | |

|
#25
Lavergne Ln
La Vergne, TN 37086
|
1,296 sq. feet
|
2 baths - beds |
show details | |

|
#26
Elberon Ct
La Vergne, TN 37086
|
1,208 sq. feet
|
2 baths - beds |
show details | |

|
#27
Patty Cv
La Vergne, TN 37086
|
1,240 sq. feet
|
2 baths - beds |
show details | |

|
#28
Sanders Dr
La Vergne, TN 37086
|
1,730 sq. feet
|
2 baths - beds |
show details | |

|
#29
Freedom Ct
La Vergne, TN 37086
|
1,189 sq. feet
|
2 baths - beds |
show details | |

|
#30
Davids Way
La Vergne, TN 37086
|
2,556 sq. feet
|
3 baths - beds |
show details |
| Photo | Address | Area | Beds / Baths | Price | Details |
|---|---|---|---|---|---|

|
#31
Centennial Dr
La Vergne, TN 37086
|
1,016 sq. feet
|
2 baths - beds |
show details | |

|
#32
Tom Hailey Blvd
La Vergne, TN 37086
|
1,291 sq. feet
|
2 baths - beds |
show details | |

|
#33
John Henry Dr
La Vergne, TN 37086
|
1,872 sq. feet
|
3 baths - beds |
show details | |

|
#34
Margo Cir
La Vergne, TN 37086
|
1,510 sq. feet
|
3 baths - beds |
show details | |

|
#35
Arlene Dr
La Vergne, TN 37086
|
1,092 sq. feet
|
- baths - beds |
show details | |

|
#36
Sima Shabat Ct
La Vergne, TN 37086
|
1,782 sq. feet
|
2 baths - beds |
show details | |

|
#37
Brookridge Dr
La Vergne, TN 37086
|
1,092 sq. feet
|
1 baths - beds |
show details | |

|
#38
Davids Way
La Vergne, TN 37086
|
1,719 sq. feet
|
2 baths - beds |
show details | |

|
#39
Betty Lou Ln
La Vergne, TN 37086
|
1,264 sq. feet
|
2 baths - beds |
show details | |

|
#40
Sima Shabat Ct
La Vergne, TN 37086
|
1,264 sq. feet
|
2 baths - beds |
show details |
| Photo | Address | Area | Beds / Baths | Price | Details |
|---|---|---|---|---|---|

|
#41
Patty Cv
La Vergne, TN 37086
|
1,380 sq. feet
|
2 baths - beds |
show details | |

|
#42
Blake Moore Dr
La Vergne, TN 37086
|
1,331 sq. feet
|
2 baths - beds |
show details | |

|
#43
Cullen Dr
La Vergne, TN 37086
|
1,282 sq. feet
|
2 baths - beds |
show details | |

|
#44
Nicole Ln
La Vergne, TN 37086
|
1,825 sq. feet
|
2 baths - beds |
show details | |

|
#45
Mill Dr
La Vergne, TN 37086
|
1,152 sq. feet
|
2 baths - beds |
show details | |

|
#46
Mary Joe Martin Dr
La Vergne, TN 37086
|
2,182 sq. feet
|
3 baths - beds |
show details | |

|
#47
Pearson Ln
La Vergne, TN 37086
|
1,297 sq. feet
|
2 baths - beds |
show details | |

|
#48
Weatherford St
La Vergne, TN 37086
|
1,302 sq. feet
|
2 baths - beds |
show details | |

|
#49
Micheles Way
La Vergne, TN 37086
|
1,836 sq. feet
|
2 baths - beds |
show details | |

|
Check over 1 million property listings on Foreclosure.com!
|
browse all offers | |||


Median year apartment built: 2003
Household type by relationship:
Households: 40,447- Male householders: 7,031 (1,130 living alone), Female householders: 6,586 (1,165 living alone)
7,077 spouses (7,048 opposite-sex spouses), 1,223 unmarried partners, (1,188 opposite-sex unmarried partners), 13,949 children (12,929 natural, 251 adopted, 767 stepchildren), 1,099 grandchildren, 869 brothers or sisters, 757 parents, 48 foster children, 1,148 other relatives, 648 non-relatives
- In group quarters: 7
Size of family households: 3,864 2-persons, 2,854 3-persons, 2,038 4-persons, 1,408 5-persons, 479 6-persons, 323 7-or-more-persons.
Size of nonfamily households: 2,443 1-person, 681 2-persons, 33 3-persons, 10 4-persons.
6,432 married couples with children.
3,633 single-parent households (1,029 men, 2,604 women).
73.7% of residents of La Vergne speak English at home.
18.4% of residents speak Spanish at home (50% speak English very well, 20% speak English well, 19% speak English not well, 10% don't speak English at all).
1.8% of residents speak other Indo-European language at home (76% speak English very well, 19% speak English well, 5% speak English not well).
2.6% of residents speak Asian or Pacific Island language at home (52% speak English very well, 17% speak English well, 31% speak English not well, 1% don't speak English at all).
4.1% of residents speak other language at home (62% speak English very well, 23% speak English well, 13% speak English not well, 2% don't speak English at all).
Foreign born population: 8,724 (21.6%)
(37.8% of them are naturalized citizens)
| Here: | 5.7 |
| State: | 6.5 |
| Here: | 5.7 |
| State: | 4.4 |

- Bedrooms in owner-occupied houses and condos in La Vergne, Tennessee
- 13no bedroom
- 931 bedroom
- 1,2362 bedrooms
- 6,7633 bedrooms
- 1,8724 bedrooms
- 1625+ bedrooms

- Bedrooms in renter-occupied apartments in La Vergne, Tennessee
- 28no bedroom
- 1041 bedroom
- 8542 bedrooms
- 2,2763 bedrooms
- 4464 bedrooms
- 2395+ bedrooms

- Cars and other vehicles available in La Vergne in owner-occupied houses/condos
- 94no vehicle
- 2,3261 vehicle
- 4,8662 vehicles
- 1,6873 vehicles
- 7674 vehicles
- 3985+ vehicles

- Cars and other vehicles available in La Vergne in renter-occupied apartments
- 104no vehicle
- 1,2131 vehicle
- 1,9472 vehicles
- 5423 vehicles
- 414 vehicles
- 1005+ vehicles

- Rooms in owner-occupied houses in La Vergne, Tennessee
- 01 room
- 02 rooms
- 1743 rooms
- 1,1994 rooms
- 2,9275 rooms
- 2,4936 rooms
- 1,2467 rooms
- 1,0188 rooms
- 1,0839+ rooms

- Rooms in renter-occupied apartments in La Vergne, Tennessee
- 281 room
- 202 rooms
- 2093 rooms
- 4064 rooms
- 1,0085 rooms
- 9476 rooms
- 7287 rooms
- 2828 rooms
- 3189+ rooms


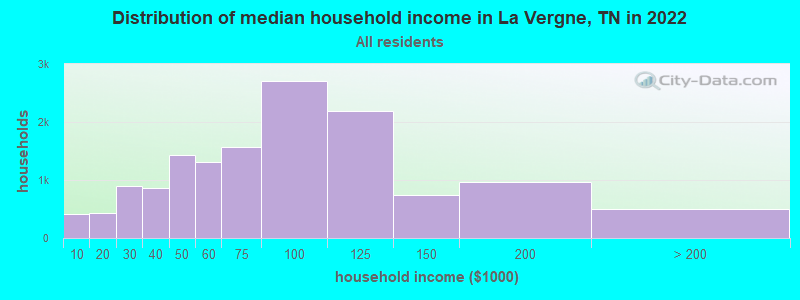
La Vergne, TN household income distribution

- 421Less than $10,000
- 436$10,000 to $19,999
- 888$20,000 to $29,999
- 856$30,000 to $39,999
- 1,430$40,000 to $49,999
- 1,312$50,000 to $59,999
- 1,574$60,000 to $74,999
- 2,704$75,000 to $99,999
- 2,194$100,000 to $124,999
- 743$125,000 to $149,999
- 959$150,000 to $199,999
- 508$200,000 or more
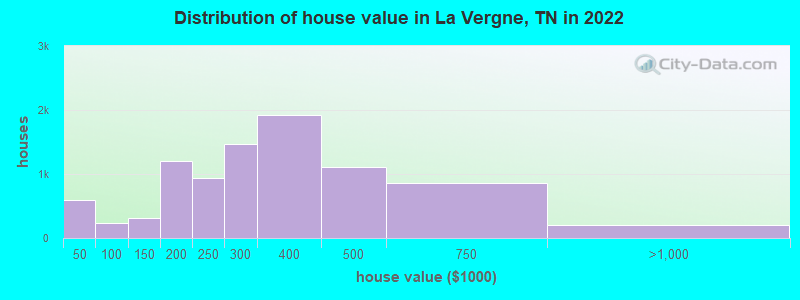
Home value of owner - occupied houses in 2022 in La Vergne, TN
-
- 321Less than $10,000
- 4$10,000 to $14,999
- 3$15,000 to $19,999
- 105$20,000 to $24,999
- 90$25,000 to $29,999
- 46$30,000 to $34,999
- 17$35,000 to $39,999
- 6$50,000 to $59,999
- 113$70,000 to $79,999
- 118$90,000 to $99,999
- 87$100,000 to $124,999
- 218$125,000 to $149,999
- 606$150,000 to $174,999
- 597$175,000 to $199,999
- 939$200,000 to $249,999
- 1,470$250,000 to $299,999
- 1,924$300,000 to $399,999
- 1,111$400,000 to $499,999
- 859$500,000 to $749,999
- 179$750,000 to $999,999
- 18$1,000,000 to $1,499,999
Rent paid by renters in 2022 in La Vergne, TN
-
- 21$250 to $299
- 11$350 to $399
- 32$450 to $499
- 149$500 to $549
- 36$550 to $599
- 79$600 to $649
- 42$650 to $699
- 16$700 to $749
- 43$750 to $799
- 118$800 to $899
- 179$900 to $999
- 736$1,000 to $1,249
- 509$1,250 to $1,499
- 1,511$1,500 to $1,999
- 385$2,000 to $2,499
- 35$2,500 to $2,999
- 103No cash rent


Percentage of workers working in this county: 56.0%
Number of people working at home: 3,129 (14.3% of all workers)
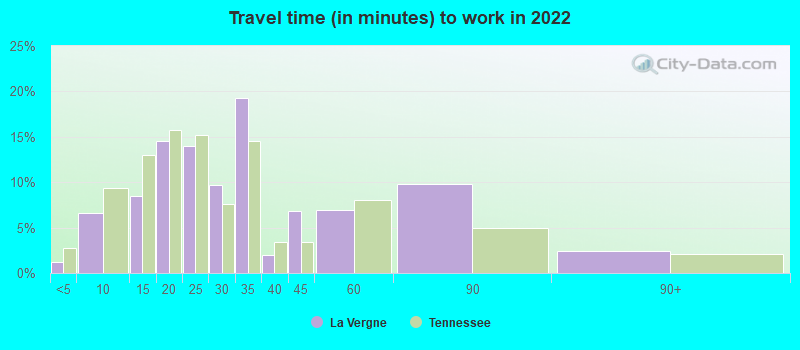
Travel time to work (commute)
- Less than 5 minutes: 175
- 5 to 9 minutes: 1,338
- 10 to 14 minutes: 1,383
- 15 to 19 minutes: 2,770
- 20 to 24 minutes: 1,527
- 25 to 29 minutes: 1,340
- 30 to 34 minutes: 4,195
- 35 to 39 minutes: 836
- 40 to 44 minutes: 789
- 45 to 59 minutes: 2,122
- 60 to 89 minutes: 1,910
- 90 or more minutes: 640
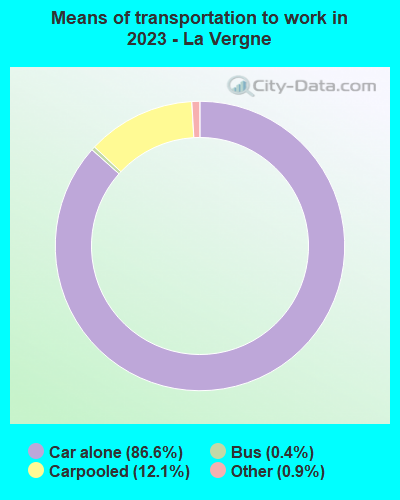
Means of transportation to work:
- Drove a car alone: 18,805 (73.8%)
- Carpooled: 2,830 (11.1%)
- Bus: 184 (0.7%)
- Taxi: 308 (1.2%)
- Walked: 128 (0.5%)
- Worked at home: 3,129 (12.3%)

- Unemployment by race in 2022
- Unemployment rate for White non-Hispanic residents
- 2.8%Males
- 2.1%Females
- Unemployment rate for Black residents
- 1.7%Males
- 3.3%Females
- Unemployment rate for Asian residents
- 2.8%Females
- Unemployment rate for other race residents
- 6.8%Males
- 2.2%Females
- Unemployment rate for two or more race residents
- 0.8%Males
- 1.1%Females
- Unemployment rate for Hispanic or Latino residents
- 2.8%Males
- 1.8%Females

- Year of entry for the foreign-born population in La Vergne, Tennessee
- 2,5042010 or later
- 1,8832000 to 2009
- 1,4841990 to 1999
- 2511980 to 1989
- 931970 to 1979
- 77Before 1970

First ancestries reported:
- American: 2,544 (11.1%)
- English: 1,160 (5.1%)
- Irish: 944 (4.1%)
- German: 802 (3.5%)
- Egyptian: 646 (2.8%)
- African: 439 (1.9%)
- Haitian: 350 (1.5%)
- Italian: 336 (1.5%)
- European: 222 (1.0%)
- Nigerian: 221 (1.0%)
- Arab: 215 (0.9%)
- Ethiopian: 202 (0.9%)
- Yugoslavian: 142 (0.6%)
- West Indian: 104 (0.5%)
- Dutch: 93 (0.4%)
- British: 89 (0.4%)
- Lebanese: 71 (0.3%)
- Scottish: 67 (0.3%)
- Polish: 61 (0.3%)
- French: 58 (0.3%)
- Scotch-Irish: 54 (0.2%)
- Turkish: 53 (0.2%)
- Norwegian: 46 (0.2%)
- Northern European: 43 (0.2%)
- Russian: 42 (0.2%)
- Danish: 32 (0.1%)
- Scandinavian: 27 (0.1%)
- French Canadian: 23 (0.1%)
- Jamaican: 21 (0.09%)
- Swedish: 20 (0.09%)
- Pennsylvania German: 20 (0.09%)
- Romanian: 19 (0.08%)
- Swiss: 17 (0.07%)
- Cajun: 13 (0.06%)
- Welsh: 13 (0.06%)
- Hungarian: 12 (0.05%)
- Czechoslovakian: 11 (0.05%)
- Cypriot: 10 (0.04%)
- Portuguese: 7 (0.03%)
- Belizean: 4 (0.02%)
Most common places of birth for foreign-born residents (%):
| La Vergne: | 25.6% (1,678) |
| Tennessee: | 23.0% (86,435) |
| La Vergne: | 13.7% (895) |
| Tennessee: | 3.1% (11,761) |
| La Vergne: | 10.3% (673) |
| Tennessee: | 2.7% (10,313) |
| La Vergne: | 7.2% (471) |
| Tennessee: | 4.6% (17,433) |
| La Vergne: | 5.0% (329) |
| Tennessee: | 1.1% (4,233) |
| La Vergne: | 4.9% (321) |
| Tennessee: | 1.6% (5,936) |
| La Vergne: | 4.0% (263) |
| Tennessee: | 5.7% (21,286) |
| La Vergne: | 3.8% (248) |
| Tennessee: | 1.4% (5,265) |
| La Vergne: | 3.7% (242) |
| Tennessee: | 1.2% (4,662) |
| La Vergne: | 3.2% (208) |
| Tennessee: | 0.7% (2,485) |
| La Vergne: | 2.6% (168) |
| Tennessee: | 0.4% (1,598) |
| La Vergne: | 2.4% (155) |
| Tennessee: | 1.0% (3,879) |
| La Vergne: | 2.1% (139) |
| Tennessee: | 1.3% (4,841) |
Place of birth for U.S.-born residents:
- This state: 18,636
- Other state: 13,191
- Northeast: 2,201
- Midwest: 4,393
- South: 4,555
- West: 2,178
87.6% of La Vergne residents lived in the same house 1 years ago.
Out of people who lived in different houses, 23.0% lived in this county.
Out of people who lived in different counties, 70.0% lived in Tennessee.
| La Vergne: | 87.6% |
| State average: | 87.0% |
Education attainment for males 25 years and older:
- No schooling: 400
- Nursery to 4th grade: 47
- 5th and 6th grade: 58
- 7th and 8th grade: 74
- 9th grade: 44
- 10th grade: 279
- 11th grade: 203
- 12th grade, no diploma: 526
- High school graduate (or equivalency): 5,032
- Less than 1 year of college: 878
- Some college more than 1 year, no degree: 1,801
- Associate degree: 850
- Bachelor's degree: 2,012
- Master's degree: 506
- Professional school degree: 100
- Doctorate degree: 30

Education attainment for females 25 years and older:
- No schooling: 235
- Nursery to 4th grade: 111
- 5th and 6th grade: 173
- 7th and 8th grade: 176
- 9th grade: 177
- 10th grade: 103
- 11th grade: 251
- 12th grade, no diploma: 231
- High school graduate (or equivalency): 3,321
- Less than 1 year of college: 976
- Some college more than 1 year, no degree: 1,790
- Associate degree: 1,510
- Bachelor's degree: 2,334
- Master's degree: 1,001
- Professional school degree: 28
- Doctorate degree: 41


Housing units in structures:
- One, detached: 11,593
- One, attached: 1,102
- Two: 84
- 3 or 4: 365
- 5 to 9: 329
- 10 to 19: 126
- 20 to 49: 29
- 50 or more: 65
- Mobile homes: 782
Median worth of mobile homes: $121,471
Housing units lacking complete kitchen facilities in 2022: 1.1%
House/condo owner moved in on average 9 years ago
Renter moved in on average 4 years ago

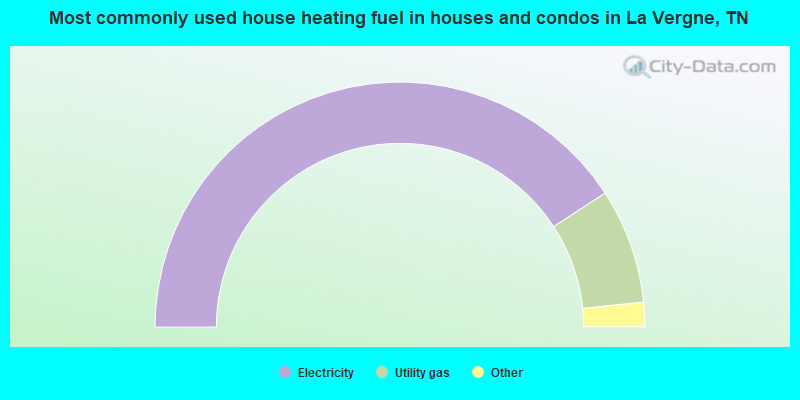
- 81.6%Electricity
- 15.2%Utility gas
- 1.5%Bottled, tank, or LP gas
- 1.4%No fuel used
- 0.3%Wood
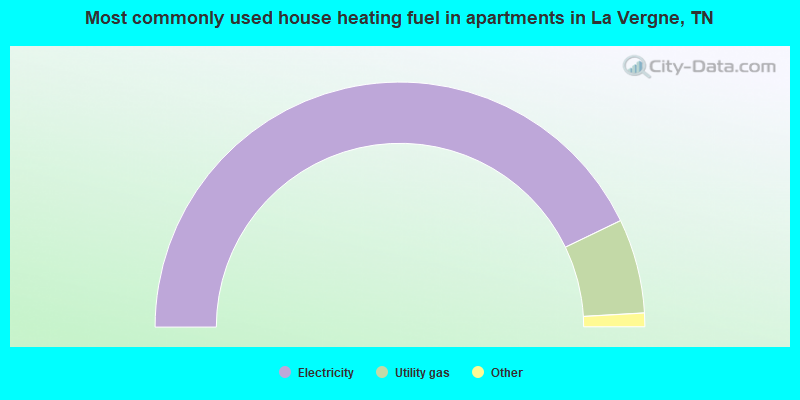
- 85.7%Electricity
- 12.5%Utility gas
- 0.9%No fuel used
- 0.7%Bottled, tank, or LP gas
- 0.2%Wood
Private vs. public school enrollment:
| Here: | 5.2% |
| Tennessee: | 15.0% |
| Here: | 4.2% |
| Tennessee: | 16.2% |
| Here: | 31.3% |
| Tennessee: | 23.5% |


