Lake Providence, LA (Louisiana) Houses and Residents
| Lake Providence: | $61,083 |
| Louisiana: | $209,200 |
Mean price in 2022:
Detached houses: $133,254
Here: $133,254 State: $273,555 Mobile homes: $37,851
Here: $37,851 State: $89,857
Total population: 3,821 (All urban)
Houses: 1,983 (1,409 occupied: 696 owner occupied, 731 renter occupied)
| % of renters here: | 51% |
| State: | 32% |
Housing density: 551 houses/condos per square mile
Median price asked for vacant for-sale houses and condos in 2022 in this county: $848,153.
Median contract rent in 2022: $406 (lower quartile is $235, upper quartile is $499)
Median rent asked for vacant for-rent units in 2022: $518
Median gross rent in Lake Providence, LA in 2022: $642
Housing units in Lake Providence with a mortgage: 159 (20 second mortgage, 0 home equity loan, 19 both second mortgage and home equity loan)
Houses without a mortgage: 0
Median household income for houses/condos with a mortgage: $64,966
Median household income for apartments without a mortgage: $46,263
Median monthly housing costs: $555
Compare current foreclosures near Lake Providence, LA:
| Photo | Address | Area | Beds / Baths | Price | Details |
|---|---|---|---|---|---|

|
#1
Legrand St
Lake Providence, LA 71254
|
- sq. feet
|
- baths - beds |
show details | |

|
#2
Mill St
Lake Providence, LA 71254
|
- sq. feet
|
- baths - beds |
show details | |

|
#3
Artuard St
Lake Providence, LA 71254
|
- sq. feet
|
- baths - beds |
show details | |

|
#4
Highway 877
Lake Providence, LA 71254
|
- sq. feet
|
- baths - beds |
show details | |

|
#5
Mike Ave
Lake Providence, LA 71254
|
- sq. feet
|
- baths - beds |
show details | |

|
#6
Ferrier St
Lake Providence, LA 71254
|
- sq. feet
|
- baths - beds |
show details | |

|
#7
Mill St
Lake Providence, LA 71254
|
- sq. feet
|
- baths - beds |
show details | |

|
#8
Martin Luther King Jr Dr
Lake Providence, LA 71254
|
- sq. feet
|
- baths - beds |
show details | |

|
#9
Davis St # 5f
Lake Providence, LA 71254
|
- sq. feet
|
- baths - beds |
show details | |

|
#10
Church St
Lake Providence, LA 71254
|
- sq. feet
|
- baths - beds |
show details |
| Photo | Address | Area | Beds / Baths | Price | Details |
|---|---|---|---|---|---|

|
#11
1st St
Lake Providence, LA 71254
|
- sq. feet
|
- baths - beds |
show details | |

|
#12
Morgel Dr
Lake Providence, LA 71254
|
- sq. feet
|
- baths - beds |
show details | |

|
#13
2nd St
Lake Providence, LA 71254
|
- sq. feet
|
- baths - beds |
show details | |

|
#14
Highway 65 S
Lake Providence, LA 71254
|
- sq. feet
|
- baths - beds |
show details | |

|
#15
3rd St
Lake Providence, LA 71254
|
- sq. feet
|
- baths - beds |
show details | |

|
#16
Schneider Ln
Lake Providence, LA 71254
|
- sq. feet
|
- baths - beds |
show details | |

|
#17
Madden Dr
Lake Providence, LA 71254
|
- sq. feet
|
- baths - beds |
show details | |

|
#18
Island Point Dr
Lake Providence, LA 71254
|
- sq. feet
|
- baths - beds |
show details | |

|
#19
Lemmie Hobbs Rd
Lake Providence, LA 71254
|
- sq. feet
|
- baths - beds |
show details | |

|
#20
Highway 580
Lake Providence, LA 71254
|
- sq. feet
|
- baths - beds |
show details |
| Photo | Address | Area | Beds / Baths | Price | Details |
|---|---|---|---|---|---|

|
#21
Brannum St
Lake Providence, LA 71254
|
- sq. feet
|
- baths - beds |
show details | |

|
#22
School Dr
Oak Grove, LA 71263
|
1,356 sq. feet
|
1 baths 3 beds |
show details | |

|
#23
N Horner St
Oak Grove, LA 71263
|
- sq. feet
|
- baths - beds |
show details | |

|
#24
Locust St
Pioneer, LA 71266
|
- sq. feet
|
- baths - beds |
show details | |

|
#25
Highway 879
Oak Grove, LA 71263
|
- sq. feet
|
- baths - beds |
show details | |

|
#26
Highway 586
Oak Grove, LA 71263
|
- sq. feet
|
- baths - beds |
show details | |

|
#27
Rosha Ln
Oak Grove, LA 71263
|
- sq. feet
|
- baths - beds |
show details | |

|
#28
Highway 1
Mayersville, MS 39113
|
- sq. feet
|
- baths - beds |
show details | |

|
#29
S Briggs St
Oak Grove, LA 71263
|
- sq. feet
|
- baths - beds |
show details | |

|
#30
E Main St
Oak Grove, LA 71263
|
- sq. feet
|
- baths - beds |
show details |
| Photo | Address | Area | Beds / Baths | Price | Details |
|---|---|---|---|---|---|

|
#31
Odis Wade Rd
Oak Grove, LA 71263
|
- sq. feet
|
- baths - beds |
show details | |

|
#32
Hospital Rd Apt 127
Oak Grove, LA 71263
|
- sq. feet
|
- baths - beds |
show details | |

|
#33
Highway 585
Oak Grove, LA 71263
|
- sq. feet
|
- baths - beds |
show details | |

|
#34
Homestead Rd
Transylvania, LA 71286
|
- sq. feet
|
- baths - beds |
show details | |

|
#35
Wood Rd
Pioneer, LA 71266
|
- sq. feet
|
- baths - beds |
show details | |

|
#36
Philley Ln
Oak Grove, LA 71263
|
- sq. feet
|
- baths - beds |
show details | |

|
#37
Highway 597
Oak Grove, LA 71263
|
- sq. feet
|
- baths - beds |
show details | |

|
#38
Chop Rd
Oak Grove, LA 71263
|
- sq. feet
|
- baths - beds |
show details | |

|
#39
Bran Rd
Oak Grove, LA 71263
|
- sq. feet
|
- baths - beds |
show details | |

|
#40
Hankins Ln
Oak Grove, LA 71263
|
- sq. feet
|
- baths - beds |
show details |
| Photo | Address | Area | Beds / Baths | Price | Details |
|---|---|---|---|---|---|

|
#41
Janesville Rd
Oak Grove, LA 71263
|
- sq. feet
|
- baths - beds |
show details | |

|
#42
Williamson Ln
Pioneer, LA 71266
|
- sq. feet
|
- baths - beds |
show details | |

|
#43
N Old Kilbourne Rd
Oak Grove, LA 71263
|
- sq. feet
|
- baths - beds |
show details | |

|
#44
Hopkins Rd
Oak Grove, LA 71263
|
- sq. feet
|
- baths - beds |
show details | |

|
#45
Highway 577
Pioneer, LA 71266
|
- sq. feet
|
- baths - beds |
show details | |

|
Check over 1 million property listings on Foreclosure.com!
|
browse all offers | |||


 | Lake Providence La the poorest city in America (8 replies) |
| Affluent cities in Louisiana (8 replies) |
| Lake Providence-poorest Place In America (11 replies) |
| Should Northern Louisiana become a seperate state? (24 replies) |
| Baton Rouge to Walker (21 replies) |

Median year apartment built: 1979
Household type by relationship:
Households: 3,503- Male householders: 462 (118 living alone), Female householders: 910 (245 living alone)
388 spouses (388 opposite-sex spouses), 15 unmarried partners, (15 opposite-sex unmarried partners), 1,473 children (1,434 natural, 0 adopted, 39 stepchildren), 194 grandchildren, 13 brothers or sisters, 5 parents, 0 foster children, 5 other relatives, 31 non-relatives
Size of family households: 284 2-persons, 370 3-persons, 245 4-persons, 38 5-persons, 5 6-persons.
Size of nonfamily households: 387 1-person, 90 2-persons.
165 married couples with children.
1,012 single-parent households (0 men, 1,012 women).
100.3% of residents of Lake Providence speak English at home.
| Here: | 6.5 |
| State: | 6.2 |
| Here: | 5.0 |
| State: | 4.4 |

- Bedrooms in owner-occupied houses and condos in Lake Providence, Louisiana
- 0no bedroom
- 01 bedroom
- 1142 bedrooms
- 4023 bedrooms
- 1564 bedrooms
- 245+ bedrooms

- Bedrooms in renter-occupied apartments in Lake Providence, Louisiana
- 19no bedroom
- 491 bedroom
- 1912 bedrooms
- 3993 bedrooms
- 434 bedrooms
- 305+ bedrooms

- Cars and other vehicles available in Lake Providence in owner-occupied houses/condos
- 41no vehicle
- 2301 vehicle
- 3452 vehicles
- 703 vehicles
- 114 vehicles
- 05+ vehicles

- Cars and other vehicles available in Lake Providence in renter-occupied apartments
- 239no vehicle
- 4071 vehicle
- 702 vehicles
- 163 vehicles
- 04 vehicles
- 05+ vehicles

- Rooms in owner-occupied houses in Lake Providence, Louisiana
- 01 room
- 02 rooms
- 83 rooms
- 944 rooms
- 695 rooms
- 1806 rooms
- 2127 rooms
- 338 rooms
- 1019+ rooms

- Rooms in renter-occupied apartments in Lake Providence, Louisiana
- 191 room
- 172 rooms
- 123 rooms
- 1154 rooms
- 3925 rooms
- 926 rooms
- 377 rooms
- 418 rooms
- 69+ rooms


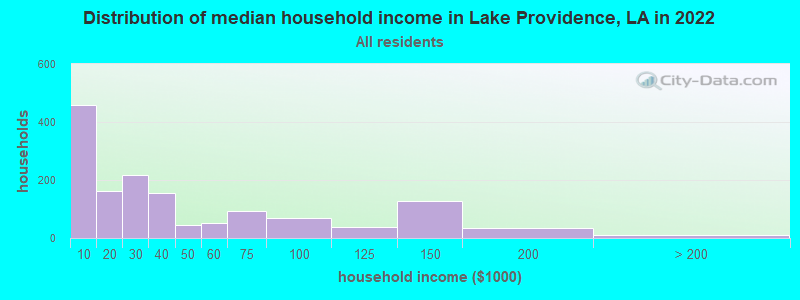
Lake Providence, LA household income distribution

- 457Less than $10,000
- 161$10,000 to $19,999
- 216$20,000 to $29,999
- 154$30,000 to $39,999
- 45$40,000 to $49,999
- 51$50,000 to $59,999
- 92$60,000 to $74,999
- 68$75,000 to $99,999
- 39$100,000 to $124,999
- 128$125,000 to $149,999
- 34$150,000 to $199,999
- 9$200,000 or more
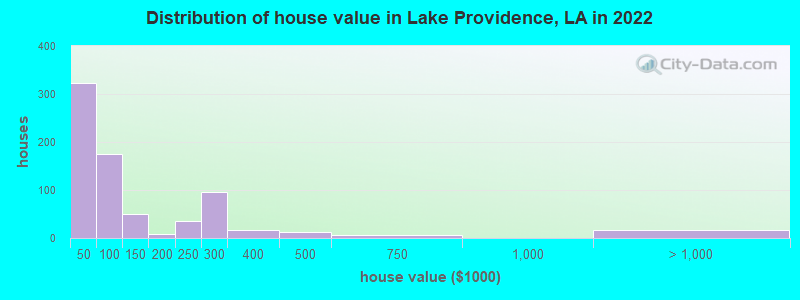
Home value of owner - occupied houses in 2022 in Lake Providence, LA
-
- 34Less than $10,000
- 32$15,000 to $19,999
- 31$20,000 to $24,999
- 16$25,000 to $29,999
- 162$30,000 to $34,999
- 32$35,000 to $39,999
- 12$40,000 to $49,999
- 34$50,000 to $59,999
- 110$60,000 to $69,999
- 12$70,000 to $79,999
- 0$80,000 to $89,999
- 5$90,000 to $99,999
- 41$100,000 to $124,999
- 9$125,000 to $149,999
- 9$150,000 to $174,999
- 35$200,000 to $249,999
- 96$250,000 to $299,999
- 16$300,000 to $399,999
- 11$400,000 to $499,999
- 6$500,000 to $749,999
- 16$1,000,000 to $1,499,999
Rent paid by renters in 2022 in Lake Providence, LA
-
- 62Less than $100
- 35$100 to $149
- 49$150 to $199
- 36$200 to $249
- 16$250 to $299
- 57$300 to $349
- 31$350 to $399
- 193$400 to $449
- 53$450 to $499
- 62$500 to $549
- 35$550 to $599
- 10$650 to $699
- 18$700 to $749
- 27$750 to $799
- 94No cash rent


Percentage of workers working in this county: 78.9%
Number of people working at home: 0 (0.0% of all workers)
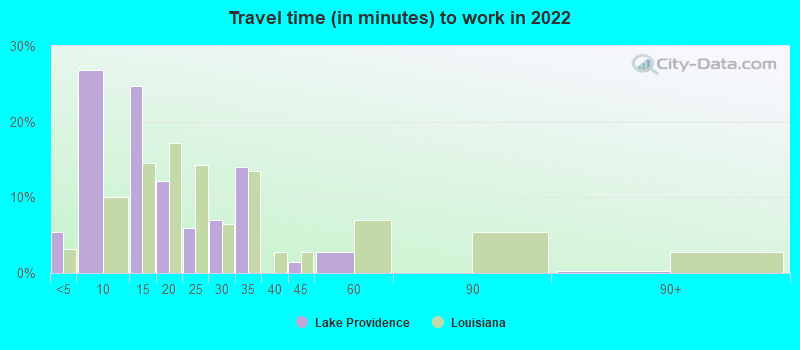
Travel time to work (commute)
- Less than 5 minutes: 84
- 5 to 9 minutes: 242
- 10 to 14 minutes: 279
- 15 to 19 minutes: 128
- 20 to 24 minutes: 29
- 25 to 29 minutes: 51
- 30 to 34 minutes: 61
- 35 to 39 minutes: 18
- 40 to 44 minutes: 13
- 45 to 59 minutes: 27
- 60 to 89 minutes: 0
- 90 or more minutes: 0
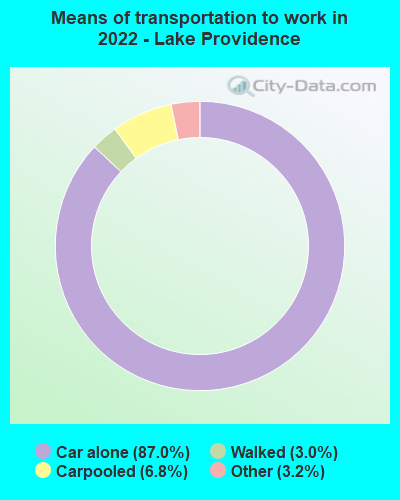
Means of transportation to work:
- Drove a car alone: 722 (85.1%)
- Carpooled: 56 (6.6%)
- Taxi: 29 (3.4%)
- Walked: 28 (3.3%)

- Unemployment by race in 2022
- Unemployment rate for Black residents
- 12.8%Males
- 14.3%Females

- Year of entry for the foreign-born population in Lake Providence, Louisiana
- 511995 to March 2000
- 01990 to 1994
- 01985 to 1989
- 01980 to 1984
- 81975 to 1979
- 01970 to 1974
- 01965 to 1969
- 4Before 1965

First ancestries reported:
- English: 179 (6.2%)
- American: 106 (3.6%)
- German: 43 (1.5%)
- Irish: 17 (0.6%)
- African: 12 (0.4%)
Most common places of birth for foreign-born residents (%):
| Lake Providence: | 93.7% (59) |
| Louisiana: | 0.7% (777) |
| Lake Providence: | 6.3% (4) |
| Louisiana: | 4.2% (4,815) |
Place of birth for U.S.-born residents:
- This state: 2,942
- Other state: 562
- Northeast: 1
- Midwest: 0
- South: 509
- West: 52
90.3% of Lake Providence residents lived in the same house 1 years ago.
Out of people who lived in different houses, 48.1% lived in this county.
Out of people who lived in different counties, 46.2% lived in Louisiana.
| Lake Providence: | 90.3% |
| State average: | 88.3% |
Education attainment for males 25 years and older:
- No schooling: 17
- Nursery to 4th grade: 0
- 5th and 6th grade: 31
- 7th and 8th grade: 0
- 9th grade: 0
- 10th grade: 16
- 11th grade: 31
- 12th grade, no diploma: 79
- High school graduate (or equivalency): 189
- Less than 1 year of college: 120
- Some college more than 1 year, no degree: 64
- Associate degree: 6
- Bachelor's degree: 211
- Master's degree: 22
- Professional school degree: 0
- Doctorate degree: 0

Education attainment for females 25 years and older:
- No schooling: 22
- Nursery to 4th grade: 0
- 5th and 6th grade: 14
- 7th and 8th grade: 31
- 9th grade: 29
- 10th grade: 61
- 11th grade: 90
- 12th grade, no diploma: 4
- High school graduate (or equivalency): 429
- Less than 1 year of college: 76
- Some college more than 1 year, no degree: 154
- Associate degree: 80
- Bachelor's degree: 99
- Master's degree: 9
- Professional school degree: 0
- Doctorate degree: 4


Housing units in structures:
- One, detached: 1,205
- One, attached: 16
- Two: 132
- 3 or 4: 167
- 5 to 9: 35
- 20 to 49: 3
- 50 or more: 8
- Mobile homes: 415
Median worth of mobile homes: $40,694
Housing units lacking complete kitchen facilities in 2022: 18.5%
House/condo owner moved in on average 29 years ago
Renter moved in on average 3 years ago

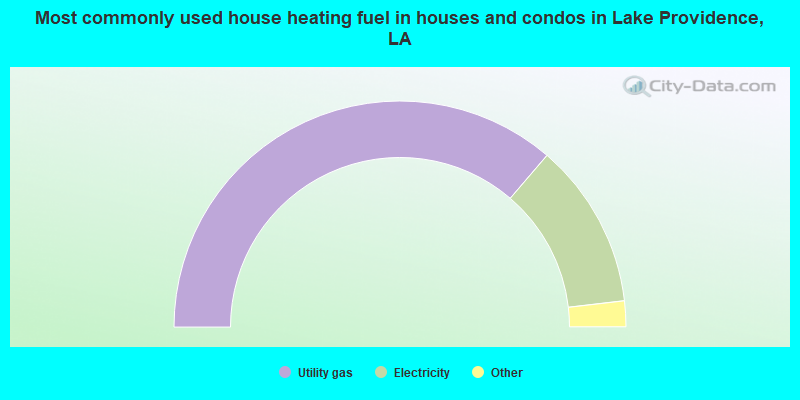
- 72.7%Utility gas
- 23.8%Electricity
- 2.2%Bottled, tank, or LP gas
- 1.3%No fuel used
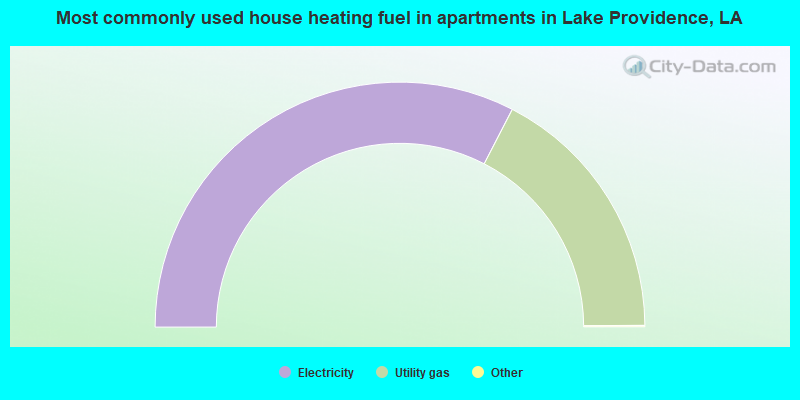
- 65.3%Electricity
- 34.7%Utility gas
Private vs. public school enrollment:
| Here: | 20.0% |
| Louisiana: | 19.6% |
| Here: | 0.0% |
| Louisiana: | 18.3% |
| Here: | 0.0% |
| Louisiana: | 17.4% |


