Leland, MS (Mississippi) Houses and Residents
| Leland: | $115,579 |
| Mississippi: | $162,500 |
Mean price in 2022:
Detached houses: $132,166
Here: $132,166 State: $226,494
Total population: 4,262 (All urban)
Houses: 2,015 (1,725 occupied: 1,209 owner occupied, 534 renter occupied)
| % of renters here: | 31% |
| State: | 30% |
Housing density: 978 houses/condos per square mile
Median price asked for vacant for-sale houses and condos in 2022 in this county: $70,802.
Median contract rent in 2022: $445 (lower quartile is $309, upper quartile is $621)
Median rent asked for vacant for-rent units in 2022: $573
Median gross rent in Leland, MS in 2022: $663
Housing units in Leland with a mortgage: 494 (15 second mortgage, 0 home equity loan, 8 both second mortgage and home equity loan)
Houses without a mortgage: 0
Median household income for houses/condos with a mortgage: $64,273
Median household income for apartments without a mortgage: $55,405
Median monthly housing costs: $642
Compare current foreclosures near Leland, MS:
| Photo | Address | Area | Beds / Baths | Price | Details |
|---|---|---|---|---|---|

|
#1
California Ave
Leland, MS 38756
|
1,743 sq. feet
|
- baths - beds |
show details | |

|
#2
Tucker St
Leland, MS 38756
|
1,897 sq. feet
|
- baths - beds |
show details | |

|
#3
California Ave
Leland, MS 38756
|
1,062 sq. feet
|
- baths - beds |
show details | |

|
#4
Mimosa Dr
Leland, MS 38756
|
1,396 sq. feet
|
- baths - beds |
show details | |

|
#5
Saint Christopher Rd
Leland, MS 38756
|
1,530 sq. feet
|
- baths - beds |
show details | |

|
#6
James Trimm Dr
Leland, MS 38756
|
840 sq. feet
|
- baths - beds |
show details | |

|
#7
5th St
Leland, MS 38756
|
1,112 sq. feet
|
- baths - beds |
show details | |

|
#8
Fitzhugh St
Leland, MS 38756
|
- sq. feet
|
- baths - beds |
show details | |

|
#9
Feltus Blvd
Leland, MS 38756
|
1,987 sq. feet
|
- baths - beds |
show details | |

|
#10
W 2nd St
Leland, MS 38756
|
1,754 sq. feet
|
- baths - beds |
show details |
| Photo | Address | Area | Beds / Baths | Price | Details |
|---|---|---|---|---|---|

|
#11
Sycamore St
Leland, MS 38756
|
2,327 sq. feet
|
- baths - beds |
show details | |

|
#12
Mark St # A
Leland, MS 38756
|
- sq. feet
|
- baths - beds |
show details | |

|
#13
E 3rd St
Leland, MS 38756
|
- sq. feet
|
- baths - beds |
show details | |

|
#14
Lilac Dr
Leland, MS 38756
|
1,733 sq. feet
|
- baths - beds |
show details | |

|
#15
Dean St
Leland, MS 38756
|
1,404 sq. feet
|
- baths - beds |
show details | |

|
#16
Highway 82 E, Lot 12
Leland, MS 38756
|
- sq. feet
|
- baths - beds |
show details | |

|
#17
Tucker St
Leland, MS 38756
|
825 sq. feet
|
- baths - beds |
show details | |

|
#18
James Trimm Dr
Leland, MS 38756
|
1,200 sq. feet
|
- baths - beds |
show details | |

|
#19
5th St
Leland, MS 38756
|
1,050 sq. feet
|
- baths - beds |
show details | |

|
#20
Mimosa Dr
Leland, MS 38756
|
1,247 sq. feet
|
- baths - beds |
show details |
| Photo | Address | Area | Beds / Baths | Price | Details |
|---|---|---|---|---|---|

|
#21
S Deer Creek Dr W
Leland, MS 38756
|
- sq. feet
|
- baths - beds |
show details | |

|
#22
Porter Dr
Indianola, MS 38751
|
- sq. feet
|
1 baths 4 beds |
show details | |

|
#23
Jackson St
Indianola, MS 38751
|
2,342 sq. feet
|
2 baths 3 beds |
show details | |

|
#24
N Theobald St
Greenville, MS 38701
|
13,250 sq. feet
|
- baths - beds |
$35,000
|
show details |

|
#25
John St
Greenville, MS 38703
|
1,494 sq. feet
|
- baths - beds |
$17,900
|
show details |

|
#26
E Lynne Cir
Greenville, MS 38703
|
1,649 sq. feet
|
- baths - beds |
$24,900
|
show details |

|
#27
Bonda Dr
Greenville, MS 38701
|
2,060 sq. feet
|
2 baths - beds |
show details | |

|
#28
Dogwood Cv
Greenville, MS 38701
|
1,113 sq. feet
|
2 baths - beds |
show details | |

|
#29
Birdsong St
Indianola, MS 38751
|
1,443 sq. feet
|
- baths 5 beds |
show details | |

|
#30
S Southwest Plaza Cir
Indianola, MS 38751
|
1,044 sq. feet
|
- baths 3 beds |
show details |
| Photo | Address | Area | Beds / Baths | Price | Details |
|---|---|---|---|---|---|

|
#31
Beaverdam Rd
Indianola, MS 38751
|
1,086 sq. feet
|
- baths 3 beds |
show details | |

|
#32
Alexander Ave
Indianola, MS 38751
|
1,344 sq. feet
|
- baths 2 beds |
show details | |

|
#33
Curtis St
Indianola, MS 38751
|
1,038 sq. feet
|
- baths 3 beds |
show details | |

|
#34
Wiggins Rd
Indianola, MS 38751
|
1,098 sq. feet
|
- baths 3 beds |
show details | |

|
#35
Beaverdam Rd
Indianola, MS 38751
|
1,113 sq. feet
|
- baths 3 beds |
show details | |

|
#36
Sam Lacey Dr
Indianola, MS 38751
|
1,323 sq. feet
|
- baths 3 beds |
show details | |

|
#37
W Augusta St
Indianola, MS 38751
|
2,783 sq. feet
|
- baths 3 beds |
show details | |

|
#38
Oak St
Indianola, MS 38751
|
900 sq. feet
|
- baths 3 beds |
show details | |

|
#39
Henry Rosser Dr
Indianola, MS 38751
|
1,075 sq. feet
|
- baths 3 beds |
show details | |

|
#40
N Elmwood Cir
Indianola, MS 38751
|
972 sq. feet
|
- baths 2 beds |
show details |
| Photo | Address | Area | Beds / Baths | Price | Details |
|---|---|---|---|---|---|

|
#41
Linbar St
Indianola, MS 38751
|
1,043 sq. feet
|
- baths 3 beds |
show details | |

|
#42
Bellevue Dr
Indianola, MS 38751
|
1,181 sq. feet
|
- baths 3 beds |
show details | |

|
#43
Bellevue Dr
Indianola, MS 38751
|
1,213 sq. feet
|
- baths 4 beds |
show details | |

|
#44
Sledge St
Indianola, MS 38751
|
1,144 sq. feet
|
- baths 2 beds |
show details | |

|
#45
Jefferson St
Indianola, MS 38751
|
1,392 sq. feet
|
- baths 3 beds |
show details | |

|
#46
Jefferson St
Indianola, MS 38751
|
926 sq. feet
|
- baths 2 beds |
show details | |

|
#47
Delta Blues St
Indianola, MS 38751
|
1,257 sq. feet
|
- baths 3 beds |
show details | |

|
#48
W Peeler Ave
Shaw, MS 38773
|
- sq. feet
|
- baths - beds |
show details | |

|
#49
Cypress Ln Apt 2204
Greenville, MS 38701
|
- sq. feet
|
- baths - beds |
show details | |

|
Check over 1 million property listings on Foreclosure.com!
|
browse all offers | |||

Latest news about housing in Leland, MS collected exclusively by city-data.com from local newspapers, TV, and radio stations

 | June travel in Mississippi? (55 replies) |
| Visiting the Delta, Bucket List trip (9 replies) |
| America's best coastal towns are in Mississippi (8 replies) |
| Delta Region - Must See Places? (9 replies) |
| Worst place to live (8 replies) |
| Communities Map ? (25 replies) |

Median year apartment built: 1969
Household type by relationship:
Households: 3,913- Male householders: 613 (134 living alone), Female householders: 1,079 (500 living alone)
578 spouses (578 opposite-sex spouses), 116 unmarried partners, (116 opposite-sex unmarried partners), 1,224 children (1,133 natural, 0 adopted, 90 stepchildren), 72 grandchildren, 23 brothers or sisters, 24 parents, 0 foster children, 75 other relatives, 106 non-relatives
Size of family households: 556 2-persons, 242 3-persons, 170 4-persons, 67 5-persons.
Size of nonfamily households: 665 1-person, 34 2-persons, 10 3-persons.
299 married couples with children.
495 single-parent households (177 men, 318 women).
95.7% of residents of Leland speak English at home.
4.0% of residents speak Spanish at home (50% speak English very well, 10% speak English well, 40% speak English not well).
0.3% of residents speak Asian or Pacific Island language at home (60% speak English very well, 40% speak English well).
Foreign born population: 44 (1.1%)
(25.0% of them are naturalized citizens)
| Here: | 6.3 |
| State: | 6.3 |
| Here: | 4.8 |
| State: | 4.8 |

- Bedrooms in owner-occupied houses and condos in Leland, Mississippi
- 0no bedroom
- 81 bedroom
- 892 bedrooms
- 8613 bedrooms
- 2134 bedrooms
- 385+ bedrooms

- Bedrooms in renter-occupied apartments in Leland, Mississippi
- 0no bedroom
- 631 bedroom
- 3012 bedrooms
- 1473 bedrooms
- 234 bedrooms
- 05+ bedrooms

- Cars and other vehicles available in Leland in owner-occupied houses/condos
- 22no vehicle
- 4121 vehicle
- 4632 vehicles
- 2293 vehicles
- 544 vehicles
- 305+ vehicles

- Cars and other vehicles available in Leland in renter-occupied apartments
- 115no vehicle
- 2891 vehicle
- 852 vehicles
- 463 vehicles
- 04 vehicles
- 05+ vehicles

- Rooms in owner-occupied houses in Leland, Mississippi
- 01 room
- 02 rooms
- 03 rooms
- 204 rooms
- 2475 rooms
- 4316 rooms
- 2507 rooms
- 298 rooms
- 2329+ rooms

- Rooms in renter-occupied apartments in Leland, Mississippi
- 01 room
- 82 rooms
- 803 rooms
- 1384 rooms
- 1795 rooms
- 856 rooms
- 167 rooms
- 138 rooms
- 149+ rooms


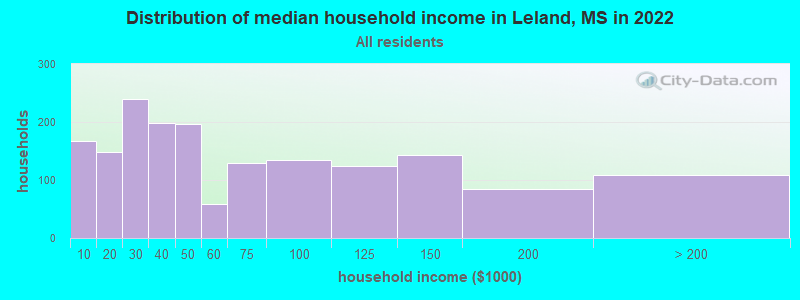
Leland, MS household income distribution

- 168Less than $10,000
- 148$10,000 to $19,999
- 239$20,000 to $29,999
- 198$30,000 to $39,999
- 197$40,000 to $49,999
- 59$50,000 to $59,999
- 130$60,000 to $74,999
- 135$75,000 to $99,999
- 125$100,000 to $124,999
- 143$125,000 to $149,999
- 85$150,000 to $199,999
- 108$200,000 or more
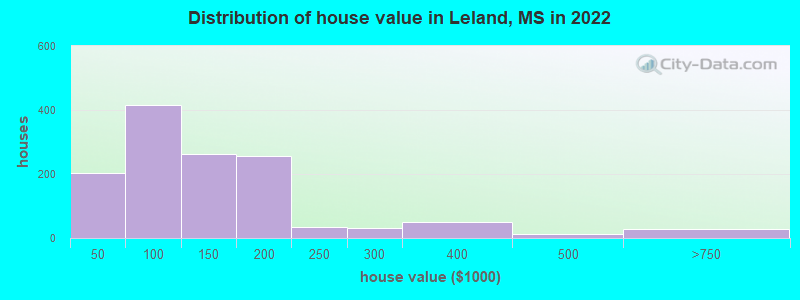
Home value of owner - occupied houses in 2022 in Leland, MS
-
- 18Less than $10,000
- 13$10,000 to $14,999
- 19$15,000 to $19,999
- 4$25,000 to $29,999
- 40$30,000 to $34,999
- 13$35,000 to $39,999
- 92$40,000 to $49,999
- 119$50,000 to $59,999
- 55$60,000 to $69,999
- 37$70,000 to $79,999
- 87$80,000 to $89,999
- 25$90,000 to $99,999
- 189$100,000 to $124,999
- 72$125,000 to $149,999
- 236$150,000 to $174,999
- 19$175,000 to $199,999
- 32$200,000 to $249,999
- 31$250,000 to $299,999
- 49$300,000 to $399,999
- 10$400,000 to $499,999
- 28$500,000 to $749,999
Rent paid by renters in 2022 in Leland, MS
-
- 43Less than $100
- 8$100 to $149
- 11$200 to $249
- 18$250 to $299
- 115$300 to $349
- 17$350 to $399
- 46$400 to $449
- 40$450 to $499
- 50$500 to $549
- 22$550 to $599
- 43$600 to $649
- 47$650 to $699
- 6$700 to $749
- 31$800 to $899
- 11$1,000 to $1,249
- 17No cash rent


Percentage of workers working in this county: 77.2%
Number of people working at home: 69 (3.8% of all workers)
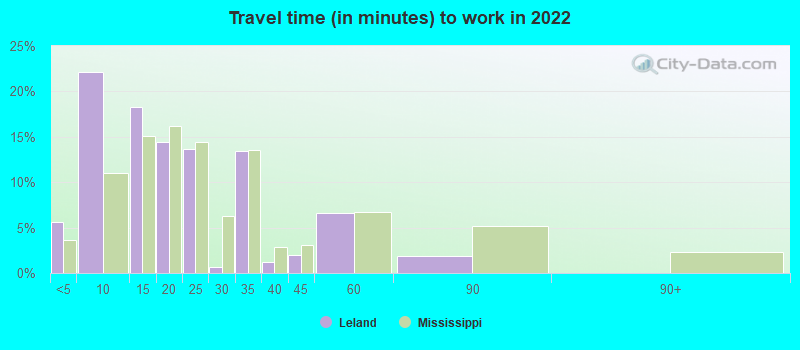
Travel time to work (commute)
- Less than 5 minutes: 58
- 5 to 9 minutes: 297
- 10 to 14 minutes: 160
- 15 to 19 minutes: 229
- 20 to 24 minutes: 537
- 25 to 29 minutes: 106
- 30 to 34 minutes: 178
- 35 to 39 minutes: 60
- 40 to 44 minutes: 11
- 45 to 59 minutes: 62
- 60 to 89 minutes: 42
- 90 or more minutes: 0
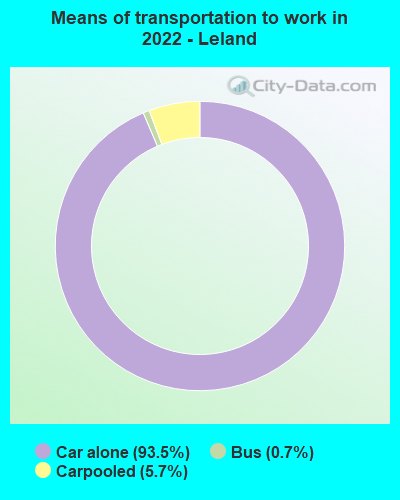
Means of transportation to work:
- Drove a car alone: 1,165 (87.6%)
- Carpooled: 79 (5.9%)
- Bus: 10 (0.8%)
- Worked at home: 69 (5.2%)

- Unemployment by race in 2022
- Unemployment rate for White non-Hispanic residents
- 4.2%Males
- 1.5%Females
- Unemployment rate for Black residents
- 0.8%Males
- 10.0%Females
- Unemployment rate for two or more race residents
- 70.8%Females
- Unemployment rate for Hispanic or Latino residents
- 34.0%Females

- Year of entry for the foreign-born population in Leland, Mississippi
- 02010 or later
- 282000 to 2009
- 131990 to 1999
- 01980 to 1989
- 81970 to 1979
- 10Before 1970

First ancestries reported:
- English: 203 (6.9%)
- American: 156 (5.3%)
- Irish: 79 (2.7%)
- German: 30 (1.0%)
- Scotch-Irish: 13 (0.4%)
- Dutch: 12 (0.4%)
- Italian: 11 (0.4%)
- Lebanese: 7 (0.2%)
- European: 5 (0.2%)
- African: 5 (0.2%)
- Polish: 4 (0.1%)
- British: 3 (0.1%)
Most common places of birth for foreign-born residents (%):
| Leland: | 50.0% (23) |
| Mississippi: | 0.4% (240) |
| Leland: | 28.3% (13) |
| Mississippi: | 4.3% (2,948) |
| Leland: | 15.2% (7) |
| Mississippi: | 0.8% (556) |
Place of birth for U.S.-born residents:
- This state: 3,500
- Other state: 342
- Northeast: 6
- Midwest: 70
- South: 243
- West: 19
88.0% of Leland residents lived in the same house 1 years ago.
Out of people who lived in different houses, 36.2% lived in this county.
Out of people who lived in different counties, 43.5% lived in Mississippi.
| Leland: | 88.0% |
| State average: | 88.9% |
Education attainment for males 25 years and older:
- No schooling: 18
- Nursery to 4th grade: 5
- 5th and 6th grade: 4
- 7th and 8th grade: 19
- 9th grade: 12
- 10th grade: 62
- 11th grade: 35
- 12th grade, no diploma: 0
- High school graduate (or equivalency): 383
- Less than 1 year of college: 75
- Some college more than 1 year, no degree: 217
- Associate degree: 75
- Bachelor's degree: 189
- Master's degree: 74
- Professional school degree: 0
- Doctorate degree: 47

Education attainment for females 25 years and older:
- No schooling: 0
- Nursery to 4th grade: 0
- 5th and 6th grade: 0
- 7th and 8th grade: 65
- 9th grade: 37
- 10th grade: 24
- 11th grade: 25
- 12th grade, no diploma: 7
- High school graduate (or equivalency): 373
- Less than 1 year of college: 113
- Some college more than 1 year, no degree: 192
- Associate degree: 193
- Bachelor's degree: 369
- Master's degree: 145
- Professional school degree: 24
- Doctorate degree: 0


Housing units in structures:
- One, detached: 1,755
- One, attached: 13
- Two: 47
- 3 or 4: 34
- 5 to 9: 46
- 10 to 19: 20
- 20 to 49: 98
Housing units lacking complete kitchen facilities in 2022: 8.6%
House/condo owner moved in on average 14 years ago
Renter moved in on average 7 years ago

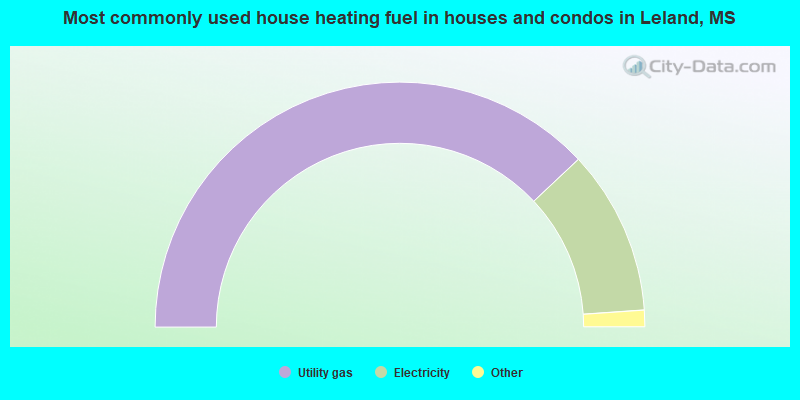
- 76.0%Utility gas
- 21.8%Electricity
- 1.4%Bottled, tank, or LP gas
- 0.8%No fuel used
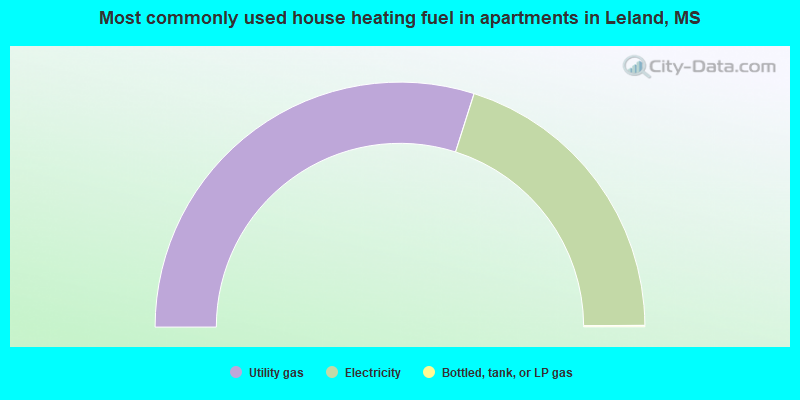
- 59.8%Utility gas
- 40.0%Electricity
- 0.2%Bottled, tank, or LP gas
Private vs. public school enrollment:
| Here: | 17.0% |
| Mississippi: | 16.1% |
| Here: | 28.0% |
| Mississippi: | 14.6% |
| Here: | 14.3% |
| Mississippi: | 12.8% |


