Housing density: 833 houses/condos per square mile
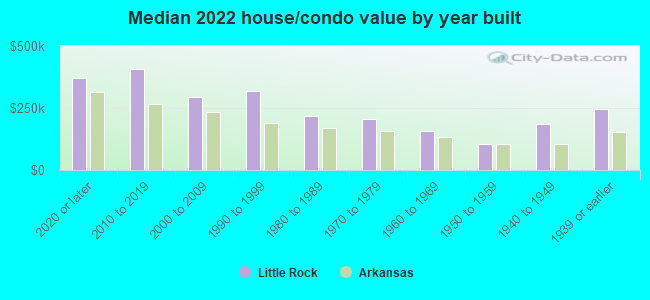
Median price asked for vacant for-sale houses and condos in 2022: $317,312.
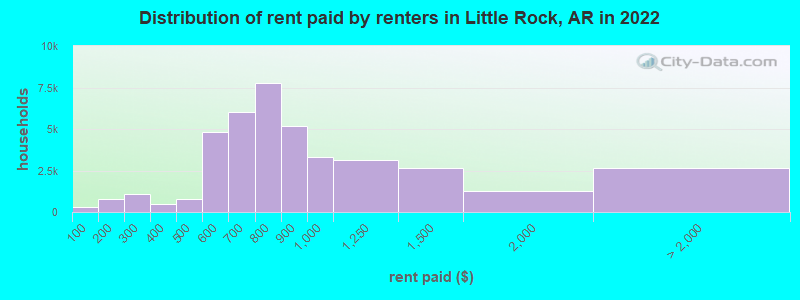
Median contract rent in 2022: $759 (lower quartile is $626, upper quartile is $958)
Median rent asked for vacant for-rent units in 2022: $759
Median gross rent in Little Rock, AR in 2022: $940
Housing units in Little Rock with a mortgage: 30,017 (2,140 second mortgage, 0 home equity loan, 1,525 both second mortgage and home equity loan) Houses without a mortgage: 679
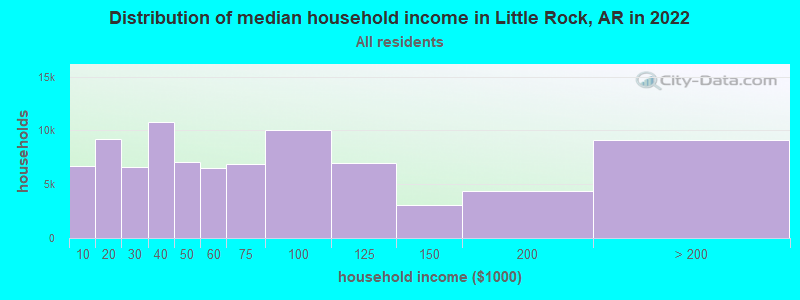
Median household income for houses/condos with a mortgage: $92,445
Median household income for apartments without a mortgage: $67,389
26,398 married couples with children.
12,223 single-parent households (1,735 men, 10,488 women).
88.9% of residents of Little Rock speak English at home.
6.9% of residents speak Spanish at home (62% speak English very well, 13% speak English well, 18% speak English not well, 6% don't speak English at all).
2.2% of residents speak other Indo-European language at home (88% speak English very well, 7% speak English well, 6% speak English not well).
1.6% of residents speak Asian or Pacific Island language at home (63% speak English very well, 22% speak English well, 12% speak English not well, 3% don't speak English at all).
0.6% of residents speak other language at home (92% speak English very well, 5% speak English well, 2% speak English not well).
Foreign born population: 10,377 (5.1%)
(39.8% of them are naturalized citizens)
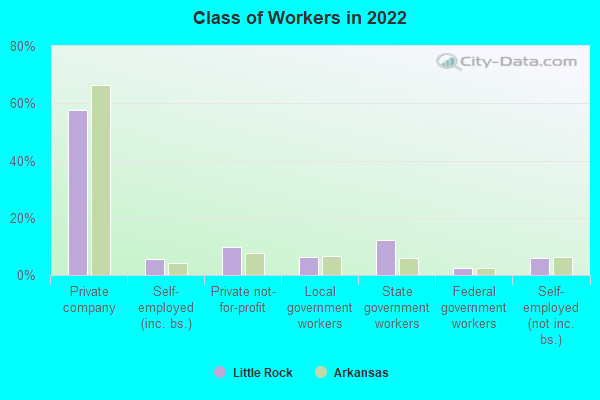
Percentage of workers working in this county: 92.6% Number of people working at home: 11,762 (12.1% of all workers)
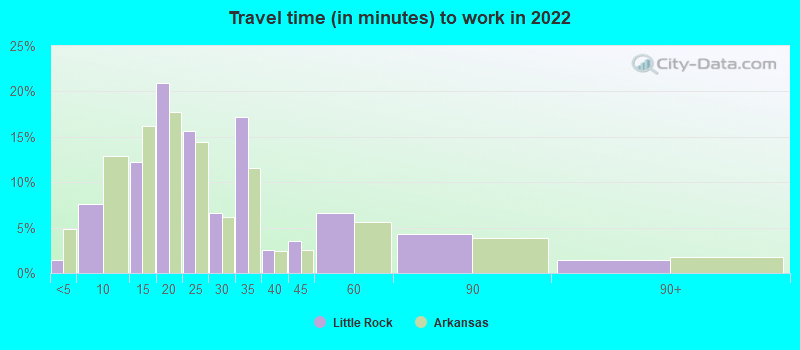
Travel time to work (commute)
Less than 5 minutes: 1,592
5 to 9 minutes: 9,956
10 to 14 minutes: 14,843
15 to 19 minutes: 25,786
20 to 24 minutes: 13,780
25 to 29 minutes: 5,890
30 to 34 minutes: 7,951
35 to 39 minutes: 418
40 to 44 minutes: 574
45 to 59 minutes: 2,093
60 to 89 minutes: 1,523
90 or more minutes: 1,069
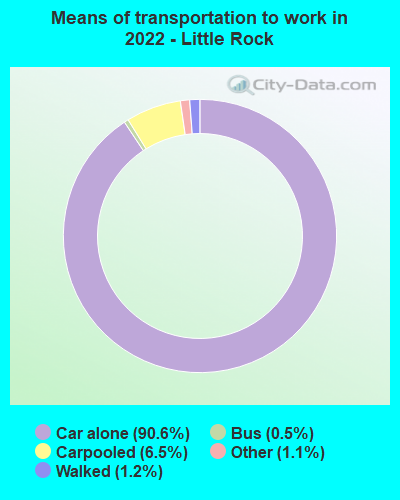
Means of transportation to work:
Drove a car alone: 138,917 (84.1%)
Carpooled: 10,016 (6.1%)
Bus: 792 (0.5%)
Taxi: 1,697 (1.0%)
Bicycle: 142 (0.1%)
Walked: 1,824 (1.1%)
Worked at home: 11,762 (7.1%)
Unemployment by race in 2022
Unemployment rate for White non-Hispanic residents
1.8%Males
1.2%Females
Unemployment rate for Black residents
3.0%Males
2.1%Females
Unemployment rate for Asian residents
4.5%Males
Unemployment rate for other race residents
6.2%Males
2.3%Females
Unemployment rate for two or more race residents
5.0%Males
3.3%Females
Unemployment rate for Hispanic or Latino residents
4.4%Males
4.7%Females
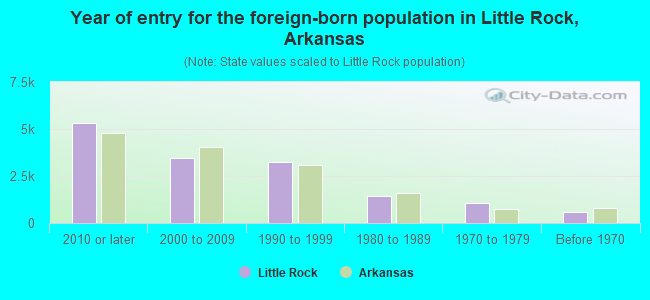
Year of entry for the foreign-born population in Little Rock, Arkansas
5,3102010 or later
3,4442000 to 2009
3,2191990 to 1999
1,4471980 to 1989
1,0661970 to 1979
581Before 1970
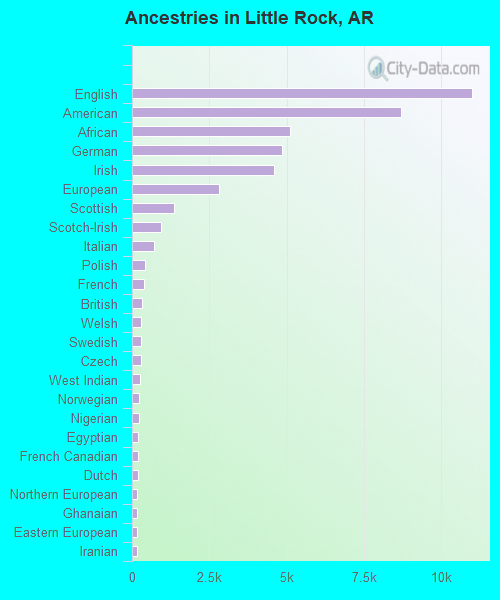
First ancestries reported:
English: 10,994 (9.2%)
American: 8,694 (7.3%)
African: 5,112 (4.3%)
German: 4,836 (4.0%)
Irish: 4,589 (3.8%)
European: 2,822 (2.4%)
Scottish: 1,367 (1.1%)
Scotch-Irish: 934 (0.8%)
Italian: 727 (0.6%)
Polish: 426 (0.4%)
French: 382 (0.3%)
British: 316 (0.3%)
Welsh: 307 (0.3%)
Swedish: 281 (0.2%)
Czech: 275 (0.2%)
West Indian: 258 (0.2%)
Norwegian: 237 (0.2%)
Nigerian: 212 (0.2%)
Egyptian: 209 (0.2%)
French Canadian: 205 (0.2%)
Dutch: 188 (0.2%)
Northern European: 172 (0.1%)
Ghanaian: 170 (0.1%)
Eastern European: 168 (0.1%)
Iranian: 166 (0.1%)
Syrian: 144 (0.1%)
Scandinavian: 132 (0.1%)
South African: 124 (0.1%)
Danish: 86 (0.07%)
Ukrainian: 81 (0.07%)
Swiss: 66 (0.06%)
Lithuanian: 60 (0.05%)
Moroccan: 53 (0.04%)
Israeli: 51 (0.04%)
Russian: 49 (0.04%)
Romanian: 44 (0.04%)
Greek: 40 (0.03%)
Guyanese: 39 (0.03%)
Canadian: 37 (0.03%)
Kenyan: 37 (0.03%)
Trinidadian and Tobagonian: 36 (0.03%)
Turkish: 34 (0.03%)
Belgian: 33 (0.03%)
Macedonian: 25 (0.02%)
Bahamian: 22 (0.02%)
Jordanian: 22 (0.02%)
Lebanese: 20 (0.02%)
Portuguese: 17 (0.01%)
Croatian: 17 (0.01%)
Arab: 16 (0.01%)
Latvian: 15 (0.01%)
Finnish: 15 (0.01%)
U.S. Virgin Islander: 14 (0.01%)
Estonian: 13 (0.01%)
Jamaican: 11 (0.01%)
Pennsylvania German: 9 (0.01%)
Assyrian: 9 (0.01%)
Most common places of birth for foreign-born residents (%):
Mexico
Little Rock:
26.2% (3,585)
Arkansas:
40.2% (61,075)
India
Little Rock:
14.9% (2,044)
Arkansas:
6.1% (9,278)
Pakistan
Little Rock:
5.2% (717)
Arkansas:
0.8% (1,236)
Guatemala
Little Rock:
5.1% (705)
Arkansas:
3.5% (5,376)
El Salvador
Little Rock:
5.0% (679)
Arkansas:
10.7% (16,210)
China, excluding Hong Kong and Taiwan
Little Rock:
4.6% (625)
Arkansas:
2.3% (3,503)
Philippines
Little Rock:
3.3% (450)
Arkansas:
2.7% (4,128)
Vietnam
Little Rock:
2.3% (320)
Arkansas:
2.7% (4,028)
Venezuela
Little Rock:
2.2% (306)
Arkansas:
0.5% (755)
Honduras
Little Rock:
1.9% (258)
Arkansas:
1.1% (1,606)
Korea
Little Rock:
1.9% (255)
Arkansas:
1.2% (1,813)
Nigeria
Little Rock:
1.6% (220)
Arkansas:
0.4% (627)
Indonesia
Little Rock:
1.6% (217)
Arkansas:
0.3% (486)
Place of birth for U.S.-born residents:
This state: 130,027
Other state: 60,367
Northeast: 5,916
Midwest: 15,909
South: 29,159
West: 9,383
85.1% of Little Rock residents lived in the same house 1 years ago. Out of people who lived in different houses, 37.2% lived in this county. Out of people who lived in different counties, 38.6% lived in Arkansas.
Little Rock:
85.1%
State average:
87.0%
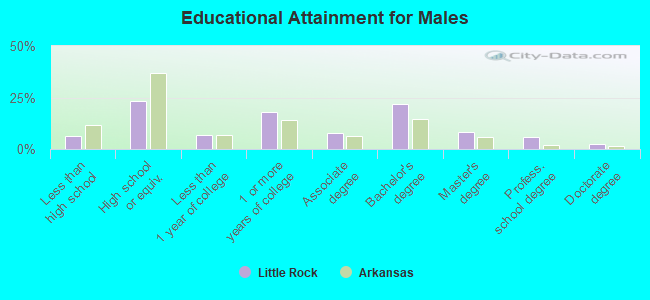
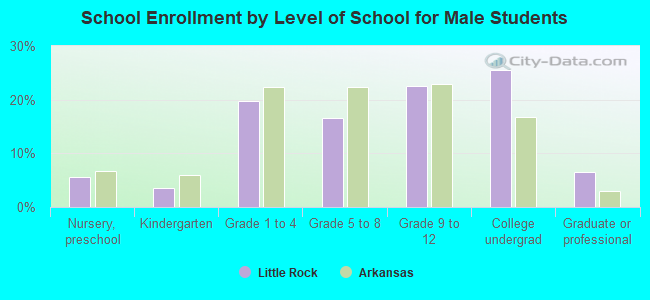
Education attainment for males 25 years and older:
No schooling: 580
Nursery to 4th grade: 540
5th and 6th grade: 121
7th and 8th grade: 135
9th grade: 677
10th grade: 523
11th grade: 261
12th grade, no diploma: 1,033
High school graduate (or equivalency): 14,482
Less than 1 year of college: 4,265
Some college more than 1 year, no degree: 11,109
Associate degree: 4,722
Bachelor's degree: 13,437
Master's degree: 5,068
Professional school degree: 3,759
Doctorate degree: 1,367
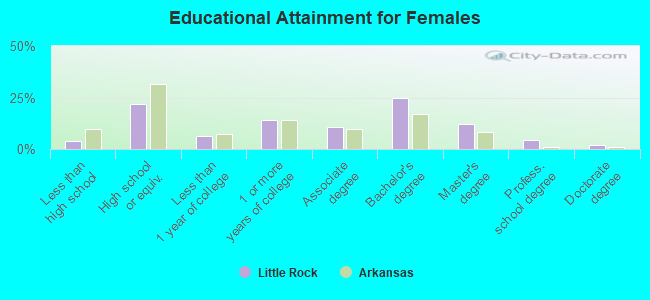
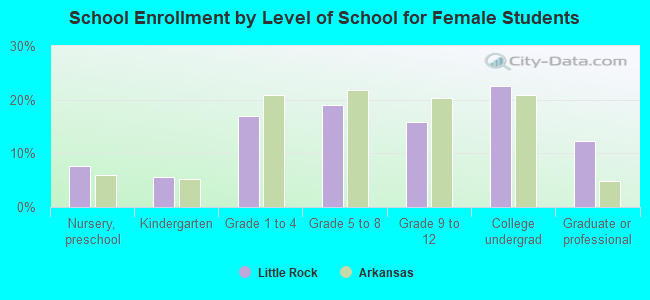
Education attainment for females 25 years and older:
No schooling: 580
Nursery to 4th grade: 264
5th and 6th grade: 400
7th and 8th grade: 83
9th grade: 362
10th grade: 159
11th grade: 313
12th grade, no diploma: 829
High school graduate (or equivalency): 16,231
Less than 1 year of college: 4,519
Some college more than 1 year, no degree: 10,502
Associate degree: 7,877
Bachelor's degree: 18,596
Master's degree: 9,061
Professional school degree: 3,169
Doctorate degree: 1,489
Housing units in structures:
One, detached: 58,018
One, attached: 972
Two: 2,825
3 or 4: 3,287
5 to 9: 8,244
10 to 19: 10,125
20 to 49: 5,226
50 or more: 6,985
Mobile homes: 1,165
Median worth of mobile homes: $59,400
Housing units lacking complete plumbing facilities in 2022: 1.2%
Housing units lacking complete kitchen facilities in 2022: 1.9%
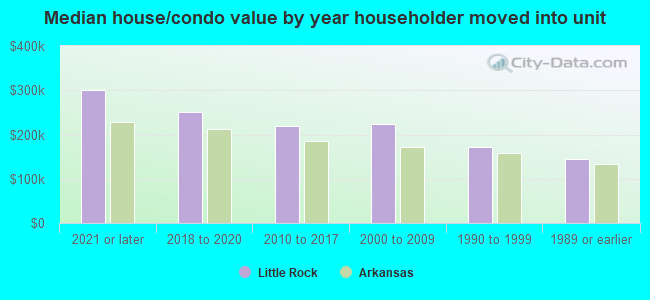
House/condo owner moved in on average 13 years ago