Luzerne, PA (Pennsylvania) Houses and Residents
| Luzerne: | $115,292 |
| Pennsylvania: | $245,500 |
Mean price in 2022:
Detached houses: $112,960
Here: $112,960 State: $317,202 Townhouses or other attached units: $103,393
Here: $103,393 State: $254,369
Total population: 2,839 (All urban)
Houses: 1,675 (1,407 occupied: 843 owner occupied, 583 renter occupied)
| % of renters here: | 41% |
| State: | 31% |
Housing density: 2,439 houses/condos per square mile
Median price asked for vacant for-sale houses and condos in 2022 in this county: $138,564.
Median contract rent in 2022: $637 (lower quartile is $495, upper quartile is $699)
Median rent asked for vacant for-rent units in 2022: $1,154
Median gross rent in Luzerne, PA in 2022: $752
Housing units in Luzerne with a mortgage: 478 (105 second mortgage, 0 home equity loan, 93 both second mortgage and home equity loan)
Houses without a mortgage: 28
Median household income for houses/condos with a mortgage: $48,481
Median household income for apartments without a mortgage: $46,321
Median monthly housing costs: $709
Compare current foreclosures near Luzerne, PA:
| Photo | Address | Area | Beds / Baths | Price | Details |
|---|---|---|---|---|---|

|
#1
Dymond Hollow Rd
Falls, PA 18615
|
1,358 sq. feet
|
1 baths 3 beds |
$295,500
|
show details |

|
#2
Searle St
Pittston, PA 18640
|
1,176 sq. feet
|
1 baths 2 beds |
$169,900
|
show details |

|
#3
W Main St
Nanticoke, PA 18634
|
1,474 sq. feet
|
1 baths 3 beds |
$208,500
|
show details |

|
#4
Garfield St
Nanticoke, PA 18634
|
1,312 sq. feet
|
1 baths 3 beds |
$131,500
|
show details |

|
#5
Liberty St
Pittston, PA 18641
|
960 sq. feet
|
1 baths 2 beds |
$152,500
|
show details |

|
#6
Cedar Ave
Scranton, PA 18505
|
1,500 sq. feet
|
1 baths 3 beds |
$26,900
|
show details |

|
#7
Maple St
Scranton, PA 18505
|
1,500 sq. feet
|
1 baths 3 beds |
$195,500
|
show details |

|
#8
Kelly St
Luzerne, PA 18709
|
- sq. feet
|
- baths - beds |
show details | |

|
#9
Miller St
Luzerne, PA 18709
|
- sq. feet
|
- baths - beds |
show details | |

|
#10
Old Mill Rd
Dalton, PA 18414
|
- sq. feet
|
1 baths 2 beds |
$103,000
|
show details |
| Photo | Address | Area | Beds / Baths | Price | Details |
|---|---|---|---|---|---|

|
#11
Chestnut St
Factoryville, PA 18419
|
- sq. feet
|
2 baths 2 beds |
$98,800
|
show details |

|
#12
New Alexander St
Wilkes Barre, PA 18702
|
1,560 sq. feet
|
1 baths 3 beds |
show details | |

|
#13
2nd St
Harveys Lake, PA 18618
|
1,676 sq. feet
|
1 baths 3 beds |
show details | |

|
#14
Grace St
Scranton, PA 18509
|
1,220 sq. feet
|
2 baths 4 beds |
show details | |

|
#15
Circle Dr
Pittston, PA 18643
|
- sq. feet
|
1 baths 3 beds |
show details | |

|
#16
Linden St
Pittston, PA 18643
|
2,428 sq. feet
|
3 baths 3 beds |
show details | |

|
#17
Walnut St
White Haven, PA 18661
|
1,175 sq. feet
|
1 baths 2 beds |
show details | |

|
#18
E Ridge St
Nanticoke, PA 18634
|
1,328 sq. feet
|
1 baths 3 beds |
show details | |

|
#19
Elizabeth St
Pittston, PA 18640
|
1,711 sq. feet
|
1 baths 3 beds |
show details | |

|
#20
Bear Creek Blvd
Wilkes Barre, PA 18702
|
- sq. feet
|
1 baths 3 beds |
show details |
| Photo | Address | Area | Beds / Baths | Price | Details |
|---|---|---|---|---|---|

|
#21
Wyoming Ave
Wyoming, PA 18644
|
- sq. feet
|
3 baths 3 beds |
show details | |

|
#22
Carey Ave
Wilkes Barre, PA 18702
|
- sq. feet
|
1 baths 3 beds |
show details | |

|
#23
W Main St
Glen Lyon, PA 18617
|
- sq. feet
|
2 baths 6 beds |
show details | |

|
#24
Oak St
Taylor, PA 18517
|
- sq. feet
|
1 baths 4 beds |
show details | |

|
#25
Main St
Noxen, PA 18636
|
- sq. feet
|
1 baths 2 beds |
show details | |

|
#26
Grace St
Scranton, PA 18509
|
- sq. feet
|
- baths - beds |
$39,900
|
show details |

|
#27
Slocum St
Kingston, PA 18704
|
- sq. feet
|
2 baths 3 beds |
show details | |

|
#28
W Grove St
Taylor, PA 18517
|
- sq. feet
|
1 baths 3 beds |
show details | |

|
#29
Blytheburn Rd
Mountain Top, PA 18707
|
- sq. feet
|
2 baths 3 beds |
show details | |

|
#30
Myers St
Kingston, PA 18704
|
- sq. feet
|
1 baths 3 beds |
show details |
| Photo | Address | Area | Beds / Baths | Price | Details |
|---|---|---|---|---|---|

|
#31
Hill St
Nanticoke, PA 18634
|
- sq. feet
|
- baths - beds |
show details | |

|
#32
E Union St
Nanticoke, PA 18634
|
- sq. feet
|
- baths - beds |
show details | |

|
#33
2nd St
Harveys Lake, PA 18618
|
- sq. feet
|
- baths - beds |
show details | |

|
#34
Martin St
Wilkes Barre, PA 18706
|
- sq. feet
|
- baths - beds |
show details | |

|
#35
Martin St
Wilkes Barre, PA 18706
|
- sq. feet
|
- baths - beds |
show details | |

|
#36
Adj Orchard Ave
Nanticoke, PA 18634
|
- sq. feet
|
- baths - beds |
show details | |

|
#37
E Main St
Nanticoke, PA 18634
|
- sq. feet
|
- baths - beds |
show details | |

|
#38
Donnelly St
Duryea, PA 18642
|
- sq. feet
|
- baths - beds |
show details | |

|
#39
Enterprise St
Nanticoke, PA 18634
|
- sq. feet
|
- baths - beds |
show details | |

|
#40
Ridge Ave
Dallas, PA 18612
|
- sq. feet
|
- baths - beds |
show details |
| Photo | Address | Area | Beds / Baths | Price | Details |
|---|---|---|---|---|---|

|
#41
E Field St
Nanticoke, PA 18634
|
- sq. feet
|
- baths - beds |
show details | |

|
#42
Ashley Ln
Wilkes Barre, PA 18702
|
- sq. feet
|
- baths - beds |
show details | |

|
#43
Demunds Rd
Dallas, PA 18612
|
- sq. feet
|
- baths - beds |
show details | |

|
#44
Hazle St
Wilkes Barre, PA 18702
|
- sq. feet
|
- baths - beds |
show details | |

|
#45
Laurel Run Rd
Wilkes Barre, PA 18702
|
- sq. feet
|
- baths - beds |
show details | |

|
#46
Trailwood Lake Rd
Wilkes Barre, PA 18702
|
- sq. feet
|
- baths - beds |
show details | |

|
#47
1/2 Phillip St
Nanticoke, PA 18634
|
- sq. feet
|
- baths - beds |
show details | |

|
#48
State Route 92 Hwy
Pittston, PA 18643
|
- sq. feet
|
- baths - beds |
show details | |

|
#49
W Poplar St
Nanticoke, PA 18634
|
- sq. feet
|
- baths - beds |
show details | |

|
Check over 1 million property listings on Foreclosure.com!
|
browse all offers | |||

Latest news about housing in Luzerne, PA collected exclusively by city-data.com from local newspapers, TV, and radio stations


Median year apartment built: 1952
Household type by relationship:
Households: 2,726- Male householders: 563 (276 living alone), Female householders: 843 (360 living alone)
362 spouses (362 opposite-sex spouses), 66 unmarried partners, (66 opposite-sex unmarried partners), 751 children (667 natural, 72 adopted, 11 stepchildren), 30 grandchildren, 7 brothers or sisters, 58 parents, 0 foster children, 0 other relatives, 40 non-relatives
- In group quarters: 4
Size of family households: 417 2-persons, 201 3-persons, 46 4-persons, 17 5-persons, 27 6-persons, 3 7-or-more-persons.
Size of nonfamily households: 614 1-person, 82 2-persons, 9 3-persons.
113 married couples with children.
404 single-parent households (72 men, 332 women).
98.1% of residents of Luzerne speak English at home.
1.5% of residents speak other Indo-European language at home (66% speak English very well, 34% speak English well).
Foreign born population: 26 (1.0%)
(111.5% of them are naturalized citizens)
| Here: | 6.2 |
| State: | 6.8 |
| Here: | 4.6 |
| State: | 4.3 |

- Bedrooms in owner-occupied houses and condos in Luzerne, Pennsylvania
- 0no bedroom
- 391 bedroom
- 2112 bedrooms
- 4813 bedrooms
- 954 bedrooms
- 185+ bedrooms

- Bedrooms in renter-occupied apartments in Luzerne, Pennsylvania
- 41no bedroom
- 1181 bedroom
- 2782 bedrooms
- 1283 bedrooms
- 194 bedrooms
- 05+ bedrooms

- Cars and other vehicles available in Luzerne in owner-occupied houses/condos
- 67no vehicle
- 3931 vehicle
- 2222 vehicles
- 1023 vehicles
- 604 vehicles
- 05+ vehicles

- Cars and other vehicles available in Luzerne in renter-occupied apartments
- 172no vehicle
- 2901 vehicle
- 1072 vehicles
- 73 vehicles
- 84 vehicles
- 05+ vehicles

- Rooms in owner-occupied houses in Luzerne, Pennsylvania
- 01 room
- 02 rooms
- 103 rooms
- 414 rooms
- 965 rooms
- 4076 rooms
- 697 rooms
- 688 rooms
- 1539+ rooms

- Rooms in renter-occupied apartments in Luzerne, Pennsylvania
- 411 room
- 132 rooms
- 883 rooms
- 1394 rooms
- 1145 rooms
- 1186 rooms
- 447 rooms
- 198 rooms
- 79+ rooms


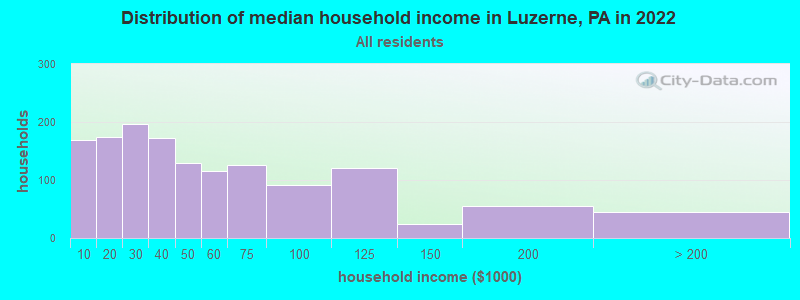
Luzerne, PA household income distribution

- 169Less than $10,000
- 175$10,000 to $19,999
- 196$20,000 to $29,999
- 172$30,000 to $39,999
- 130$40,000 to $49,999
- 115$50,000 to $59,999
- 126$60,000 to $74,999
- 91$75,000 to $99,999
- 121$100,000 to $124,999
- 24$125,000 to $149,999
- 55$150,000 to $199,999
- 45$200,000 or more
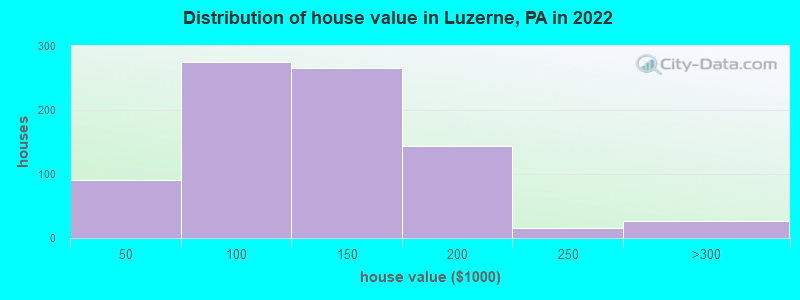
Home value of owner - occupied houses in 2022 in Luzerne, PA
-
- 6$15,000 to $19,999
- 11$20,000 to $24,999
- 43$35,000 to $39,999
- 29$40,000 to $49,999
- 23$50,000 to $59,999
- 16$60,000 to $69,999
- 125$70,000 to $79,999
- 6$80,000 to $89,999
- 73$90,000 to $99,999
- 226$100,000 to $124,999
- 37$125,000 to $149,999
- 111$150,000 to $174,999
- 32$175,000 to $199,999
- 15$200,000 to $249,999
- 27$250,000 to $299,999
Rent paid by renters in 2022 in Luzerne, PA
-
- 9$250 to $299
- 17$300 to $349
- 110$400 to $449
- 57$450 to $499
- 36$500 to $549
- 23$550 to $599
- 216$600 to $649
- 33$650 to $699
- 17$700 to $749
- 49$800 to $899
- 47$1,000 to $1,249
- 43No cash rent


Percentage of workers working in this county: 89.4%
Number of people working at home: 138 (10.0% of all workers)
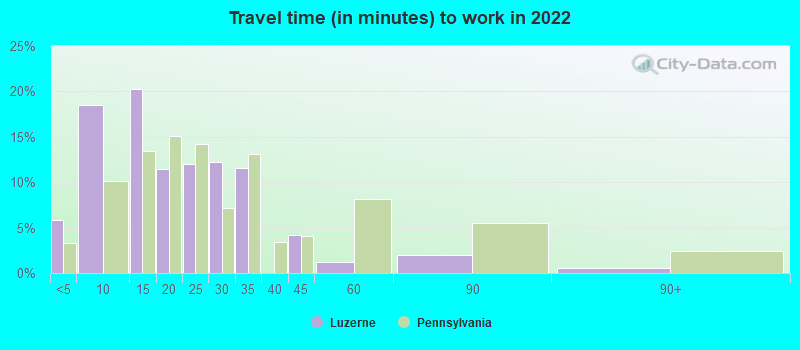
Travel time to work (commute)
- Less than 5 minutes: 22
- 5 to 9 minutes: 241
- 10 to 14 minutes: 367
- 15 to 19 minutes: 176
- 20 to 24 minutes: 181
- 25 to 29 minutes: 83
- 30 to 34 minutes: 55
- 35 to 39 minutes: 25
- 40 to 44 minutes: 27
- 45 to 59 minutes: 11
- 60 to 89 minutes: 17
- 90 or more minutes: 24
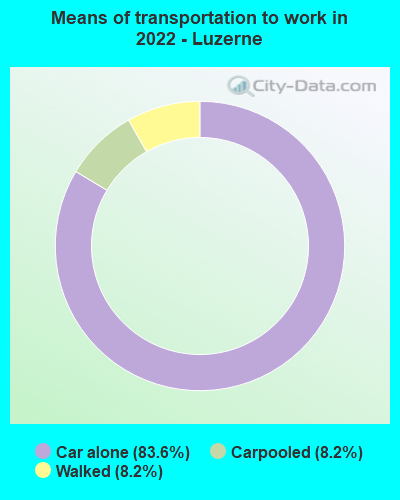
Means of transportation to work:
- Drove a car alone: 907 (73.9%)
- Carpooled: 94 (7.7%)
- Walked: 84 (6.8%)
- Worked at home: 138 (11.2%)

- Unemployment by race in 2022
- Unemployment rate for White non-Hispanic residents
- 8.1%Males
- 2.4%Females
- Unemployment rate for two or more race residents
- 100.0%Females

- Year of entry for the foreign-born population in Luzerne, Pennsylvania
- 02010 or later
- 02000 to 2009
- 01990 to 1999
- 61980 to 1989
- 01970 to 1979
- 20Before 1970

First ancestries reported:
- Polish: 167 (23.6%)
- Italian: 132 (18.7%)
- Irish: 98 (13.8%)
- German: 41 (5.8%)
- Slovak: 41 (5.8%)
- Russian: 37 (5.2%)
- Welsh: 29 (4.1%)
- English: 21 (3.0%)
- Eastern European: 16 (2.3%)
- Lithuanian: 15 (2.1%)
- Swedish: 12 (1.7%)
- American: 11 (1.6%)
- Czechoslovakian: 7 (1.0%)
- European: 7 (1.0%)
Most common places of birth for foreign-born residents (%):
| Luzerne: | 76.0% (19) |
| Pennsylvania: | 1.8% (16,884) |
Place of birth for U.S.-born residents:
- This state: 2,399
- Other state: 247
- Northeast: 163
- Midwest: 23
- South: 18
- West: 39
88.8% of Luzerne residents lived in the same house 1 years ago.
Out of people who lived in different houses, 49.4% lived in this county.
Out of people who lived in different counties, 100.0% lived in Pennsylvania.
| Luzerne: | 88.8% |
| State average: | 89.3% |
Education attainment for males 25 years and older:
- No schooling: 1
- Nursery to 4th grade: 0
- 5th and 6th grade: 0
- 7th and 8th grade: 0
- 9th grade: 0
- 10th grade: 32
- 11th grade: 37
- 12th grade, no diploma: 16
- High school graduate (or equivalency): 372
- Less than 1 year of college: 61
- Some college more than 1 year, no degree: 113
- Associate degree: 106
- Bachelor's degree: 114
- Master's degree: 9
- Professional school degree: 26
- Doctorate degree: 0

Education attainment for females 25 years and older:
- No schooling: 10
- Nursery to 4th grade: 0
- 5th and 6th grade: 16
- 7th and 8th grade: 0
- 9th grade: 2
- 10th grade: 9
- 11th grade: 6
- 12th grade, no diploma: 57
- High school graduate (or equivalency): 337
- Less than 1 year of college: 94
- Some college more than 1 year, no degree: 156
- Associate degree: 299
- Bachelor's degree: 98
- Master's degree: 0
- Professional school degree: 4
- Doctorate degree: 0


Housing units in structures:
- One, detached: 1,106
- One, attached: 131
- Two: 117
- 3 or 4: 176
- 5 to 9: 18
- 10 to 19: 13
- 20 to 49: 17
- 50 or more: 96
Housing units lacking complete kitchen facilities in 2022: 0.9%
House/condo owner moved in on average 21 years ago
Renter moved in on average 3 years ago

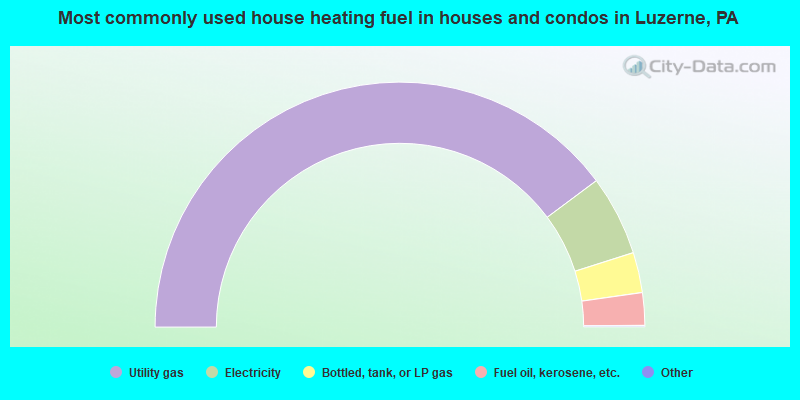
- 79.7%Utility gas
- 10.6%Electricity
- 5.3%Bottled, tank, or LP gas
- 4.3%Fuel oil, kerosene, etc.
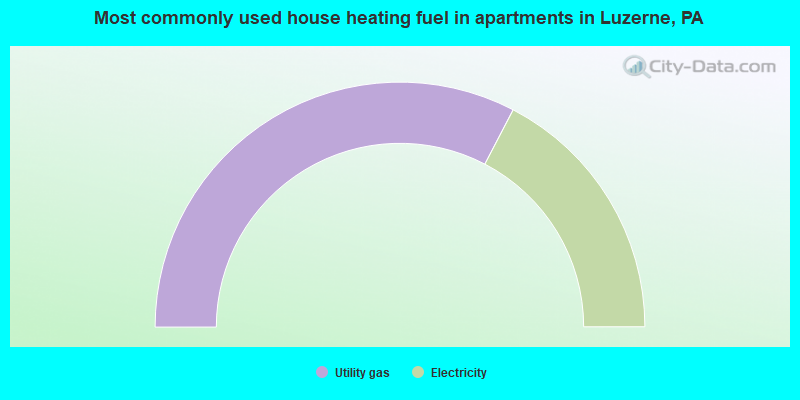
- 65.3%Utility gas
- 34.7%Electricity
Private vs. public school enrollment:
| Here: | 18.4% |
| Pennsylvania: | 15.7% |
| Here: | 15.4% |
| Pennsylvania: | 13.4% |
| Here: | 63.8% |
| Pennsylvania: | 39.8% |


