Housing density: 2,469 houses/condos per square mile
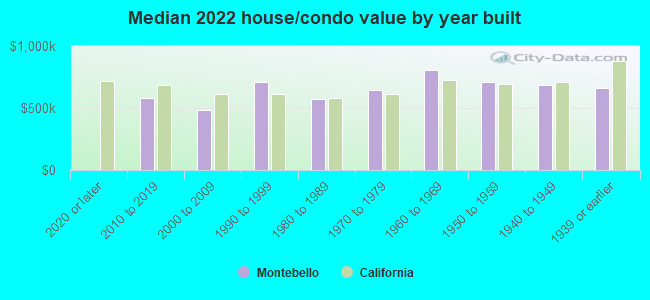
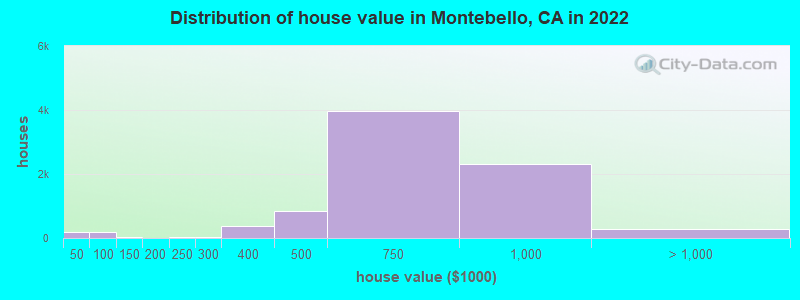
Median price asked for vacant for-sale houses and condos in 2022: $767,545.
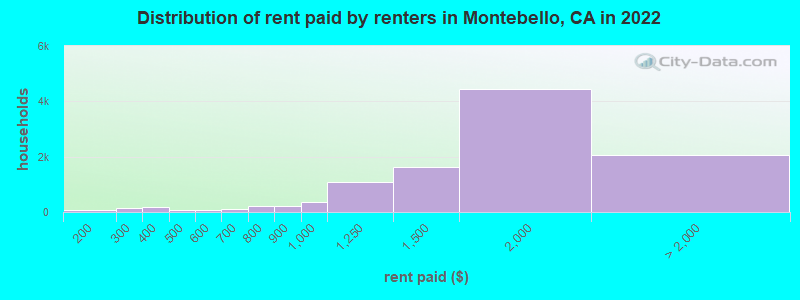
Median contract rent in 2022: $1,604 (lower quartile is $1,248, upper quartile is $1,898)
Median rent asked for vacant for-rent units in 2022: $1,428
Median gross rent in Montebello, CA in 2022: $1,701
Housing units in Montebello with a mortgage: 5,094 (397 second mortgage, 38 home equity loan, 314 both second mortgage and home equity loan) Houses without a mortgage: 76
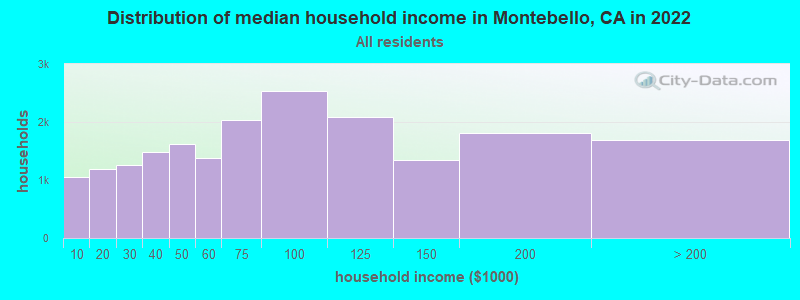
Median household income for houses/condos with a mortgage: $122,342
Median household income for apartments without a mortgage: $76,897
5,339 married couples with children.
4,523 single-parent households (1,165 men, 3,358 women).
29.5% of residents of Montebello speak English at home.
57.0% of residents speak Spanish at home (62% speak English very well, 16% speak English well, 16% speak English not well, 7% don't speak English at all).
4.0% of residents speak other Indo-European language at home (64% speak English very well, 25% speak English well, 10% speak English not well, 1% don't speak English at all).
9.4% of residents speak Asian or Pacific Island language at home (41% speak English very well, 25% speak English well, 23% speak English not well, 11% don't speak English at all).
0.1% of residents speak other language at home (62% speak English very well, 4% speak English well, 35% speak English not well).
Foreign born population: 21,967 (36.2%)
(54.1% of them are naturalized citizens)
Percentage of workers working in this county: 94.1% Number of people working at home: 2,754 (9.4% of all workers)
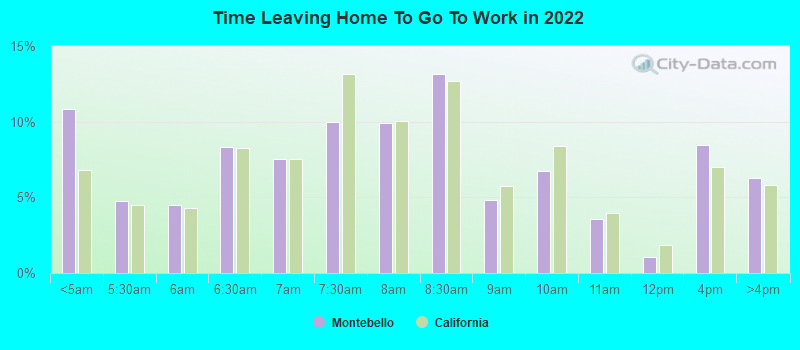
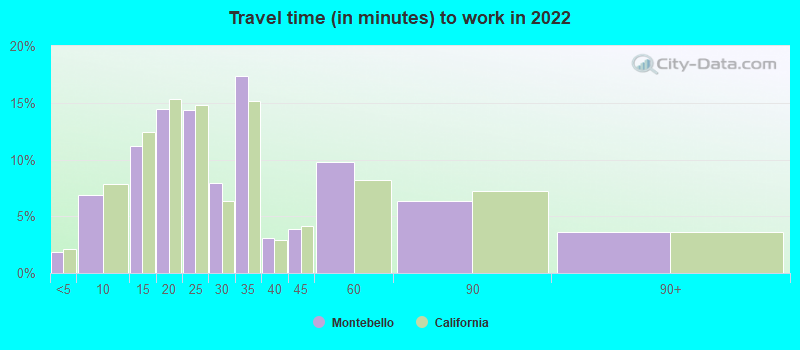
Travel time to work (commute)
Less than 5 minutes: 548
5 to 9 minutes: 1,288
10 to 14 minutes: 2,334
15 to 19 minutes: 2,985
20 to 24 minutes: 3,832
25 to 29 minutes: 1,867
30 to 34 minutes: 5,085
35 to 39 minutes: 540
40 to 44 minutes: 1,278
45 to 59 minutes: 2,808
60 to 89 minutes: 2,378
90 or more minutes: 896
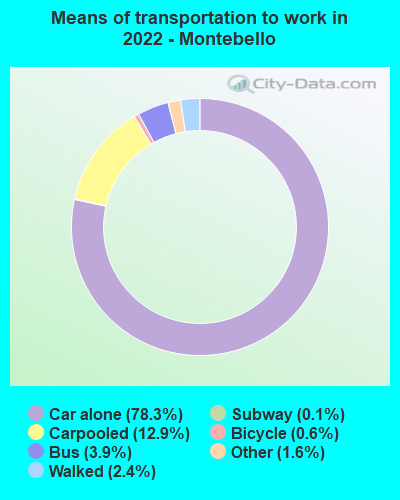
Means of transportation to work:
Drove a car alone: 15,678 (67.5%)
Carpooled: 2,859 (12.3%)
Bus: 715 (3.1%)
Long-distance train or commuter rail: 14 (0.1%)
Taxi: 360 (1.5%)
Bicycle: 132 (0.6%)
Walked: 524 (2.3%)
Worked at home: 2,754 (11.9%)
Unemployment by race in 2022
Unemployment rate for White non-Hispanic residents
11.0%Males
4.9%Females
Unemployment rate for Black residents
9.9%Males
12.7%Females
Unemployment rate for American Indian and Alaska Native residents
2.7%Males
14.8%Females
Unemployment rate for Asian residents
5.8%Males
3.4%Females
Unemployment rate for other race residents
6.9%Males
4.4%Females
Unemployment rate for two or more race residents
2.0%Males
8.0%Females
Unemployment rate for Hispanic or Latino residents
4.8%Males
6.3%Females
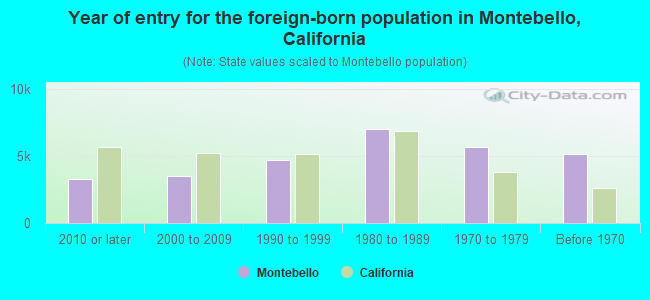
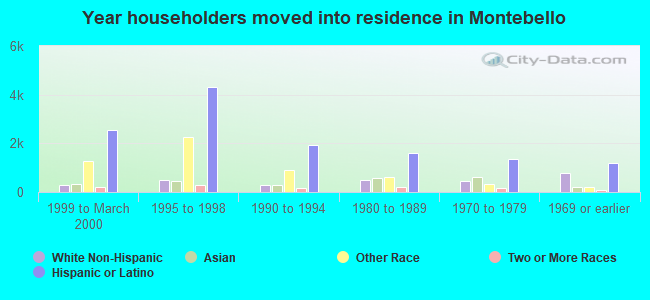
Year of entry for the foreign-born population in Montebello, California
3,2822010 or later
3,4722000 to 2009
4,6571990 to 1999
6,9971980 to 1989
5,6591970 to 1979
5,154Before 1970
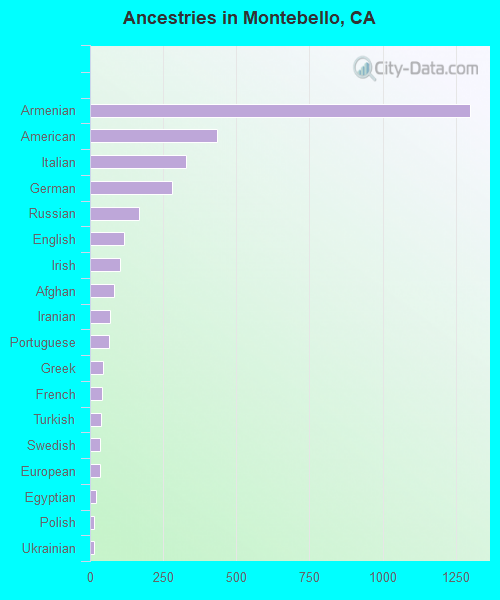
First ancestries reported:
Armenian: 1,299 (2.9%)
American: 434 (1.0%)
Italian: 327 (0.7%)
German: 282 (0.6%)
Russian: 167 (0.4%)
English: 116 (0.3%)
Irish: 101 (0.2%)
Afghan: 83 (0.2%)
Iranian: 67 (0.1%)
Portuguese: 64 (0.1%)
Greek: 43 (0.10%)
French: 40 (0.09%)
Turkish: 37 (0.08%)
Swedish: 35 (0.08%)
European: 34 (0.08%)
Egyptian: 21 (0.05%)
Polish: 12 (0.03%)
Ukrainian: 12 (0.03%)
Northern European: 9 (0.02%)
Jamaican: 9 (0.02%)
Nigerian: 8 (0.02%)
Lebanese: 7 (0.02%)
Dutch: 5 (0.01%)
Scotch-Irish: 5 (0.01%)
Norwegian: 4 (0.01%)
Romanian: 4 (0.01%)
Most common places of birth for foreign-born residents (%):
Mexico
Montebello:
53.6% (11,772)
California:
37.2% (3,881,193)
China, excluding Hong Kong and Taiwan
Montebello:
8.3% (1,814)
California:
6.6% (684,672)
El Salvador
Montebello:
8.0% (1,759)
California:
4.2% (440,287)
Philippines
Montebello:
4.0% (877)
California:
7.8% (818,297)
Armenia
Montebello:
4.0% (875)
California:
0.8% (78,847)
Guatemala
Montebello:
2.1% (460)
California:
2.8% (290,436)
India
Montebello:
2.0% (448)
California:
5.2% (539,184)
Honduras
Montebello:
1.9% (426)
California:
0.6% (66,590)
Vietnam
Montebello:
1.8% (399)
California:
4.9% (512,335)
Korea
Montebello:
1.7% (371)
California:
3.0% (315,248)
Place of birth for U.S.-born residents:
This state: 36,292
Other state: 1,965
Northeast: 237
Midwest: 356
South: 576
West: 750
93.1% of Montebello residents lived in the same house 1 years ago. Out of people who lived in different houses, 46.4% lived in this county. Out of people who lived in different counties, 66.2% lived in California.
Montebello:
93.1%
State average:
88.9%
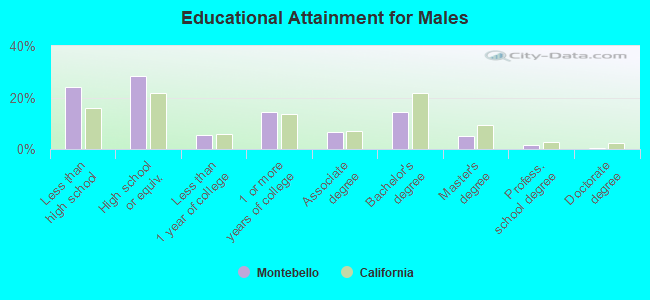
Education attainment for males 25 years and older:
No schooling: 918
Nursery to 4th grade: 357
5th and 6th grade: 846
7th and 8th grade: 270
9th grade: 721
10th grade: 482
11th grade: 497
12th grade, no diploma: 951
High school graduate (or equivalency): 5,907
Less than 1 year of college: 1,109
Some college more than 1 year, no degree: 3,030
Associate degree: 1,371
Bachelor's degree: 2,987
Master's degree: 1,018
Professional school degree: 326
Doctorate degree: 116
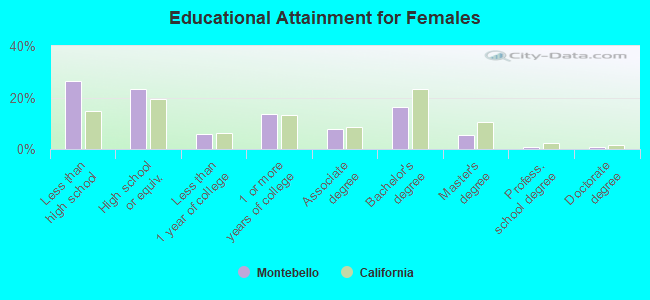
Education attainment for females 25 years and older:
No schooling: 1,196
Nursery to 4th grade: 419
5th and 6th grade: 1,158
7th and 8th grade: 322
9th grade: 770
10th grade: 319
11th grade: 454
12th grade, no diploma: 1,103
High school graduate (or equivalency): 5,015
Less than 1 year of college: 1,249
Some college more than 1 year, no degree: 2,941
Associate degree: 1,660
Bachelor's degree: 3,577
Master's degree: 1,146
Professional school degree: 143
Doctorate degree: 207
Housing units in structures:
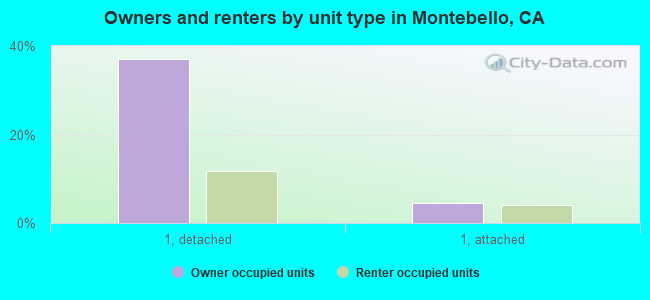
One, detached: 10,038
One, attached: 1,648
Two: 396
3 or 4: 2,214
5 to 9: 1,099
10 to 19: 1,338
20 to 49: 1,432
50 or more: 1,874
Mobile homes: 313
Median worth of mobile homes: $79,185
Housing units lacking complete plumbing facilities in 2022: 1.7%
Housing units lacking complete kitchen facilities in 2022: 2.9%
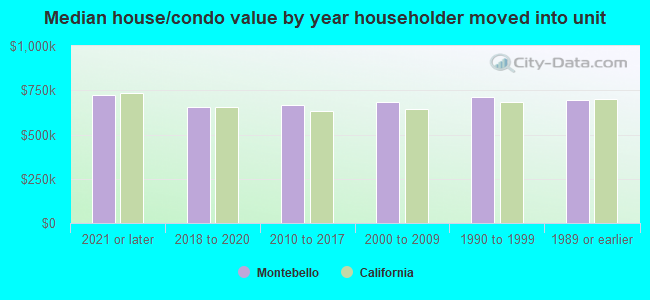
House/condo owner moved in on average 21 years ago