Natchitoches, LA (Louisiana) Houses and Residents
| Natchitoches: | $184,830 |
| Louisiana: | $209,200 |
Mean price in 2022:
Detached houses: $264,669
Here: $264,669 State: $273,555 Townhouses or other attached units: $243,443
Here: $243,443 State: $297,713 Mobile homes: $64,069
Here: $64,069 State: $89,857
Total population: 18,384 (Urban population: 17,760 (all inside urban clusters), Rural population: 174 (all nonfarm))
Houses: 7,934 (6,092 occupied: 2,639 owner occupied, 3,534 renter occupied)
| % of renters here: | 57% |
| State: | 32% |
Housing density: 368 houses/condos per square mile
Median price asked for vacant for-sale houses and condos in 2022: $2,351,313.
Median contract rent in 2022: $523 (lower quartile is $352, upper quartile is $808)
Median rent asked for vacant for-rent units in 2022: $883
Median gross rent in Natchitoches, LA in 2022: $728
Housing units in Natchitoches with a mortgage: 1,428 (45 second mortgage, 11 home equity loan, 25 both second mortgage and home equity loan)
Houses without a mortgage: 17
Median household income for houses/condos with a mortgage: $98,411
Median household income for apartments without a mortgage: $48,835
Median monthly housing costs: $750
Compare current foreclosures in Natchitoches, LA:
| Photo | Address | Area | Beds / Baths | Price | Details |
|---|---|---|---|---|---|

|
#1
Anita St
Natchitoches, LA 71457
|
922 sq. feet
|
1 baths 3 beds |
$124,900
|
show details |

|
#2
St
Natchitoches, LA 71457
|
- sq. feet
|
- baths - beds |
$5,620
|
show details |

|
#3
Seventh St
Natchitoches, LA 71457
|
- sq. feet
|
- baths - beds |
$5,620
|
show details |

|
#4
Lafayette St
Natchitoches, LA 71457
|
- sq. feet
|
- baths - beds |
$5,252
|
show details |

|
#5
Allen St
Natchitoches, LA 71457
|
- sq. feet
|
- baths - beds |
$5,620
|
show details |

|
#6
Prather St
Natchitoches, LA 71457
|
- sq. feet
|
- baths - beds |
$6,597
|
show details |

|
#7
St
Natchitoches, LA 71457
|
- sq. feet
|
- baths - beds |
$4,834
|
show details |

|
#8
John St
Natchitoches, LA 71457
|
- sq. feet
|
- baths - beds |
$5,245
|
show details |

|
#9
Berry Ave
Natchitoches, LA 71457
|
- sq. feet
|
- baths - beds |
$5,037
|
show details |

|
#10
Grayson St
Natchitoches, LA 71457
|
- sq. feet
|
- baths - beds |
$5,245
|
show details |
| Photo | Address | Area | Beds / Baths | Price | Details |
|---|---|---|---|---|---|

|
#11
Jean Marie St
Natchitoches, LA 71457
|
- sq. feet
|
- baths - beds |
$5,010
|
show details |

|
#12
Marie St
Natchitoches, LA 71457
|
- sq. feet
|
1 baths 3 beds |
show details | |

|
#13
Grace Ave
Natchitoches, LA 71457
|
- sq. feet
|
- baths - beds |
$5,651
|
show details |

|
#14
E 4th St
Natchitoches, LA 71457
|
- sq. feet
|
- baths - beds |
show details | |

|
#15
Maria Ln Apt S1
Natchitoches, LA 71457
|
- sq. feet
|
- baths - beds |
show details | |

|
#16
Independence St
Natchitoches, LA 71457
|
- sq. feet
|
- baths - beds |
show details | |

|
#17
Berry Ave
Natchitoches, LA 71457
|
- sq. feet
|
- baths - beds |
show details | |

|
#18
Rowena St
Natchitoches, LA 71457
|
- sq. feet
|
- baths - beds |
show details | |

|
#19
Gold St
Natchitoches, LA 71457
|
- sq. feet
|
- baths - beds |
show details | |

|
#20
Castleton St
Natchitoches, LA 71457
|
- sq. feet
|
- baths - beds |
show details |
| Photo | Address | Area | Beds / Baths | Price | Details |
|---|---|---|---|---|---|

|
#21
Grace Ave
Natchitoches, LA 71457
|
- sq. feet
|
- baths - beds |
show details | |

|
#22
Keyser Ave # B
Natchitoches, LA 71457
|
- sq. feet
|
- baths - beds |
show details | |

|
#23
Clarence Dr
Natchitoches, LA 71457
|
- sq. feet
|
- baths - beds |
show details | |

|
#24
Bermuda Rd
Natchitoches, LA 71457
|
- sq. feet
|
- baths - beds |
show details | |

|
#25
E 5th St
Natchitoches, LA 71457
|
- sq. feet
|
- baths - beds |
show details | |

|
#26
Grace Ave
Natchitoches, LA 71457
|
- sq. feet
|
- baths - beds |
show details | |

|
#27
Kyle St
Natchitoches, LA 71457
|
- sq. feet
|
- baths - beds |
show details | |

|
#28
Sabine St
Natchitoches, LA 71457
|
- sq. feet
|
- baths - beds |
show details | |

|
#29
W Lakeshore Dr
Natchitoches, LA 71457
|
- sq. feet
|
- baths - beds |
show details | |

|
#30
W Lakeshore Dr
Natchitoches, LA 71457
|
- sq. feet
|
- baths - beds |
show details |
| Photo | Address | Area | Beds / Baths | Price | Details |
|---|---|---|---|---|---|

|
#31
Eugene Evans Rd
Natchitoches, LA 71457
|
- sq. feet
|
- baths - beds |
show details | |

|
#32
Lakeview Dr Ofc No4002
Natchitoches, LA 71457
|
- sq. feet
|
- baths - beds |
show details | |

|
#33
Fairgrounds Rd Apt D21
Natchitoches, LA 71457
|
- sq. feet
|
- baths - beds |
show details | |

|
#34
Cherie Loop
Natchitoches, LA 71457
|
- sq. feet
|
- baths - beds |
show details | |

|
#35
Rosebud Dr
Natchitoches, LA 71457
|
- sq. feet
|
- baths - beds |
show details | |

|
#36
Bayou Derbonne Rd
Natchitoches, LA 71457
|
- sq. feet
|
- baths - beds |
show details | |

|
#37
Hancock Ave
Natchitoches, LA 71457
|
- sq. feet
|
- baths - beds |
show details | |

|
#38
Virginia Ave
Natchitoches, LA 71457
|
- sq. feet
|
- baths - beds |
show details | |

|
#39
Fish Hatchery Rd
Natchitoches, LA 71457
|
- sq. feet
|
- baths - beds |
show details | |

|
#40
Highway 3278
Natchitoches, LA 71457
|
- sq. feet
|
- baths - beds |
show details |
| Photo | Address | Area | Beds / Baths | Price | Details |
|---|---|---|---|---|---|

|
#41
Tjoe St
Natchitoches, LA 71457
|
- sq. feet
|
- baths - beds |
show details | |

|
#42
Alexandria St
Natchitoches, LA 71457
|
- sq. feet
|
- baths - beds |
show details | |

|
#43
James Scarborough Rd
Natchitoches, LA 71457
|
- sq. feet
|
- baths - beds |
show details | |

|
#44
North St
Natchitoches, LA 71457
|
- sq. feet
|
- baths - beds |
show details | |

|
#45
Lakeview Dr # No4202
Natchitoches, LA 71457
|
- sq. feet
|
- baths - beds |
show details | |

|
#46
Dixie St
Natchitoches, LA 71457
|
- sq. feet
|
- baths - beds |
show details | |

|
#47
Highway 504
Natchitoches, LA 71457
|
- sq. feet
|
- baths - beds |
show details | |

|
#48
Fish Hatchery Rd
Natchitoches, LA 71457
|
- sq. feet
|
- baths - beds |
show details | |

|
#49
Keyser Ave Unit 2751
Natchitoches, LA 71457
|
- sq. feet
|
- baths - beds |
show details | |

|
Check over 1 million property listings on Foreclosure.com!
|
browse all offers | |||

Latest news about housing in Natchitoches, LA collected exclusively by city-data.com from local newspapers, TV, and radio stations

 | Is Natchitoches or Monroe more touristy? (8 replies) |
| New to Natchitoches, Louisiana! Please help (8 replies) |
| Opinions on Alexandria and Lafayette. (121 replies) |
| Apartment Search in Natchitoches (1 reply) |
| Looking for housing in Natchitoches, LA (0 replies) |
| Shreveport/Bossier Apartments? (26 replies) |

Median year apartment built: 1986
Household type by relationship:
Households: 17,713- Male householders: 2,461 (1,081 living alone), Female householders: 3,471 (1,160 living alone)
1,610 spouses (1,586 opposite-sex spouses), 670 unmarried partners, (670 opposite-sex unmarried partners), 4,745 children (4,520 natural, 31 adopted, 193 stepchildren), 604 grandchildren, 265 brothers or sisters, 163 parents, 4 foster children, 368 other relatives, 1,378 non-relatives
- In group quarters: 1,968
Size of family households: 1,342 2-persons, 850 3-persons, 285 4-persons, 192 5-persons, 185 6-persons, 27 7-or-more-persons.
Size of nonfamily households: 2,388 1-person, 711 2-persons, 170 3-persons, 96 4-persons, 2 7-or-more-persons.
1,222 married couples with children.
1,911 single-parent households (95 men, 1,816 women).
96.4% of residents of Natchitoches speak English at home.
1.4% of residents speak Spanish at home (89% speak English very well, 8% speak English well, 2% speak English not well).
0.8% of residents speak other Indo-European language at home (76% speak English very well, 24% speak English well).
0.8% of residents speak Asian or Pacific Island language at home (93% speak English very well, 5% speak English well, 2% speak English not well).
0.3% of residents speak other language at home (100% speak English very well).
Foreign born population: 275 (1.6%)
(51.6% of them are naturalized citizens)
| Here: | 6.5 |
| State: | 6.2 |
| Here: | 4.4 |
| State: | 4.4 |

- Bedrooms in owner-occupied houses and condos in Natchitoches, Louisiana
- 49no bedroom
- 241 bedroom
- 3032 bedrooms
- 1,6933 bedrooms
- 4824 bedrooms
- 895+ bedrooms

- Bedrooms in renter-occupied apartments in Natchitoches, Louisiana
- 37no bedroom
- 7201 bedroom
- 1,7452 bedrooms
- 7803 bedrooms
- 2514 bedrooms
- 15+ bedrooms

- Cars and other vehicles available in Natchitoches in owner-occupied houses/condos
- 109no vehicle
- 8441 vehicle
- 1,1422 vehicles
- 4013 vehicles
- 1274 vehicles
- 155+ vehicles

- Cars and other vehicles available in Natchitoches in renter-occupied apartments
- 657no vehicle
- 1,7731 vehicle
- 7742 vehicles
- 1833 vehicles
- 1224 vehicles
- 255+ vehicles

- Rooms in owner-occupied houses in Natchitoches, Louisiana
- 491 room
- 92 rooms
- 283 rooms
- 1834 rooms
- 5415 rooms
- 4976 rooms
- 5027 rooms
- 4798 rooms
- 3509+ rooms

- Rooms in renter-occupied apartments in Natchitoches, Louisiana
- 371 room
- 1802 rooms
- 4493 rooms
- 1,1604 rooms
- 8725 rooms
- 5326 rooms
- 1267 rooms
- 498 rooms
- 1309+ rooms


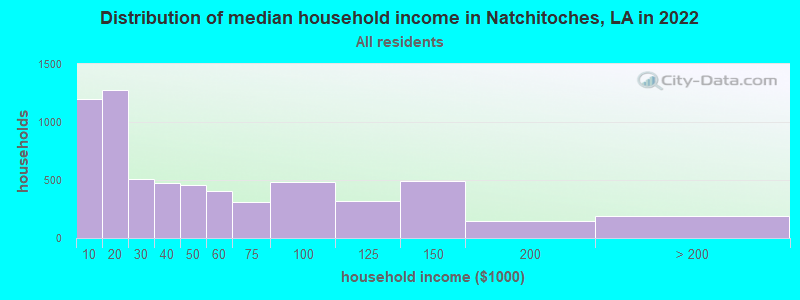
Natchitoches, LA household income distribution

- 1,194Less than $10,000
- 1,272$10,000 to $19,999
- 505$20,000 to $29,999
- 476$30,000 to $39,999
- 459$40,000 to $49,999
- 409$50,000 to $59,999
- 309$60,000 to $74,999
- 482$75,000 to $99,999
- 319$100,000 to $124,999
- 494$125,000 to $149,999
- 148$150,000 to $199,999
- 192$200,000 or more
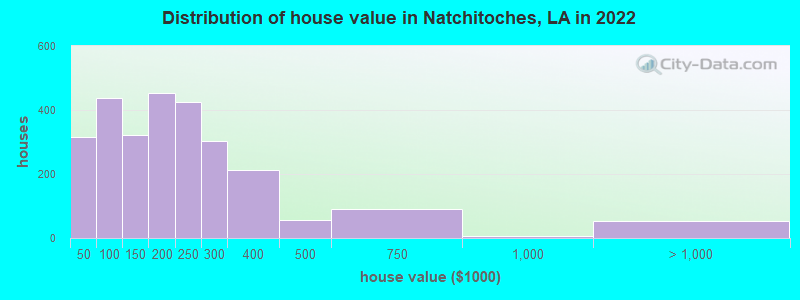
Home value of owner - occupied houses in 2022 in Natchitoches, LA
-
- 34Less than $10,000
- 7$10,000 to $14,999
- 40$15,000 to $19,999
- 11$20,000 to $24,999
- 19$25,000 to $29,999
- 77$30,000 to $34,999
- 13$35,000 to $39,999
- 112$40,000 to $49,999
- 38$50,000 to $59,999
- 45$60,000 to $69,999
- 66$70,000 to $79,999
- 88$80,000 to $89,999
- 88$90,000 to $99,999
- 162$100,000 to $124,999
- 159$125,000 to $149,999
- 248$150,000 to $174,999
- 203$175,000 to $199,999
- 424$200,000 to $249,999
- 304$250,000 to $299,999
- 213$300,000 to $399,999
- 57$400,000 to $499,999
- 90$500,000 to $749,999
- 6$750,000 to $999,999
- 44$1,000,000 to $1,499,999
- 3$1,500,000 to $1,999,999
- 4$2,000,000 or more
Rent paid by renters in 2022 in Natchitoches, LA
-
- 192Less than $100
- 167$100 to $149
- 241$150 to $199
- 199$200 to $249
- 27$250 to $299
- 60$300 to $349
- 117$350 to $399
- 373$400 to $449
- 130$450 to $499
- 429$500 to $549
- 95$550 to $599
- 276$600 to $649
- 146$650 to $699
- 146$700 to $749
- 81$750 to $799
- 223$800 to $899
- 208$900 to $999
- 147$1,000 to $1,249
- 76$1,250 to $1,499
- 26$1,500 to $1,999
- 66$2,000 to $2,499
- 211No cash rent


Percentage of workers working in this county: 91.2%
Number of people working at home: 211 (3.3% of all workers)
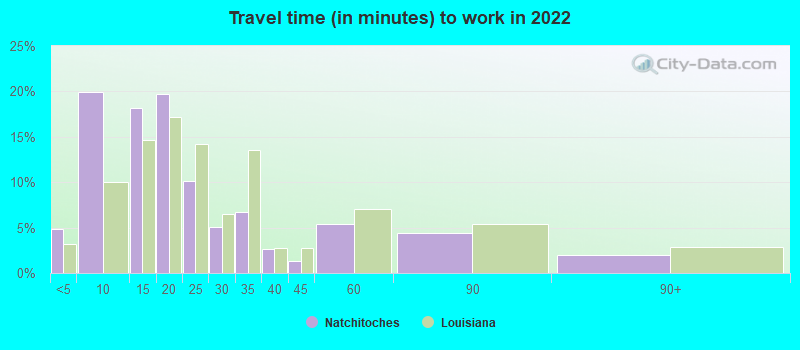
Travel time to work (commute)
- Less than 5 minutes: 409
- 5 to 9 minutes: 1,743
- 10 to 14 minutes: 1,588
- 15 to 19 minutes: 1,196
- 20 to 24 minutes: 327
- 25 to 29 minutes: 170
- 30 to 34 minutes: 167
- 35 to 39 minutes: 102
- 40 to 44 minutes: 29
- 45 to 59 minutes: 125
- 60 to 89 minutes: 148
- 90 or more minutes: 126
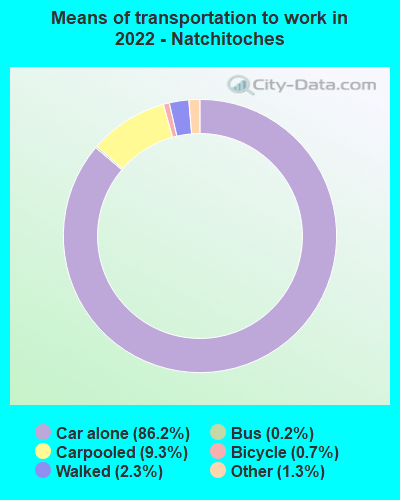
Means of transportation to work:
- Drove a car alone: 8,811 (83.0%)
- Carpooled: 948 (8.9%)
- Bus: 16 (0.2%)
- Taxi: 150 (1.4%)
- Bicycle: 53 (0.5%)
- Walked: 269 (2.5%)
- Worked at home: 211 (2.0%)

- Unemployment by race in 2022
- Unemployment rate for White non-Hispanic residents
- 2.0%Males
- 0.9%Females
- Unemployment rate for Black residents
- 16.4%Males
- 19.0%Females
- Unemployment rate for two or more race residents
- 3.8%Females

- Year of entry for the foreign-born population in Natchitoches, Louisiana
- 802010 or later
- 1072000 to 2009
- 191990 to 1999
- 1971980 to 1989
- 141970 to 1979
- 5Before 1970
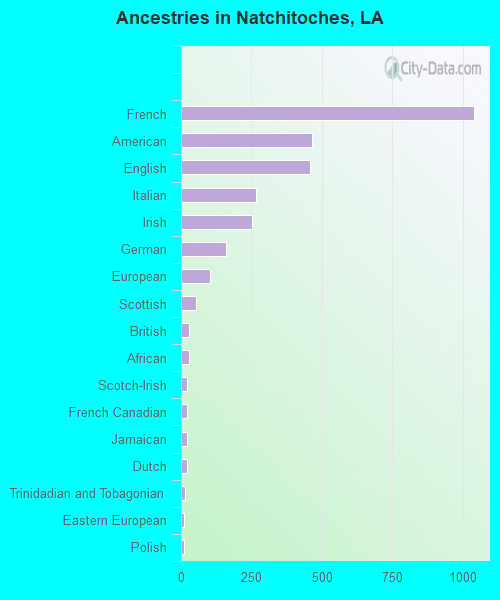
First ancestries reported:
- French: 1,042 (8.7%)
- American: 465 (3.9%)
- English: 460 (3.9%)
- Italian: 267 (2.2%)
- Irish: 252 (2.1%)
- German: 161 (1.3%)
- European: 102 (0.9%)
- Scottish: 53 (0.4%)
- British: 29 (0.2%)
- African: 29 (0.2%)
- Scotch-Irish: 23 (0.2%)
- French Canadian: 22 (0.2%)
- Jamaican: 21 (0.2%)
- Dutch: 20 (0.2%)
- Trinidadian and Tobagonian: 15 (0.1%)
- Eastern European: 11 (0.09%)
- Polish: 11 (0.09%)
- Jordanian: 8 (0.07%)
- Cajun: 7 (0.06%)
- Danish: 6 (0.05%)
- Belgian: 3 (0.03%)
- Northern European: 2 (0.02%)
- Serbian: 2 (0.02%)
- Swedish: 2 (0.02%)
- Norwegian: 1 (0.01%)
Most common places of birth for foreign-born residents (%):
| Natchitoches: | 20.3% (58) |
| Louisiana: | 3.4% (6,779) |
| Natchitoches: | 18.2% (52) |
| Louisiana: | 12.1% (23,732) |
| Natchitoches: | 9.4% (27) |
| Louisiana: | 1.5% (2,933) |
| Natchitoches: | 7.7% (22) |
| Louisiana: | 1.0% (1,951) |
| Natchitoches: | 6.3% (18) |
| Louisiana: | 3.1% (6,172) |
| Natchitoches: | 5.9% (17) |
| Louisiana: | 0.1% (156) |
| Natchitoches: | 5.2% (15) |
| Louisiana: | 0.7% (1,420) |
| Natchitoches: | 4.5% (13) |
| Louisiana: | 0.7% (1,446) |
| Natchitoches: | 3.1% (9) |
| Louisiana: | 0.7% (1,370) |
| Natchitoches: | 3.1% (9) |
| Louisiana: | 0.5% (905) |
| Natchitoches: | 2.8% (8) |
| Louisiana: | 9.2% (18,115) |
| Natchitoches: | 2.8% (8) |
| Louisiana: | 18.9% (37,225) |
Place of birth for U.S.-born residents:
- This state: 13,294
- Other state: 4,060
- Northeast: 178
- Midwest: 363
- South: 2,779
- West: 722
77.4% of Natchitoches residents lived in the same house 1 years ago.
Out of people who lived in different houses, 32.6% lived in this county.
Out of people who lived in different counties, 64.1% lived in Louisiana.
| Natchitoches: | 77.4% |
| State average: | 88.3% |
Education attainment for males 25 years and older:
- No schooling: 104
- Nursery to 4th grade: 4
- 5th and 6th grade: 3
- 7th and 8th grade: 32
- 9th grade: 134
- 10th grade: 117
- 11th grade: 61
- 12th grade, no diploma: 62
- High school graduate (or equivalency): 1,508
- Less than 1 year of college: 229
- Some college more than 1 year, no degree: 645
- Associate degree: 220
- Bachelor's degree: 526
- Master's degree: 309
- Professional school degree: 67
- Doctorate degree: 208

Education attainment for females 25 years and older:
- No schooling: 22
- Nursery to 4th grade: 0
- 5th and 6th grade: 2
- 7th and 8th grade: 35
- 9th grade: 68
- 10th grade: 117
- 11th grade: 101
- 12th grade, no diploma: 168
- High school graduate (or equivalency): 1,587
- Less than 1 year of college: 350
- Some college more than 1 year, no degree: 461
- Associate degree: 541
- Bachelor's degree: 748
- Master's degree: 586
- Professional school degree: 45
- Doctorate degree: 102


Housing units in structures:
- One, detached: 4,111
- One, attached: 452
- Two: 558
- 3 or 4: 488
- 5 to 9: 538
- 10 to 19: 444
- 20 to 49: 280
- 50 or more: 410
- Mobile homes: 601
- Boats, RVs, vans, etc.: 47
Median worth of mobile homes: $24,819
Housing units lacking complete kitchen facilities in 2022: 5.4%
House/condo owner moved in on average 12 years ago
Renter moved in on average 2 years ago

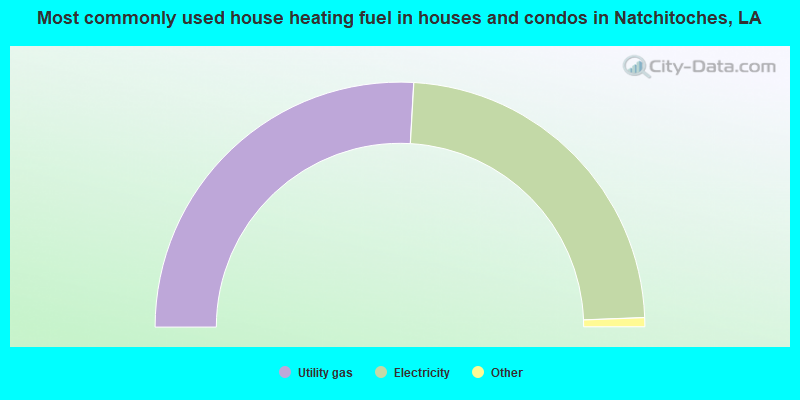
- 51.8%Utility gas
- 47.0%Electricity
- 0.7%No fuel used
- 0.4%Bottled, tank, or LP gas
- 0.1%Wood
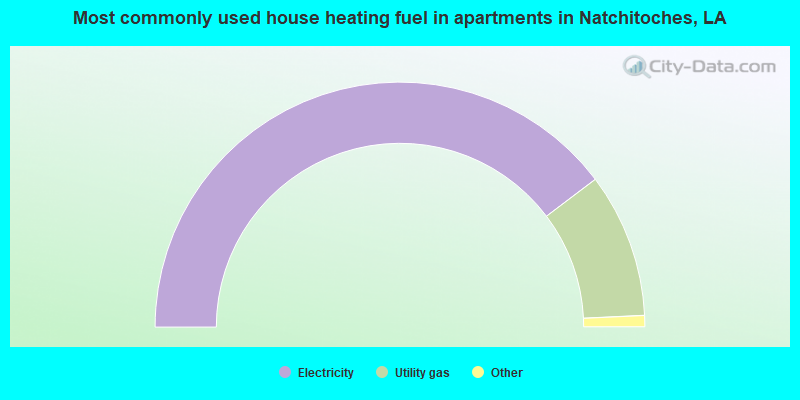
- 79.4%Electricity
- 19.1%Utility gas
- 0.8%Bottled, tank, or LP gas
- 0.7%No fuel used
Private vs. public school enrollment:
| Here: | 18.4% |
| Louisiana: | 19.6% |
| Here: | 13.6% |
| Louisiana: | 18.3% |
| Here: | 5.6% |
| Louisiana: | 17.4% |


