Norris, IL (Illinois) Houses and Residents
| Norris: | $69,766 |
| Illinois: | $251,600 |
Mean price in 2022:
Detached houses: $99,318
Here: $99,318 State: $310,164
Total population: 206 (Urban population: 0, Rural population: 220 (13 farm, 207 nonfarm))
Houses: 103 (91 occupied: 80 owner occupied, 12 renter occupied)
| % of renters here: | 13% |
| State: | 33% |
Housing density: 366 houses/condos per square mile
Median price asked for vacant for-sale houses and condos in 2022 in this county: $42,651.
Median contract rent in 2022: $501 (lower quartile is $473, upper quartile is $540)
Median gross rent in Norris, IL in 2022: $772
Housing units in Norris with a mortgage: 35 (7 second mortgage, 0 home equity loan, 7 both second mortgage and home equity loan)
Houses without a mortgage: 0
Median household income for houses/condos with a mortgage: $55,331
Median household income for apartments without a mortgage: $55,170
Median monthly housing costs: $638
Compare current foreclosures near Norris, IL:
| Photo | Address | Area | Beds / Baths | Price | Details |
|---|---|---|---|---|---|

|
#1
Desutter Rd
Manito, IL 61546
|
1,276 sq. feet
|
1 baths 2 beds |
$74,000
|
show details |

|
#2
S Main St
Canton, IL 61520
|
3,452 sq. feet
|
2 baths 5 beds |
show details | |

|
#3
E Olive St
Canton, IL 61520
|
1,800 sq. feet
|
1 baths 4 beds |
show details | |

|
#4
W Surface Rd
Mapleton, IL 61547
|
1,075 sq. feet
|
1 baths 2 beds |
show details | |

|
#5
W Smithville Rd
Glasford, IL 61533
|
2,176 sq. feet
|
3 baths 3 beds |
show details | |

|
#6
W Main St
Elmwood, IL 61529
|
1,735 sq. feet
|
2 baths 4 beds |
show details | |

|
#7
S Cunningham Rd
Farmington, IL 61531
|
1,232 sq. feet
|
3 baths 2 beds |
show details | |

|
#8
W Butternut St
Elmwood, IL 61529
|
1,680 sq. feet
|
2 baths 2 beds |
show details | |

|
#9
E Maple Ave
Elmwood, IL 61529
|
1,372 sq. feet
|
1 baths 3 beds |
show details | |

|
#10
N 7th Ave
Canton, IL 61520
|
- sq. feet
|
- baths - beds |
$23,900
|
show details |
| Photo | Address | Area | Beds / Baths | Price | Details |
|---|---|---|---|---|---|

|
#11
Bellair Drive
Liverpool, IL 61543
|
616 sq. feet
|
1 baths 2 beds |
show details | |

|
#12
N 2nd St
Hanna City, IL 61536
|
1,144 sq. feet
|
1 baths 3 beds |
show details | |

|
#13
Dean Ct
Canton, IL 61520
|
1,406 sq. feet
|
1 baths 3 beds |
show details | |

|
#14
N Runkle St
Hanna City, IL 61536
|
1,736 sq. feet
|
2 baths 3 beds |
show details | |

|
#15
W Prince Valiant Ct
Mapleton, IL 61547
|
1,392 sq. feet
|
3 baths 3 beds |
show details | |

|
#16
E Essex St
Glasford, IL 61533
|
1,589 sq. feet
|
1 baths 3 beds |
show details | |

|
#17
E 3rd St
Glasford, IL 61533
|
1,080 sq. feet
|
2 baths 3 beds |
show details | |

|
#18
W Clay St
Brimfield, IL 61517
|
1,289 sq. feet
|
1 baths 3 beds |
show details | |

|
#19
S Trivoli Rd
Trivoli, IL 61569
|
2,060 sq. feet
|
1 baths 3 beds |
show details | |

|
#20
N Mcclelland Rd
Elmwood, IL 61529
|
1,907 sq. feet
|
2 baths 3 beds |
show details |
| Photo | Address | Area | Beds / Baths | Price | Details |
|---|---|---|---|---|---|

|
#21
W Farmington Rd
Hanna City, IL 61536
|
1,110 sq. feet
|
2 baths 2 beds |
show details | |

|
#22
W Lake Lancelot Dr
Mapleton, IL 61547
|
2,132 sq. feet
|
2 baths 4 beds |
show details | |

|
#23
N Union St
Yates City, IL 61572
|
1,350 sq. feet
|
- baths 1 beds |
show details | |

|
#24
Grandview Ct
Manito, IL 61546
|
1,008 sq. feet
|
1 baths 3 beds |
show details | |

|
#25
Fulton Pl
Canton, IL 61520
|
- sq. feet
|
1 baths 4 beds |
show details | |

|
#26
Haas Ct
Manito, IL 61546
|
1,020 sq. feet
|
1 baths 2 beds |
show details | |

|
#27
S Knox St
Elmwood, IL 61529
|
2,347 sq. feet
|
2 baths 3 beds |
show details | |

|
#28
S Blackburn Cv
Mapleton, IL 61547
|
1,785 sq. feet
|
1 baths 3 beds |
show details | |

|
#29
N Grange Rd
Brimfield, IL 61517
|
1,314 sq. feet
|
1 baths 3 beds |
show details | |

|
#30
Sunset Dr
Manito, IL 61546
|
768 sq. feet
|
1 baths 1 beds |
show details |
| Photo | Address | Area | Beds / Baths | Price | Details |
|---|---|---|---|---|---|

|
#31
Levee Rd
Manito, IL 61546
|
1,092 sq. feet
|
1 baths 2 beds |
show details | |

|
#32
W Southport Rd
Brimfield, IL 61517
|
1,974 sq. feet
|
1 baths 3 beds |
show details | |

|
#33
E Chestnut St
Canton, IL 61520
|
1,554 sq. feet
|
1 baths 3 beds |
show details | |

|
#34
W Guinivere Ct
Mapleton, IL 61547
|
1,296 sq. feet
|
1 baths 3 beds |
show details | |

|
#35
S Shryock Rd
Glasford, IL 61533
|
792 sq. feet
|
1 baths 1 beds |
show details | |

|
#36
W Jo Dan Ct
Hanna City, IL 61536
|
1,408 sq. feet
|
1 baths 3 beds |
show details | |

|
#37
W Vicki Lynn Dr
Mapleton, IL 61547
|
1,584 sq. feet
|
3 baths 4 beds |
show details | |

|
#38
Cheryl Ct
Glasford, IL 61533
|
977 sq. feet
|
1 baths 2 beds |
show details | |

|
#39
N 6th Ave
Canton, IL 61520
|
- sq. feet
|
2 baths 3 beds |
show details | |

|
#40
N Conn Rd
Hanna City, IL 61536
|
1,848 sq. feet
|
1 baths 3 beds |
show details |
| Photo | Address | Area | Beds / Baths | Price | Details |
|---|---|---|---|---|---|

|
#41
E Myrtle St
Canton, IL 61520
|
- sq. feet
|
1 baths 2 beds |
show details | |

|
#42
Knox Road 2250 E
Yates City, IL 61572
|
1,186 sq. feet
|
- baths - beds |
show details | |

|
#43
State Route 8
Yates City, IL 61572
|
1,560 sq. feet
|
- baths - beds |
show details | |

|
#44
N State Route 97 Hwy
Lewistown, IL 61542
|
- sq. feet
|
1 baths 3 beds |
show details | |

|
#45
S Althea St
Elmwood, IL 61529
|
952 sq. feet
|
1 baths - beds |
show details | |

|
#46
S Magnolia St
Elmwood, IL 61529
|
- sq. feet
|
- baths - beds |
show details | |

|
#47
E Main St
Glasford, IL 61533
|
- sq. feet
|
- baths - beds |
show details | |

|
#48
S Glasford Rd
Glasford, IL 61533
|
- sq. feet
|
- baths - beds |
show details | |

|
#49
W Main St
Glasford, IL 61533
|
- sq. feet
|
- baths - beds |
show details | |

|
Check over 1 million property listings on Foreclosure.com!
|
browse all offers | |||

Latest news about housing in Norris, IL collected exclusively by city-data.com from local newspapers, TV, and radio stations

 | Where can a family live without a car? (49 replies) |
| moving to Canton, IL (8 replies) |
| Questions about Peoria (2 replies) |
| places to work or study open late with wifi, Evanston/Wilmette (5 replies) |
| Some suburb pics (56K BEWARE!) (402 replies) |
| Famous Illinoisans (84 replies) |

Median year apartment built: 1955
Household type by relationship:
Households: 255- Male householders: 60 (17 living alone), Female householders: 29 (12 living alone)
39 spouses (39 opposite-sex spouses), 15 unmarried partners, (15 opposite-sex unmarried partners), 100 children (61 natural, 0 adopted, 39 stepchildren), 7 grandchildren, 0 brothers or sisters, 0 parents, 0 foster children, 0 other relatives, 0 non-relatives
Size of family households: 17 2-persons, 8 3-persons, 5 4-persons, 1 5-persons, 13 6-persons.
Size of nonfamily households: 32 1-person, 15 2-persons.
86 married couples with children.
0 single-parent households (0 men, 0 women).
97.3% of residents of Norris speak English at home.
2.0% of residents speak Spanish at home (100% speak English very well).
| Here: | 5.6 |
| State: | 6.4 |
| Here: | 5.4 |
| State: | 4.1 |

- Bedrooms in owner-occupied houses and condos in Norris, Illinois
- 0no bedroom
- 81 bedroom
- 402 bedrooms
- 253 bedrooms
- 54 bedrooms
- 25+ bedrooms

- Bedrooms in renter-occupied apartments in Norris, Illinois
- 0no bedroom
- 01 bedroom
- 22 bedrooms
- 103 bedrooms
- 04 bedrooms
- 05+ bedrooms

- Cars and other vehicles available in Norris in owner-occupied houses/condos
- 8no vehicle
- 201 vehicle
- 222 vehicles
- 263 vehicles
- 34 vehicles
- 05+ vehicles

- Cars and other vehicles available in Norris in renter-occupied apartments
- 0no vehicle
- 41 vehicle
- 72 vehicles
- 13 vehicles
- 04 vehicles
- 05+ vehicles

- Rooms in owner-occupied houses in Norris, Illinois
- 01 room
- 62 rooms
- 03 rooms
- 174 rooms
- 135 rooms
- 266 rooms
- 97 rooms
- 38 rooms
- 59+ rooms

- Rooms in renter-occupied apartments in Norris, Illinois
- 01 room
- 02 rooms
- 03 rooms
- 04 rooms
- 65 rooms
- 56 rooms
- 17 rooms
- 08 rooms
- 09+ rooms


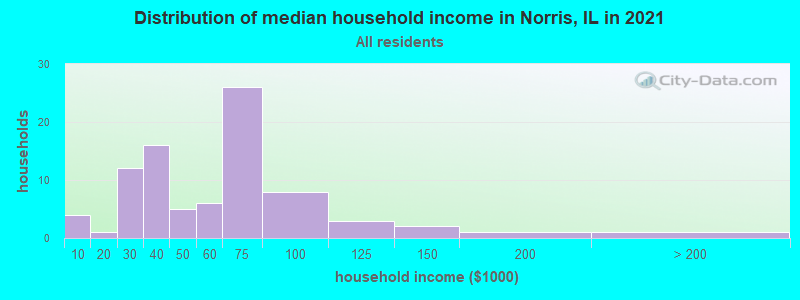
Norris, IL household income distribution

- 1Less than $10,000
- 8$10,000 to $19,999
- 11$20,000 to $29,999
- 7$30,000 to $39,999
- 13$40,000 to $49,999
- 10$50,000 to $59,999
- 19$60,000 to $74,999
- 17$75,000 to $99,999
- 2$100,000 to $124,999
- 2$125,000 to $149,999
- 1$150,000 to $199,999
- 1$200,000 or more
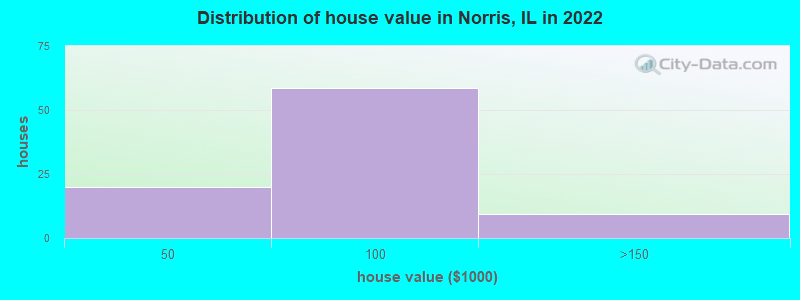
Home value of owner - occupied houses in 2022 in Norris, IL
-
- 0$15,000 to $19,999
- 12$20,000 to $24,999
- 0$30,000 to $34,999
- 5$40,000 to $49,999
- 6$50,000 to $59,999
- 23$60,000 to $69,999
- 14$70,000 to $79,999
- 6$80,000 to $89,999
- 1$90,000 to $99,999
- 6$100,000 to $124,999
- 1$125,000 to $149,999
- 0$200,000 to $249,999
Rent paid by renters in 2022 in Norris, IL
-
- 4$450 to $499
- 4$500 to $549
- 2$800 to $899
- 1No cash rent


Percentage of workers working in this county: 89.2%
Number of people working at home: 5 (4.2% of all workers)
Travel time to work (commute)
- Less than 5 minutes: 6
- 5 to 9 minutes: 26
- 10 to 14 minutes: 53
- 15 to 19 minutes: 10
- 20 to 24 minutes: 0
- 25 to 29 minutes: 0
- 30 to 34 minutes: 4
- 35 to 39 minutes: 1
- 40 to 44 minutes: 5
- 45 to 59 minutes: 2
- 60 to 89 minutes: 0
- 90 or more minutes: 0
Means of transportation to work:
- Drove a car alone: 88 (83.0%)
- Carpooled: 13 (12.3%)
- Walked: 5 (4.7%)

- Unemployment by race in 2022
- Unemployment rate for White non-Hispanic residents
- 25.9%Males

First ancestries reported:
- German: 131 (79.5%)
- English: 9 (5.5%)
- Italian: 7 (4.2%)
- Irish: 6 (3.6%)
- American: 4 (2.4%)
- Polish: 2 (1.2%)
- Swedish: 1 (0.6%)
Place of birth for U.S.-born residents:
- This state: 169
- Other state: 85
- Northeast: 0
- Midwest: 32
- South: 43
- West: 8
96.9% of Norris residents lived in the same house 1 years ago.
Out of people who lived in different houses, 46.7% lived in this county.
Out of people who lived in different counties, 100.0% lived in Illinois.
| Norris: | 96.9% |
| State average: | 88.3% |
Education attainment for males 25 years and older:
- No schooling: 0
- Nursery to 4th grade: 0
- 5th and 6th grade: 0
- 7th and 8th grade: 0
- 9th grade: 2
- 10th grade: 3
- 11th grade: 0
- 12th grade, no diploma: 2
- High school graduate (or equivalency): 39
- Less than 1 year of college: 5
- Some college more than 1 year, no degree: 7
- Associate degree: 5
- Bachelor's degree: 4
- Master's degree: 1
- Professional school degree: 0
- Doctorate degree: 0

Education attainment for females 25 years and older:
- No schooling: 0
- Nursery to 4th grade: 0
- 5th and 6th grade: 0
- 7th and 8th grade: 0
- 9th grade: 0
- 10th grade: 0
- 11th grade: 2
- 12th grade, no diploma: 0
- High school graduate (or equivalency): 43
- Less than 1 year of college: 5
- Some college more than 1 year, no degree: 12
- Associate degree: 6
- Bachelor's degree: 1
- Master's degree: 0
- Professional school degree: 2
- Doctorate degree: 0


Housing units in structures:
- One, detached: 101
- 3 or 4: 1
- Mobile homes: 1
House/condo owner moved in on average 18 years ago
Renter moved in on average 5 years ago

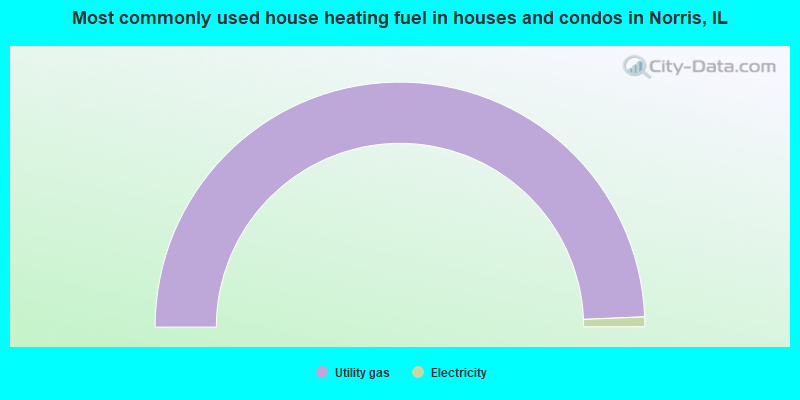
- 98.7%Utility gas
- 1.3%Electricity
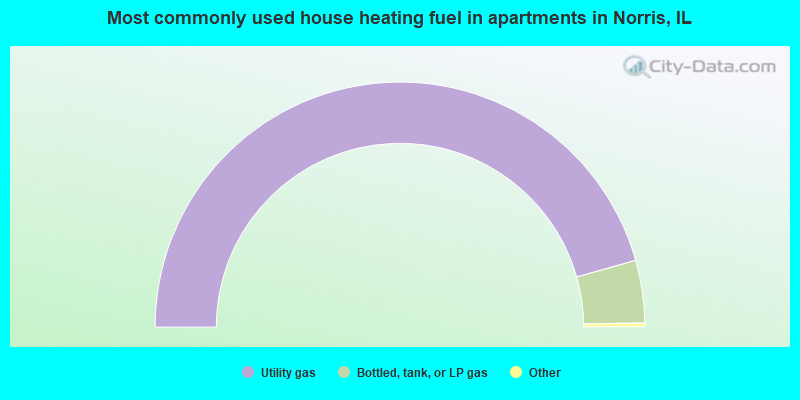
- 91.7%Utility gas
- 8.3%Bottled, tank, or LP gas
Private vs. public school enrollment:
| Here: | 0.0% |
| Illinois: | 13.3% |
| Here: | 0.0% |
| Illinois: | 9.9% |
| Here: | 0.0% |
| Illinois: | 27.4% |


