North East, PA (Pennsylvania) Houses and Residents
| North East: | $154,022 |
| Pennsylvania: | $245,500 |
Total population: 4,197 (All urban)
Houses: 1,885 (1,695 occupied: 875 owner occupied, 844 renter occupied)
| % of renters here: | 49% |
| State: | 31% |
Housing density: 1,440 houses/condos per square mile
Median price asked for vacant for-sale houses and condos in 2022 in this county: $121,180.
Median contract rent in 2022: $550 (lower quartile is $443, upper quartile is $629)
Median rent asked for vacant for-rent units in 2022: $3,930
Median gross rent in North East, PA in 2022: $719
Housing units in North East with a mortgage: 496 (31 second mortgage, 0 home equity loan, 28 both second mortgage and home equity loan)
Houses without a mortgage: 29
Median household income for houses/condos with a mortgage: $90,478
Median monthly housing costs: $758
Compare current foreclosures near North East, PA:
| Photo | Address | Area | Beds / Baths | Price | Details |
|---|---|---|---|---|---|

|
#1
Clinton St
North East, PA 16428
|
1,528 sq. feet
|
1 baths 3 beds |
show details | |

|
#2
S Washington St
North East, PA 16428
|
1,620 sq. feet
|
1 baths 3 beds |
show details | |

|
#3
W Division St
North East, PA 16428
|
1,586 sq. feet
|
1 baths 3 beds |
show details | |

|
#4
Pershing Ave
North East, PA 16428
|
1,942 sq. feet
|
1 baths 4 beds |
show details | |

|
#5
Ashton Rd
North East, PA 16428
|
1,464 sq. feet
|
1 baths 3 beds |
show details | |

|
#6
E Main St
North East, PA 16428
|
1,184 sq. feet
|
1 baths 3 beds |
show details | |

|
#7
Sidehill Rd
North East, PA 16428
|
1,878 sq. feet
|
2 baths 4 beds |
show details | |

|
#8
Robinson St
North East, PA 16428
|
2,778 sq. feet
|
2 baths 4 beds |
show details | |

|
#9
Robinson St
North East, PA 16428
|
1,664 sq. feet
|
1 baths 3 beds |
show details | |

|
#10
Rich Hill Rd
North East, PA 16428
|
1,957 sq. feet
|
1 baths 4 beds |
show details |
| Photo | Address | Area | Beds / Baths | Price | Details |
|---|---|---|---|---|---|

|
#11
Clinton St
North East, PA 16428
|
1,528 sq. feet
|
1 baths 3 beds |
show details | |

|
#12
Kerr Rd
North East, PA 16428
|
1,785 sq. feet
|
1 baths 3 beds |
show details | |

|
#13
S Washington St
North East, PA 16428
|
- sq. feet
|
- baths - beds |
show details | |

|
#14
S Washington St Apt B3
North East, PA 16428
|
- sq. feet
|
- baths - beds |
show details | |

|
#15
E 33rd St
Erie, PA 16504
|
912 sq. feet
|
1 baths 2 beds |
$34,900
|
show details |

|
#16
Longview Ave
Erie, PA 16510
|
960 sq. feet
|
1 baths 3 beds |
show details | |

|
#17
Cascade St
Erie, PA 16502
|
1,452 sq. feet
|
2 baths 3 beds |
show details | |

|
#18
Downing Ave
Erie, PA 16510
|
1,902 sq. feet
|
1 baths 5 beds |
show details | |

|
#19
Bourne St
Westfield, NY 14787
|
1,433 sq. feet
|
2 baths 3 beds |
show details | |

|
#20
Conrad Rd
Erie, PA 16510
|
1,460 sq. feet
|
1 baths 3 beds |
show details |
| Photo | Address | Area | Beds / Baths | Price | Details |
|---|---|---|---|---|---|

|
#21
East Ave
Erie, PA 16504
|
1,261 sq. feet
|
1 baths 2 beds |
show details | |

|
#22
E 19th St
Erie, PA 16503
|
- sq. feet
|
1 baths 4 beds |
show details | |

|
#23
Glenwood Park Ave
Erie, PA 16508
|
1,200 sq. feet
|
1 baths 4 beds |
show details | |

|
#24
Old French Rd
Erie, PA 16509
|
1,788 sq. feet
|
3 baths 5 beds |
show details | |

|
#25
W 37th St
Erie, PA 16508
|
2,304 sq. feet
|
2 baths 3 beds |
show details | |

|
#26
Polk St
Erie, PA 16503
|
504 sq. feet
|
1 baths 2 beds |
show details | |

|
#27
Brown Ave
Erie, PA 16502
|
792 sq. feet
|
1 baths 2 beds |
show details | |

|
#28
Grove St
Westfield, NY 14787
|
1,921 sq. feet
|
1 baths 4 beds |
show details | |

|
#29
E 40th St
Erie, PA 16510
|
1,176 sq. feet
|
1 baths 3 beds |
show details | |

|
#30
Belle Rd
Harborcreek, PA 16421
|
43,560 sq. feet
|
2 baths 3 beds |
show details |
| Photo | Address | Area | Beds / Baths | Price | Details |
|---|---|---|---|---|---|

|
#31
W Main St
Ripley, NY 14775
|
1,785 sq. feet
|
2 baths 3 beds |
show details | |

|
#32
E Lake Rd
Erie, PA 16511
|
1,574 sq. feet
|
1 baths 2 beds |
show details | |

|
#33
Fair Ave
Erie, PA 16511
|
1,704 sq. feet
|
2 baths 4 beds |
show details | |

|
#34
W 32nd St
Erie, PA 16508
|
1,280 sq. feet
|
2 baths 3 beds |
show details | |

|
#35
Goodrich St
Erie, PA 16508
|
1,664 sq. feet
|
1 baths 5 beds |
show details | |

|
#36
Eliot Rd
Erie, PA 16508
|
1,508 sq. feet
|
1 baths 3 beds |
show details | |

|
#37
Bolivar St
Erie, PA 16508
|
1,488 sq. feet
|
1 baths 3 beds |
show details | |

|
#38
Summit St
Erie, PA 16508
|
1,870 sq. feet
|
1 baths 4 beds |
show details | |

|
#39
Old Waterford Rd
Erie, PA 16509
|
1,428 sq. feet
|
2 baths 3 beds |
show details | |

|
#40
W 22nd St
Erie, PA 16502
|
1,956 sq. feet
|
1 baths 4 beds |
show details |
| Photo | Address | Area | Beds / Baths | Price | Details |
|---|---|---|---|---|---|

|
#41
W 29th St
Erie, PA 16508
|
1,254 sq. feet
|
1 baths 3 beds |
show details | |

|
#42
Cochran St
Erie, PA 16508
|
1,328 sq. feet
|
1 baths 3 beds |
show details | |

|
#43
W 23rd St
Erie, PA 16502
|
2,027 sq. feet
|
1 baths 3 beds |
show details | |

|
#44
Stafford Ave
Erie, PA 16508
|
1,440 sq. feet
|
1 baths 3 beds |
show details | |

|
#45
Walnut St
Erie, PA 16507
|
1,412 sq. feet
|
1 baths 3 beds |
show details | |

|
#46
W 29th St
Erie, PA 16508
|
1,808 sq. feet
|
1 baths 3 beds |
show details | |

|
#47
Stafford Ave
Erie, PA 16508
|
1,531 sq. feet
|
1 baths 4 beds |
show details | |

|
#48
Shunpike Rd
Erie, PA 16508
|
1,278 sq. feet
|
1 baths 2 beds |
show details | |

|
#49
W 21st St
Erie, PA 16502
|
1,052 sq. feet
|
1 baths 3 beds |
show details | |

|
Check over 1 million property listings on Foreclosure.com!
|
browse all offers | |||


 | Suburban or Rural homes near PHL with good high school? (20 replies) |
| Thoughts on the aging Pittsburgh workforce? (207 replies) |
| Are all houses in Philadelphia row houses? (52 replies) |
| Affordable "small" towns with beautiful houses and downtowns? (58 replies) |
| Moving to PA... Where would you live (rural areas only) ? (74 replies) |
| Possible move to Pittsburgh (58 replies) |

Median year apartment built: 1959
Household type by relationship:
Households: 4,049- Male householders: 956 (296 living alone), Female householders: 717 (324 living alone)
563 spouses (563 opposite-sex spouses), 372 unmarried partners, (372 opposite-sex unmarried partners), 1,092 children (1,033 natural, 0 adopted, 59 stepchildren), 27 grandchildren, 31 brothers or sisters, 8 parents, 0 foster children, 134 other relatives, 93 non-relatives
- In group quarters: 51
Size of family households: 286 2-persons, 195 3-persons, 227 4-persons, 74 5-persons, 47 6-persons, 27 7-or-more-persons.
Size of nonfamily households: 649 1-person, 198 2-persons, 31 3-persons.
422 married couples with children.
354 single-parent households (189 men, 165 women).
96.7% of residents of North East speak English at home.
0.2% of residents speak Spanish at home (100% speak English very well).
0.8% of residents speak other Indo-European language at home (69% speak English very well, 31% speak English well).
1.9% of residents speak other language at home (100% speak English well).
Foreign born population: 108 (2.7%)
(78.7% of them are naturalized citizens)
| Here: | 7.0 |
| State: | 6.8 |
| Here: | 4.1 |
| State: | 4.3 |

- Bedrooms in owner-occupied houses and condos in North East, Pennsylvania
- 0no bedroom
- 81 bedroom
- 1982 bedrooms
- 4173 bedrooms
- 1404 bedrooms
- 1125+ bedrooms

- Bedrooms in renter-occupied apartments in North East, Pennsylvania
- 0no bedroom
- 3831 bedroom
- 2372 bedrooms
- 2213 bedrooms
- 04 bedrooms
- 45+ bedrooms

- Cars and other vehicles available in North East in owner-occupied houses/condos
- 16no vehicle
- 2711 vehicle
- 3192 vehicles
- 2233 vehicles
- 244 vehicles
- 215+ vehicles

- Cars and other vehicles available in North East in renter-occupied apartments
- 168no vehicle
- 4811 vehicle
- 1662 vehicles
- 303 vehicles
- 04 vehicles
- 05+ vehicles

- Rooms in owner-occupied houses in North East, Pennsylvania
- 01 room
- 02 rooms
- 83 rooms
- 424 rooms
- 875 rooms
- 1706 rooms
- 2857 rooms
- 708 rooms
- 2139+ rooms

- Rooms in renter-occupied apartments in North East, Pennsylvania
- 01 room
- 872 rooms
- 2663 rooms
- 1184 rooms
- 1875 rooms
- 1366 rooms
- 427 rooms
- 88 rooms
- 09+ rooms


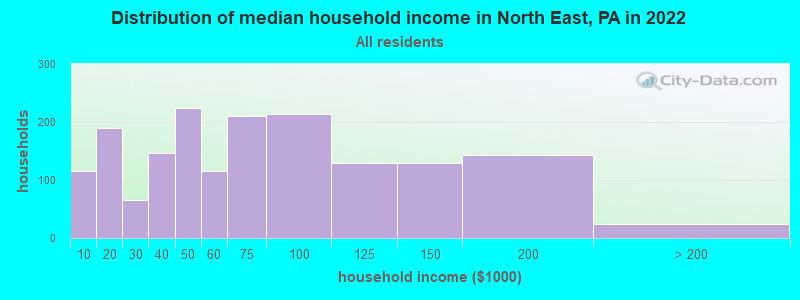
North East, PA household income distribution

- 116Less than $10,000
- 190$10,000 to $19,999
- 66$20,000 to $29,999
- 146$30,000 to $39,999
- 225$40,000 to $49,999
- 116$50,000 to $59,999
- 210$60,000 to $74,999
- 213$75,000 to $99,999
- 130$100,000 to $124,999
- 129$125,000 to $149,999
- 143$150,000 to $199,999
- 24$200,000 or more
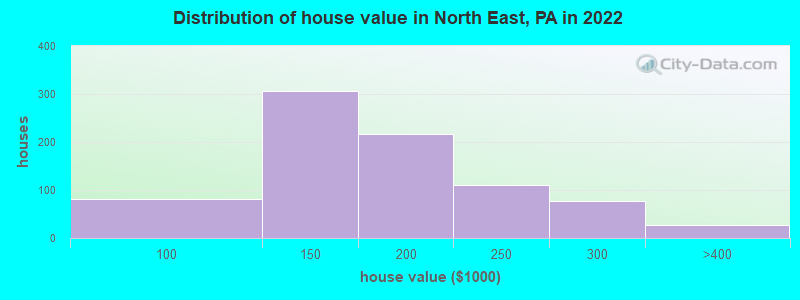
Home value of owner - occupied houses in 2022 in North East, PA
-
- 9$50,000 to $59,999
- 31$70,000 to $79,999
- 9$80,000 to $89,999
- 30$90,000 to $99,999
- 81$100,000 to $124,999
- 225$125,000 to $149,999
- 149$150,000 to $174,999
- 67$175,000 to $199,999
- 110$200,000 to $249,999
- 78$250,000 to $299,999
- 27$300,000 to $399,999
Rent paid by renters in 2022 in North East, PA
-
- 19Less than $100
- 13$150 to $199
- 58$200 to $249
- 33$250 to $299
- 6$300 to $349
- 59$350 to $399
- 30$400 to $449
- 61$450 to $499
- 84$500 to $549
- 181$550 to $599
- 60$600 to $649
- 26$650 to $699
- 17$700 to $749
- 3$750 to $799
- 91$900 to $999
- 3$1,000 to $1,249
- 21$1,500 to $1,999
- 11$2,000 to $2,499
- 21No cash rent


Percentage of workers working in this county: 99.3%
Number of people working at home: 101 (6.7% of all workers)
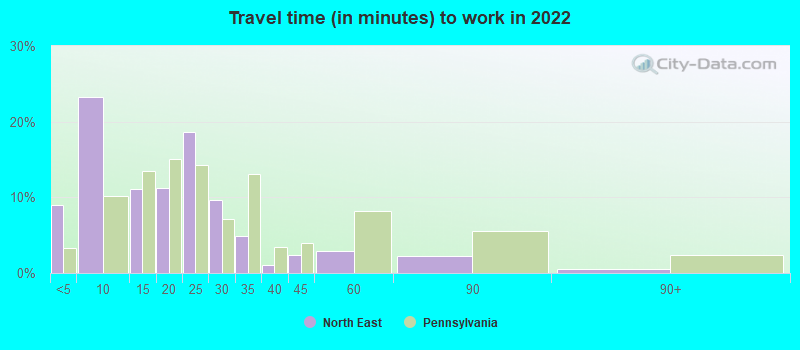
Travel time to work (commute)
- Less than 5 minutes: 130
- 5 to 9 minutes: 249
- 10 to 14 minutes: 75
- 15 to 19 minutes: 296
- 20 to 24 minutes: 109
- 25 to 29 minutes: 154
- 30 to 34 minutes: 252
- 35 to 39 minutes: 78
- 40 to 44 minutes: 6
- 45 to 59 minutes: 54
- 60 to 89 minutes: 8
- 90 or more minutes: 0
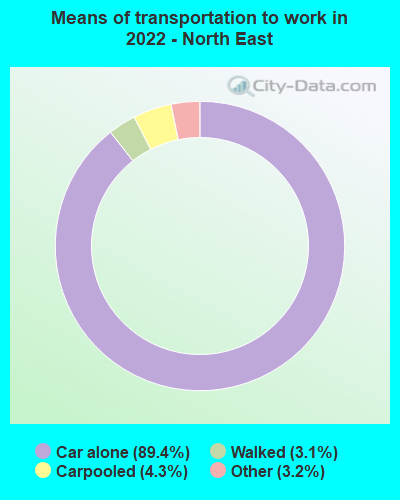
Means of transportation to work:
- Drove a car alone: 1,848 (83.9%)
- Carpooled: 94 (4.3%)
- Taxi: 110 (5.0%)
- Walked: 69 (3.1%)
- Worked at home: 101 (4.6%)

- Unemployment by race in 2022
- Unemployment rate for White non-Hispanic residents
- 2.9%Males
- 6.4%Females
- Unemployment rate for two or more race residents
- 66.1%Males
- 59.0%Females
- Unemployment rate for Hispanic or Latino residents
- 79.3%Males

- Year of entry for the foreign-born population in North East, Pennsylvania
- 102010 or later
- 02000 to 2009
- 611990 to 1999
- 01980 to 1989
- 41970 to 1979
- 22Before 1970

First ancestries reported:
- Polish: 283 (19.3%)
- German: 137 (9.4%)
- Irish: 128 (8.7%)
- English: 120 (8.2%)
- Italian: 100 (6.8%)
- American: 93 (6.3%)
- European: 67 (4.6%)
- Iraqi: 51 (3.5%)
- Brazilian: 44 (3.0%)
- Swedish: 33 (2.3%)
- Slovak: 25 (1.7%)
- Scotch-Irish: 22 (1.5%)
- Czech: 17 (1.2%)
- French Canadian: 12 (0.8%)
- Pennsylvania German: 10 (0.7%)
- Scottish: 10 (0.7%)
- Lebanese: 9 (0.6%)
Most common places of birth for foreign-born residents (%):
| North East: | 59.8% (67) |
| Pennsylvania: | 0.3% (2,395) |
| North East: | 18.8% (21) |
| Pennsylvania: | 1.8% (17,032) |
| North East: | 15.2% (17) |
| Pennsylvania: | 1.4% (13,077) |
| North East: | 7.1% (8) |
| Pennsylvania: | 1.9% (18,065) |
Place of birth for U.S.-born residents:
- This state: 3,026
- Other state: 902
- Northeast: 406
- Midwest: 268
- South: 151
- West: 63
90.6% of North East residents lived in the same house 1 years ago.
Out of people who lived in different houses, 42.4% lived in this county.
Out of people who lived in different counties, 14.1% lived in Pennsylvania.
| North East: | 90.6% |
| State average: | 89.3% |
Education attainment for males 25 years and older:
- No schooling: 0
- Nursery to 4th grade: 0
- 5th and 6th grade: 0
- 7th and 8th grade: 21
- 9th grade: 38
- 10th grade: 90
- 11th grade: 24
- 12th grade, no diploma: 0
- High school graduate (or equivalency): 569
- Less than 1 year of college: 89
- Some college more than 1 year, no degree: 137
- Associate degree: 178
- Bachelor's degree: 219
- Master's degree: 20
- Professional school degree: 21
- Doctorate degree: 0

Education attainment for females 25 years and older:
- No schooling: 2
- Nursery to 4th grade: 0
- 5th and 6th grade: 0
- 7th and 8th grade: 10
- 9th grade: 41
- 10th grade: 25
- 11th grade: 33
- 12th grade, no diploma: 8
- High school graduate (or equivalency): 532
- Less than 1 year of college: 43
- Some college more than 1 year, no degree: 146
- Associate degree: 158
- Bachelor's degree: 248
- Master's degree: 122
- Professional school degree: 29
- Doctorate degree: 18


Housing units in structures:
- One, detached: 1,082
- One, attached: 20
- Two: 437
- 3 or 4: 154
- 5 to 9: 72
- 20 to 49: 104
- 50 or more: 14
House/condo owner moved in on average 23 years ago
Renter moved in on average 5 years ago

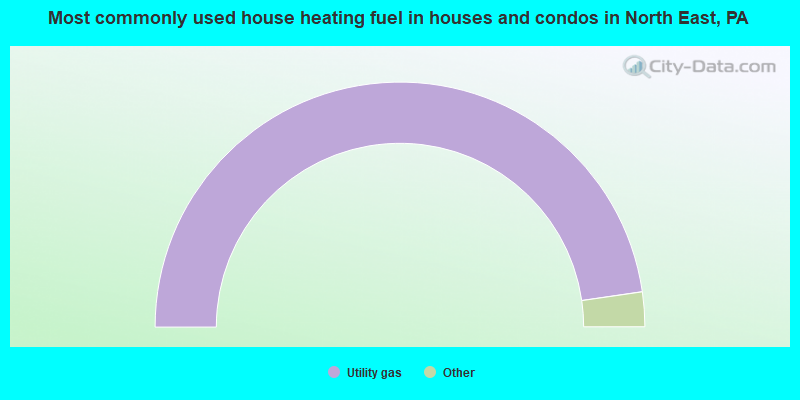
- 95.5%Utility gas
- 1.4%Bottled, tank, or LP gas
- 1.4%Electricity
- 1.0%Fuel oil, kerosene, etc.
- 0.7%Other fuel
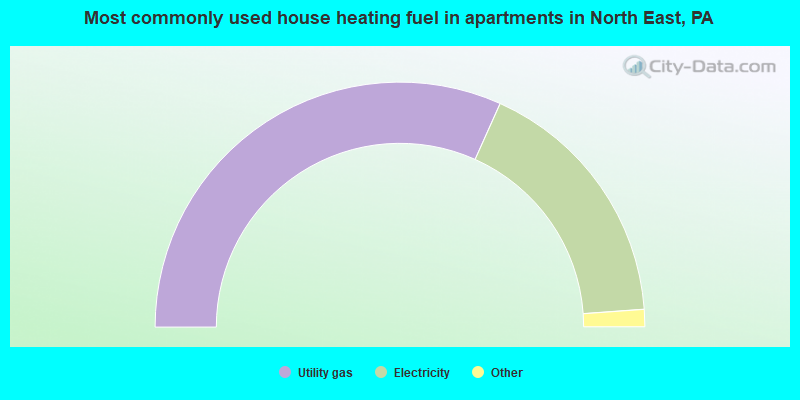
- 63.5%Utility gas
- 34.3%Electricity
- 1.2%Bottled, tank, or LP gas
- 1.0%Other fuel
Private vs. public school enrollment:
| Here: | 0.0% |
| Pennsylvania: | 15.7% |
| Here: | 0.0% |
| Pennsylvania: | 13.4% |
| Here: | 20.8% |
| Pennsylvania: | 39.8% |


