Ogdensburg, NY (New York) Houses and Residents
| Ogdensburg: | $86,687 |
| New York: | $400,400 |
Mean price in 2022:
Detached houses: $101,257
Here: $101,257 State: $476,719 Townhouses or other attached units: $518,374
Here: $518,374 State: $699,270 In 2-unit structures: $212,389
Here: $212,389 State: $713,077 In 3-to-4-unit structures: $212,874
Here: $212,874 State: $764,568 In 5-or-more-unit structures: $2,838,481
Here: $2,838,481 State: $912,009 Mobile homes: $54,085
Here: $54,085 State: $88,925
Total population: 10,895 (All urban)
Houses: 4,229 (3,964 occupied: 2,689 owner occupied, 1,306 renter occupied)
| % of renters here: | 33% |
| State: | 46% |
Housing density: 835 houses/condos per square mile
Median price asked for vacant for-sale houses and condos in 2022: $204,709.
Median contract rent in 2022: $636 (lower quartile is $397, upper quartile is $703)
Median rent asked for vacant for-rent units in 2022: $1,174
Median gross rent in Ogdensburg, NY in 2022: $741
Housing units in Ogdensburg with a mortgage: 1,356 (81 second mortgage, 0 home equity loan, 51 both second mortgage and home equity loan)
Houses without a mortgage: 31
Median household income for houses/condos with a mortgage: $79,547
Median household income for apartments without a mortgage: $67,148
Median monthly housing costs: $742
Compare current foreclosures near Ogdensburg, NY:
| Photo | Address | Area | Beds / Baths | Price | Details |
|---|---|---|---|---|---|

|
#1
Montgomery St
Ogdensburg, NY 13669
|
1,974 sq. feet
|
2 baths 3 beds |
show details | |

|
#2
State St
Ogdensburg, NY 13669
|
4,066 sq. feet
|
3 baths 6 beds |
show details | |

|
#3
County Route 4
Ogdensburg, NY 13669
|
1,232 sq. feet
|
2 baths 3 beds |
show details | |

|
#4
Elizabeth St
Ogdensburg, NY 13669
|
2,456 sq. feet
|
2 baths 4 beds |
show details | |

|
#5
Rosseel St
Ogdensburg, NY 13669
|
1,656 sq. feet
|
1 baths 3 beds |
show details | |

|
#6
Gilbert St
Ogdensburg, NY 13669
|
783 sq. feet
|
1 baths 2 beds |
show details | |

|
#7
Pleasant Ave
Ogdensburg, NY 13669
|
1,459 sq. feet
|
1 baths 3 beds |
show details | |

|
#8
Academy Pl
Ogdensburg, NY 13669
|
1,404 sq. feet
|
1 baths 2 beds |
show details | |

|
#9
Harrison Ave
Ogdensburg, NY 13669
|
1,410 sq. feet
|
1 baths 3 beds |
show details | |

|
#10
Cemetary Rd
Ogdensburg, NY 13669
|
- sq. feet
|
3 baths 3 beds |
show details |
| Photo | Address | Area | Beds / Baths | Price | Details |
|---|---|---|---|---|---|

|
#11
Knox St
Ogdensburg, NY 13669
|
5,096 sq. feet
|
- baths - beds |
show details | |

|
#12
State Highway 37
Ogdensburg, NY 13669
|
- sq. feet
|
- baths - beds |
show details | |

|
#13
Haggert Rd
Ogdensburg, NY 13669
|
- sq. feet
|
- baths - beds |
show details | |

|
#14
State Highway 37
Ogdensburg, NY 13669
|
1,456 sq. feet
|
- baths - beds |
show details | |

|
#15
Washington St
Ogdensburg, NY 13669
|
- sq. feet
|
- baths - beds |
show details | |

|
#16
Lisbon St
Heuvelton, NY 13654
|
1,694 sq. feet
|
6 baths 4 beds |
show details | |

|
#17
W Lake Rd
Heuvelton, NY 13654
|
114 sq. feet
|
1 baths 2 beds |
show details | |

|
#18
Front St
Rensselaer Falls, NY 13680
|
1,159 sq. feet
|
1 baths 4 beds |
show details | |

|
#19
Judson St
Canton, NY 13617
|
1,532 sq. feet
|
2 baths 3 beds |
show details | |

|
#20
Kelly Rd
Rensselaer Falls, NY 13680
|
2,270 sq. feet
|
1 baths 4 beds |
show details |
| Photo | Address | Area | Beds / Baths | Price | Details |
|---|---|---|---|---|---|

|
#21
Cold Springs Rd
Lisbon, NY 13658
|
1,470 sq. feet
|
1 baths 4 beds |
show details | |

|
#22
Goodrich St
Canton, NY 13617
|
2,854 sq. feet
|
1 baths 4 beds |
show details | |

|
#23
Randall Rd
Lisbon, NY 13658
|
- sq. feet
|
- baths - beds |
show details | |

|
#24
County Route 10
De Peyster, NY 13633
|
780 sq. feet
|
- baths - beds |
show details | |

|
#25
County Route 17
De Kalb Junction, NY 13630
|
- sq. feet
|
- baths - beds |
show details | |

|
Check over 1 million property listings on Foreclosure.com!
|
browse all offers | |||

Latest news about housing in Ogdensburg, NY collected exclusively by city-data.com from local newspapers, TV, and radio stations


Median year apartment built: 1961
Household type by relationship:
Households: 9,816- Male householders: 1,861 (680 living alone), Female householders: 2,052 (642 living alone)
1,181 spouses (1,171 opposite-sex spouses), 450 unmarried partners, (426 opposite-sex unmarried partners), 2,304 children (2,076 natural, 37 adopted, 190 stepchildren), 164 grandchildren, 51 brothers or sisters, 23 parents, 73 foster children, 58 other relatives, 159 non-relatives
- In group quarters: 1,434
Size of family households: 1,296 2-persons, 489 3-persons, 249 4-persons, 314 5-persons, 44 6-persons, 8 7-or-more-persons.
Size of nonfamily households: 1,290 1-person, 302 2-persons, 4 3-persons, 11 4-persons.
748 married couples with children.
944 single-parent households (389 men, 555 women).
95.6% of residents of Ogdensburg speak English at home.
2.1% of residents speak Spanish at home (55% speak English very well, 29% speak English well, 6% speak English not well, 10% don't speak English at all).
1.7% of residents speak other Indo-European language at home (74% speak English very well, 20% speak English well, 6% speak English not well).
0.3% of residents speak Asian or Pacific Island language at home (31% speak English very well, 59% speak English well, 9% don't speak English at all).
Foreign born population: 424 (4.3%)
(41.0% of them are naturalized citizens)
| Here: | 7.1 |
| State: | 6.3 |
| Here: | 4.6 |
| State: | 3.8 |

- Bedrooms in owner-occupied houses and condos in Ogdensburg, New York
- 0no bedroom
- 451 bedroom
- 5902 bedrooms
- 1,3013 bedrooms
- 6324 bedrooms
- 1225+ bedrooms

- Bedrooms in renter-occupied apartments in Ogdensburg, New York
- 45no bedroom
- 5041 bedroom
- 4502 bedrooms
- 2263 bedrooms
- 754 bedrooms
- 75+ bedrooms

- Cars and other vehicles available in Ogdensburg in owner-occupied houses/condos
- 160no vehicle
- 8411 vehicle
- 1,3022 vehicles
- 3233 vehicles
- 644 vehicles
- 05+ vehicles

- Cars and other vehicles available in Ogdensburg in renter-occupied apartments
- 530no vehicle
- 6251 vehicle
- 1282 vehicles
- 243 vehicles
- 04 vehicles
- 05+ vehicles

- Rooms in owner-occupied houses in Ogdensburg, New York
- 01 room
- 02 rooms
- 573 rooms
- 1704 rooms
- 3495 rooms
- 4646 rooms
- 6717 rooms
- 4468 rooms
- 5329+ rooms

- Rooms in renter-occupied apartments in Ogdensburg, New York
- 451 room
- 342 rooms
- 4313 rooms
- 1774 rooms
- 2565 rooms
- 1296 rooms
- 1577 rooms
- 508 rooms
- 289+ rooms


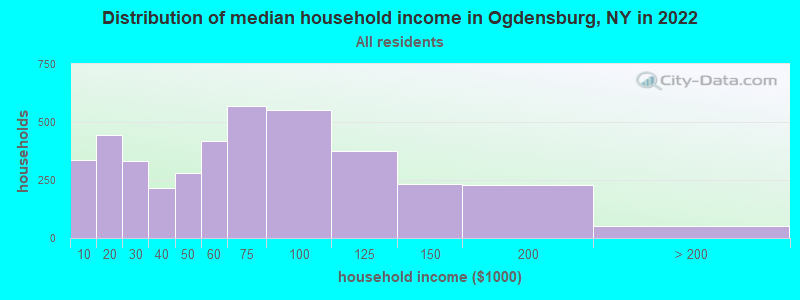
Ogdensburg, NY household income distribution

- 335Less than $10,000
- 445$10,000 to $19,999
- 333$20,000 to $29,999
- 215$30,000 to $39,999
- 279$40,000 to $49,999
- 419$50,000 to $59,999
- 568$60,000 to $74,999
- 551$75,000 to $99,999
- 373$100,000 to $124,999
- 231$125,000 to $149,999
- 229$150,000 to $199,999
- 50$200,000 or more
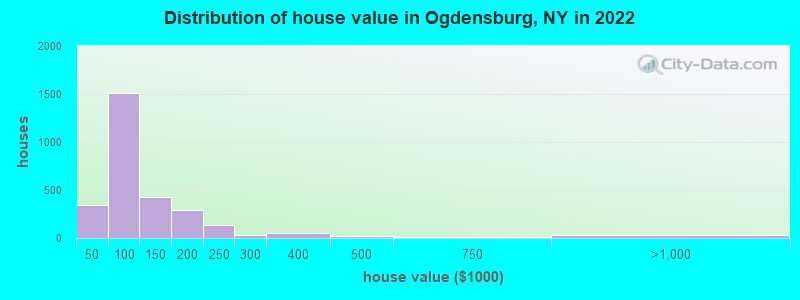
Home value of owner - occupied houses in 2022 in Ogdensburg, NY
-
- 126$10,000 to $14,999
- 11$25,000 to $29,999
- 27$30,000 to $34,999
- 59$35,000 to $39,999
- 117$40,000 to $49,999
- 313$50,000 to $59,999
- 175$60,000 to $69,999
- 419$70,000 to $79,999
- 368$80,000 to $89,999
- 119$90,000 to $99,999
- 286$100,000 to $124,999
- 142$125,000 to $149,999
- 270$150,000 to $174,999
- 17$175,000 to $199,999
- 133$200,000 to $249,999
- 36$250,000 to $299,999
- 51$300,000 to $399,999
- 25$400,000 to $499,999
- 14$500,000 to $749,999
- 14$750,000 to $999,999
- 10$1,000,000 to $1,499,999
- 7$1,500,000 to $1,999,999
Rent paid by renters in 2022 in Ogdensburg, NY
-
- 10$200 to $249
- 79$250 to $299
- 166$300 to $349
- 5$350 to $399
- 46$400 to $449
- 17$450 to $499
- 41$500 to $549
- 50$550 to $599
- 115$600 to $649
- 253$650 to $699
- 85$700 to $749
- 92$750 to $799
- 64$800 to $899
- 26$900 to $999
- 22$1,000 to $1,249
- 1$1,250 to $1,499
- 9$1,500 to $1,999
- 9$2,000 to $2,499
- 125No cash rent


Percentage of workers working in this county: 97.1%
Number of people working at home: 148 (4.2% of all workers)
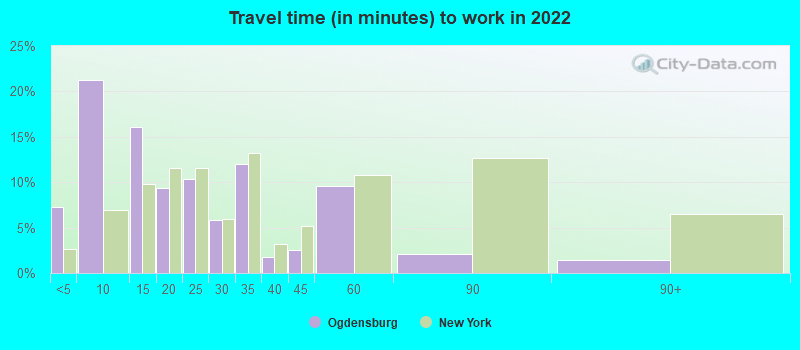
Travel time to work (commute)
- Less than 5 minutes: 433
- 5 to 9 minutes: 983
- 10 to 14 minutes: 499
- 15 to 19 minutes: 212
- 20 to 24 minutes: 152
- 25 to 29 minutes: 205
- 30 to 34 minutes: 215
- 35 to 39 minutes: 19
- 40 to 44 minutes: 126
- 45 to 59 minutes: 192
- 60 to 89 minutes: 51
- 90 or more minutes: 47
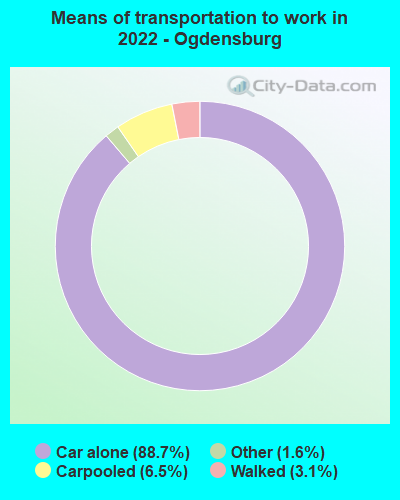
Means of transportation to work:
- Drove a car alone: 4,554 (84.4%)
- Carpooled: 355 (6.6%)
- Taxi: 101 (1.9%)
- Bicycle: 3 (0.1%)
- Walked: 163 (3.0%)
- Worked at home: 148 (2.7%)

- Unemployment by race in 2022
- Unemployment rate for White non-Hispanic residents
- 7.3%Males
- 5.4%Females
- Unemployment rate for other race residents
- 90.6%Males
- Unemployment rate for Hispanic or Latino residents
- 44.4%Males

- Year of entry for the foreign-born population in Ogdensburg, New York
- 2052010 or later
- 962000 to 2009
- 61990 to 1999
- 2131980 to 1989
- 871970 to 1979
- 191Before 1970

First ancestries reported:
- American: 701 (18.4%)
- Irish: 358 (9.4%)
- English: 321 (8.4%)
- French Canadian: 281 (7.4%)
- French: 269 (7.1%)
- Italian: 214 (5.6%)
- European: 136 (3.6%)
- Jamaican: 103 (2.7%)
- Scottish: 84 (2.2%)
- Polish: 75 (2.0%)
- German: 65 (1.7%)
- Canadian: 23 (0.6%)
- Scotch-Irish: 20 (0.5%)
- Armenian: 19 (0.5%)
- Scandinavian: 19 (0.5%)
- Nigerian: 18 (0.5%)
- Dutch: 12 (0.3%)
- Portuguese: 12 (0.3%)
- Danish: 9 (0.2%)
- Eastern European: 9 (0.2%)
- Swiss: 7 (0.2%)
- Ghanaian: 2 (0.05%)
- Ethiopian: 1 (0.03%)
Most common places of birth for foreign-born residents (%):
| Ogdensburg: | 28.2% (109) |
| New York: | 5.0% (227,557) |
| Ogdensburg: | 12.7% (49) |
| New York: | 1.3% (59,107) |
| Ogdensburg: | 10.4% (40) |
| New York: | 2.5% (111,920) |
| Ogdensburg: | 7.3% (28) |
| New York: | 1.8% (82,786) |
| Ogdensburg: | 4.9% (19) |
| New York: | 0.7% (33,746) |
| Ogdensburg: | 4.4% (17) |
| New York: | 4.8% (214,559) |
| Ogdensburg: | 3.9% (15) |
| New York: | 11.1% (501,040) |
| Ogdensburg: | 3.6% (14) |
| New York: | 1.7% (78,421) |
| Ogdensburg: | 3.6% (14) |
| New York: | 1.4% (61,245) |
| Ogdensburg: | 3.1% (12) |
| New York: | 9.1% (410,910) |
| Ogdensburg: | 3.1% (12) |
| New York: | 0.6% (27,385) |
| Ogdensburg: | 2.8% (11) |
| New York: | 1.4% (65,102) |
| Ogdensburg: | 2.6% (10) |
| New York: | 0.9% (42,220) |
| Ogdensburg: | 2.3% (9) |
| New York: | 3.9% (177,448) |
| Ogdensburg: | 2.1% (8) |
| New York: | 0.3% (14,037) |
Place of birth for U.S.-born residents:
- This state: 8,142
- Other state: 1,064
- Northeast: 525
- Midwest: 115
- South: 219
- West: 199
87.2% of Ogdensburg residents lived in the same house 1 years ago.
Out of people who lived in different houses, 41.9% lived in this county.
Out of people who lived in different counties, 91.1% lived in New York.
| Ogdensburg: | 87.2% |
| State average: | 89.6% |
Education attainment for males 25 years and older:
- No schooling: 141
- Nursery to 4th grade: 8
- 5th and 6th grade: 0
- 7th and 8th grade: 168
- 9th grade: 29
- 10th grade: 249
- 11th grade: 283
- 12th grade, no diploma: 58
- High school graduate (or equivalency): 1,693
- Less than 1 year of college: 215
- Some college more than 1 year, no degree: 373
- Associate degree: 351
- Bachelor's degree: 305
- Master's degree: 231
- Professional school degree: 0
- Doctorate degree: 14

Education attainment for females 25 years and older:
- No schooling: 28
- Nursery to 4th grade: 0
- 5th and 6th grade: 16
- 7th and 8th grade: 39
- 9th grade: 18
- 10th grade: 69
- 11th grade: 119
- 12th grade, no diploma: 7
- High school graduate (or equivalency): 916
- Less than 1 year of college: 367
- Some college more than 1 year, no degree: 349
- Associate degree: 607
- Bachelor's degree: 376
- Master's degree: 241
- Professional school degree: 13
- Doctorate degree: 1


Housing units in structures:
- One, detached: 3,055
- One, attached: 63
- Two: 158
- 3 or 4: 321
- 5 to 9: 98
- 10 to 19: 20
- 50 or more: 424
- Mobile homes: 87
Median worth of mobile homes: $55,400
Housing units lacking complete kitchen facilities in 2022: 1.4%
House/condo owner moved in on average 18 years ago
Renter moved in on average 3 years ago

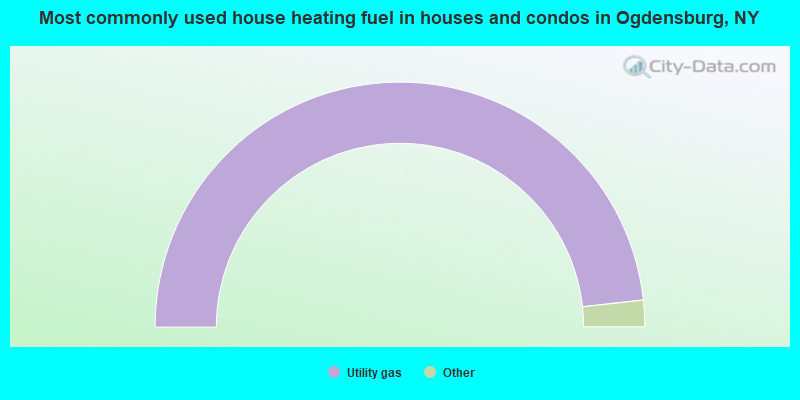
- 96.5%Utility gas
- 1.5%Wood
- 1.0%Electricity
- 0.6%Fuel oil, kerosene, etc.
- 0.3%Bottled, tank, or LP gas
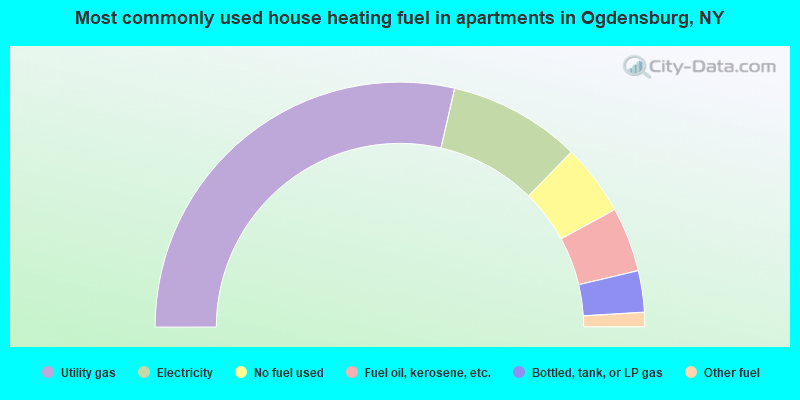
- 57.2%Utility gas
- 17.5%Electricity
- 9.4%No fuel used
- 8.5%Fuel oil, kerosene, etc.
- 5.5%Bottled, tank, or LP gas
- 1.9%Other fuel
Private vs. public school enrollment:
| Here: | 5.9% |
| New York: | 15.6% |
| Here: | 15.3% |
| New York: | 15.0% |
| Here: | 4.4% |
| New York: | 39.2% |


