Omaha, NE (Nebraska) Houses and Residents
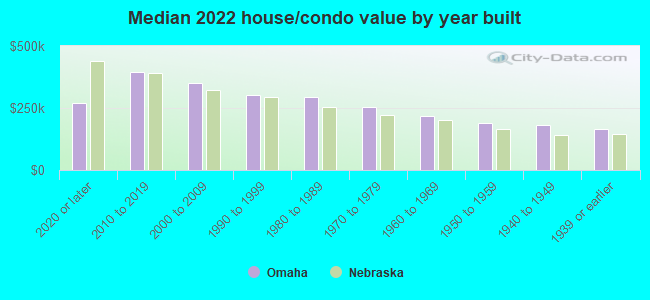
Estimated median house or condo value in 2022: $243,800 (it was $93,300 in 2000 )
Omaha:
$243,800Nebraska:
$232,400
Lower value quartile - upper value quartile: $170,100 - $353,300Mean price in 2022: Detached houses: $276,537 Here:
$276,537State:
$274,677
Townhouses or other attached units: $216,938 Here:
$216,938State:
$245,619
In 2-unit structures: $189,152 Here:
$189,152State:
$168,724
In 3-to-4-unit structures: $177,180 Here:
$177,180State:
$405,971
In 5-or-more-unit structures: $468,541 Here:
$468,541State:
$476,911
Mobile homes: $46,743 Here:
$46,743State:
$67,339
Total population: 446,599 (Urban population: 390,001, Rural population: 111 (all nonfarm) )
Houses: 214,669 (203,273 occupied: 115,012 owner occupied, 88,261 renter occupied )
% of renters here:
43%State:
34%
Housing density: 1,855 houses/condos per square mile
Median price asked for vacant for-sale houses and condos in 2022: $123,553.
Median contract rent in 2022: $931 (lower quartile is $742, upper quartile is $1,189)
Median rent asked for vacant for-rent units in 2022: $1,165
Median gross rent in Omaha, NE in 2022: $1,105
Housing units in Omaha with a mortgage: 74,433 (6,756 second mortgage, 0 home equity loan, 4,898 both second mortgage and home equity loan )Houses without a mortgage: 1,729
Median household income for houses/condos with a mortgage: $107,646
Median household income for apartments without a mortgage: $82,722
Median monthly housing costs: $1,188
Data:
Median house or condo value ($)
Median house or condo value ($ change since 2000)
Median house or condo value ($) - White
Median house or condo value ($) - Black or African American
Median house or condo value ($) - Asian
Median house or condo value ($) - Hispanic or Latino
Median house or condo value ($) - American Indian and Alaska Native
Median house or condo value ($) - Multirace
Median house or condo value ($) - Other Race
Median price asked for mobile homes ($)
Household density (households per square mile)
Mean house or condo value by units in structure - 1, detached ($)
Mean house or condo value by units in structure - 1, attached ($)
Mean house or condo value by units in structure - 2 ($)
Mean house or condo value by units in structure by units in structure - 3 or 4 ($)
Mean house or condo value by units in structure - 5 or more ($)
Mean house or condo value by units in structure - Boat, RV, van, etc. ($)
Mean house or condo value by units in structure - Mobile home ($)
Median contract rent ($)
Median contract rent - Lower quartile ($)
Median contract rent - Upper quartile ($)
Median gross rent ($)
Urban houses (%)
Rural houses (%)
Houses occupied (%)
Houses occupied (% change since 2000)
Houses owner occupied (%)
Houses owner occupied (% change since 2000)
Houses renter occupied (%)
Houses renter occupied (% change since 2000)
Vacant housing units - For rent (%)
Vacant housing units - For rent (% change since 2000)
Vacant housing units - For sale only (%)
Vacant housing units - For sale only (% change since 2000)
Vacant housing units - Rented or sold, not occupied (%)
Vacant housing units - Rented or sold, not occupied (% change since 2000)
Vacant housing units - For seasonal, recreational, or occasional use (%)
Vacant housing units - For seasonal, recreational, or occasional use (% change since 2000)
Vacant housing units - For migrant workers (%)
Vacant housing units - For migrant workers (% change since 2000)
Vacant housing units - Other vacant (%)
Vacant housing units - Other vacant (% change since 2000)
Median monthly housing costs ($)
Median household income for houses/condos with a mortgage ($)
Median household income for houses/condos without a mortgage ($)
Median household income ($)
Median household income ($) - White
Median household income ($) - Black or African American
Median household income ($) - Asian
Median household income ($) - Hispanic or Latino
Median household income ($) - American Indian and Alaska Native
Median household income ($) - Multirace
Median household income ($) - Other Race
Mortgage status - with mortgage (%)
Mortgage status - with second mortgage (%)
Mortgage status - with home equity loan (%)
Mortgage status - with both second mortgage and home equity loan (%)
Mortgage status - without a mortgage (%)
Median year house/condo built
Median year apartment built
Household type by relationship - Male householder living alone (%)
Household type by relationship - Male householder not living alone (%)
Household type by relationship - Female householder living alone (%)
Household type by relationship - Female householder not living alone (%)
Household type by relationship - Opposite-Sex spouse (%)
Household type by relationship - Same-Sex spouse (%)
Household type by relationship - Opposite-Sex unmarried partner (%)
Household type by relationship - Same-Sex unmarried partner (%)
Household type by relationship - In group quarters (%)
Size of family households - 2-person household (%)
Size of family households - 3-person household (%)
Size of family households - 4-person household (%)
Size of family households - 5-person household (%)
Size of family households - 6-person household (%)
Size of family households - 7-or-more-person household (%)
Size of nonfamily households - 1-person household (%)
Size of nonfamily households - 2-person household (%)
Size of nonfamily households - 3-person household (%)
Size of nonfamily households - 4-person household (%)
Size of nonfamily households - 5-person household (%)
Size of nonfamily households - 6-person household (%)
Size of nonfamily households - 7-or-moreperson household (%)
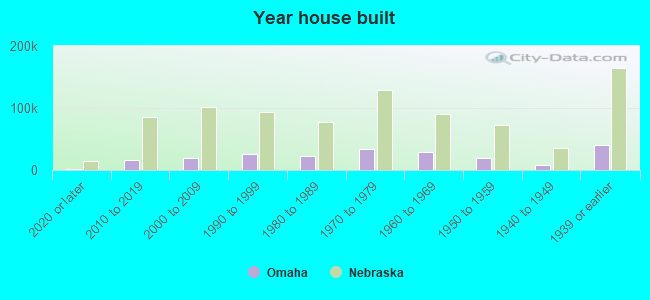
Year house built - Built 2010 or later (%)
Year house built - Built 2000 to 2009 (%)
Year house built - Built 1990 to 1999 (%)
Year house built - Built 1980 to 1989 (%)
Year house built - Built 1970 to 1979 (%)
Year house built - Built 1960 to 1969 (%)
Year house built - Built 1950 to 1959 (%)
Year house built - Built 1940 to 1949 (%)
Year house built - Built 1939 or earlier (%)
Median number of rooms in houses and condos
Median number of rooms in apartments
Median number of bedrooms in owner occupied houses
Mean number of bedrooms in owner occupied houses
Median number of bedrooms in renter occupied houses
Mean number of bedrooms in renter occupied houses
Median number of vehichles in owner occupied houses
Mean number of vehichles in owner occupied houses
Median number of vehichles in renter occupied houses
Mean number of vehichles in renter occupied houses
Rooms in owner-occupied houses - 1 room (%)
Rooms in owner-occupied houses - 2 rooms (%)
Rooms in owner-occupied houses - 3 rooms (%)
Rooms in owner-occupied houses - 4 rooms (%)
Rooms in owner-occupied houses - 5 rooms (%)
Rooms in owner-occupied houses - 6 rooms (%)
Rooms in owner-occupied houses - 7 rooms (%)
Rooms in owner-occupied houses - 8 rooms (%)
Rooms in owner-occupied houses - 9+ rooms (%)
Rooms in renter-occupied houses - 1 room (%)
Rooms in renter-occupied houses - 2 rooms (%)
Rooms in renter-occupied houses - 3 rooms (%)
Rooms in renter-occupied houses - 4 rooms (%)
Rooms in renter-occupied houses - 5 rooms (%)
Rooms in renter-occupied houses - 6 rooms (%)
Rooms in renter-occupied houses - 7 rooms (%)
Rooms in renter-occupied houses - 8 rooms (%)
Rooms in renter-occupied houses - 9+ rooms (%)
Bedrooms in owner-occupied houses - no bedrooms (%)
Bedrooms in owner-occupied houses - 1 bedroom (%)
Bedrooms in owner-occupied houses - 2 bedrooms (%)
Bedrooms in owner-occupied houses - 3 bedrooms (%)
Bedrooms in owner-occupied houses - 4 bedrooms (%)
Bedrooms in owner-occupied houses - 5+ bedrooms (%)
Bedrooms in renter-occupied houses - no bedrooms (%)
Bedrooms in renter-occupied houses - 1 bedroom (%)
Bedrooms in renter-occupied houses - 2 bedrooms (%)
Bedrooms in renter-occupied houses - 3 bedrooms (%)
Bedrooms in renter-occupied houses - 4 bedrooms (%)
Bedrooms in renter-occupied houses - 5+ bedrooms (%)
Vehicles available in owner-occupied houses - no vehicle available (%)
Vehicles available in owner-occupied houses - 1 vehicle available(%)
Vehicles available in owner-occupied houses - 2 Vehicles available (%)
Vehicles available in owner-occupied houses - 3 Vehicles available (%)
Vehicles available in owner-occupied houses - 4 Vehicles available (%)
Vehicles available in owner-occupied houses - 5+ Vehicles available (%)
Vehicles available in renter-occupied houses - no vehicle available (%)
Vehicles available in renter-occupied houses - 1 vehicle available (%)
Vehicles available in renter-occupied houses - 2 Vehicles available (%)
Vehicles available in renter-occupied houses - 3 Vehicles available (%)
Vehicles available in renter-occupied houses - 4 Vehicles available (%)
Vehicles available in renter-occupied houses - 5+ Vehicles available (%)
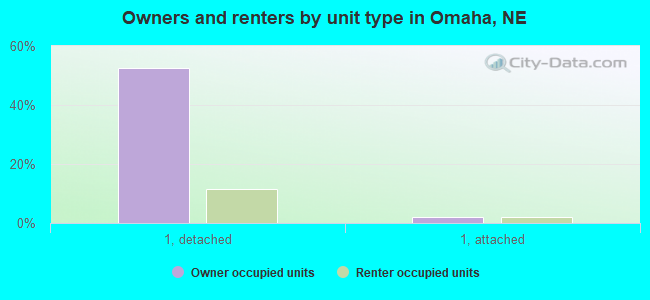
Housing units in structures - 1, detached (%)
Housing units in structures - 1, attached (%)
Housing units in structures - 2 (%)
Housing units in structures - 3 or 4 (%)
Housing units in structures - 5 to 9 (%)
Housing units in structures - 10 to 19 (%)
Housing units in structures - 20 to 49 (%)
Housing units in structures - 50 or more (%)
Housing units in structures - Mobile home (%)
Housing units in structures - Boat, RV, van, etc. (%)
Housing units in structures - Owners - 1, detached (%)
Housing units in structures - Owners - 1, attached (%)
Housing units in structures - Owners - 2 (%)
Housing units in structures - Owners - 3 or 4 (%)
Housing units in structures - Owners - 5 to 9 (%)
Housing units in structures - Owners - 10 to 19 (%)
Housing units in structures - Owners - 20 to 49 (%)
Housing units in structures - Owners - 50 or more (%)
Housing units in structures - Owners - Mobile home (%)
Housing units in structures - Owners - Boat, RV, van, etc. (%)
Housing units in structures - Renters - 1, detached (%)
Housing units in structures - Renters - 1, attached (%)
Housing units in structures - Renters - 2 (%)
Housing units in structures - Renters - 3 or 4 (%)
Housing units in structures - Renters - 5 to 9 (%)
Housing units in structures - Renters - 10 to 19 (%)
Housing units in structures - Renters - 20 to 49 (%)
Housing units in structures - Renters - 50 or more (%)
Housing units in structures - Renters - Mobile home (%)
Housing units in structures - Renters - Boat, RV, van, etc. (%)
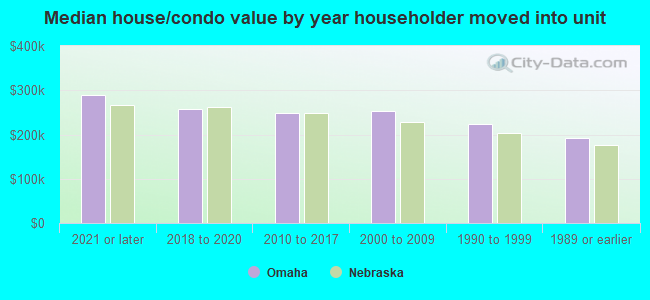
House/condo owner moved in on average (years ago)
Renter moved in on average (years ago)
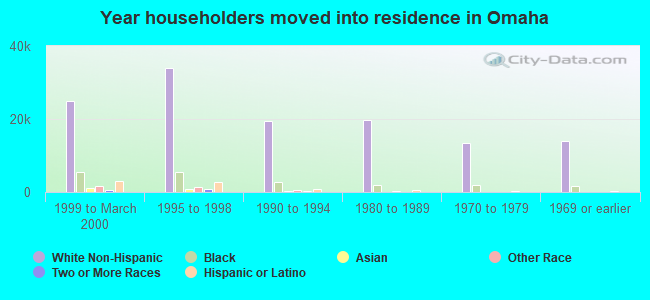
Year householder moved into unit - Moved in 1999 to March 2000 (%)
Year householder moved into unit - Moved in 1999 to March 2000 (%) - White
Year householder moved into unit - Moved in 1999 to March 2000 (%) - Black or African American
Year householder moved into unit - Moved in 1999 to March 2000 (%) - Asian
Year householder moved into unit - Moved in 1999 to March 2000 (%) - Hispanic or Latino
Year householder moved into unit - Moved in 1999 to March 2000 (%) - American Indian and Alaska Native
Year householder moved into unit - Moved in 1999 to March 2000 (%) - Multirace
Year householder moved into unit - Moved in 1999 to March 2000 (%) - Other Race
Year householder moved into unit - Moved in 1995 to 1998 (%)
Year householder moved into unit - Moved in 1995 to 1998 (%) - White
Year householder moved into unit - Moved in 1995 to 1998 (%) - Black or African American
Year householder moved into unit - Moved in 1995 to 1998 (%) - Asian
Year householder moved into unit - Moved in 1995 to 1998 (%) - Hispanic or Latino
Year householder moved into unit - Moved in 1995 to 1998 (%) - American Indian and Alaska Native
Year householder moved into unit - Moved in 1995 to 1998 (%) - Multirace
Year householder moved into unit - Moved in 1995 to 1998 (%) - Other Race
Year householder moved into unit - Moved in 1990 to 1994 (%)
Year householder moved into unit - Moved in 1990 to 1994 (%) - White
Year householder moved into unit - Moved in 1990 to 1994 (%) - Black or African American
Year householder moved into unit - Moved in 1990 to 1994 (%) - Asian
Year householder moved into unit - Moved in 1990 to 1994 (%) - Hispanic or Latino
Year householder moved into unit - Moved in 1990 to 1994 (%) - American Indian and Alaska Native
Year householder moved into unit - Moved in 1990 to 1994 (%) - Multirace
Year householder moved into unit - Moved in 1990 to 1994 (%) - Other Race
Year householder moved into unit - Moved in 1980 to 1989 (%)
Year householder moved into unit - Moved in 1980 to 1989 (%) - White
Year householder moved into unit - Moved in 1980 to 1989 (%) - Black or African American
Year householder moved into unit - Moved in 1980 to 1989 (%) - Asian
Year householder moved into unit - Moved in 1980 to 1989 (%) - Hispanic or Latino
Year householder moved into unit - Moved in 1980 to 1989 (%) - American Indian and Alaska Native
Year householder moved into unit - Moved in 1980 to 1989 (%) - Multirace
Year householder moved into unit - Moved in 1980 to 1989 (%) - Other Race
Year householder moved into unit - Moved in 1970 to 1979 (%)
Year householder moved into unit - Moved in 1970 to 1979 (%) - White
Year householder moved into unit - Moved in 1970 to 1979 (%) - Black or African American
Year householder moved into unit - Moved in 1970 to 1979 (%) - Asian
Year householder moved into unit - Moved in 1970 to 1979 (%) - Hispanic or Latino
Year householder moved into unit - Moved in 1970 to 1979 (%) - American Indian and Alaska Native
Year householder moved into unit - Moved in 1970 to 1979 (%) - Multirace
Year householder moved into unit - Moved in 1970 to 1979 (%) - Other Race
Year householder moved into unit - Moved in 1969 or earlier (%)
Year householder moved into unit - Moved in 1969 or earlier (%) - White
Year householder moved into unit - Moved in 1969 or earlier (%) - Black or African American
Year householder moved into unit - Moved in 1969 or earlier (%) - Asian
Year householder moved into unit - Moved in 1969 or earlier (%) - Hispanic or Latino
Year householder moved into unit - Moved in 1969 or earlier (%) - American Indian and Alaska Native
Year householder moved into unit - Moved in 1969 or earlier (%) - Multirace
Year householder moved into unit - Moved in 1969 or earlier (%) - Other Race
Housing units lacking complete plumbing facilities (%)
Housing units lacking complete kitchen facilities (%)
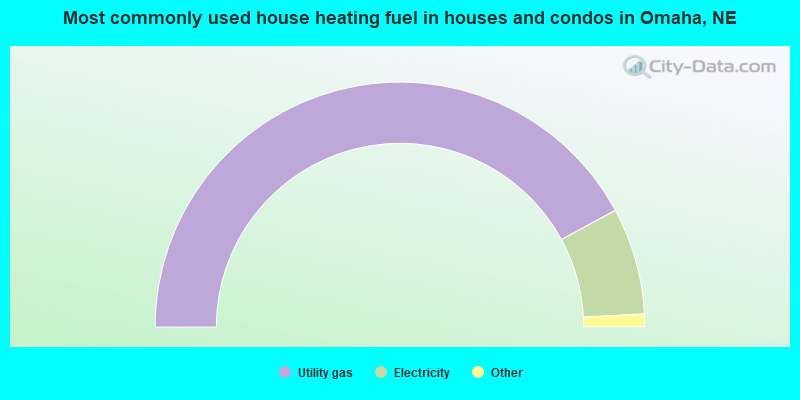
House heating fuel used in houses and condos - Utility gas (%)
House heating fuel used in houses and condos - Bottled, tank, or LP gas (%)
House heating fuel used in houses and condos - Electricity (%)
House heating fuel used in houses and condos - Fuel oil, kerosene, etc. (%)
House heating fuel used in houses and condos - Coal or coke (%)
House heating fuel used in houses and condos - Wood (%)
House heating fuel used in houses and condos - Solar energy (%)
House heating fuel used in houses and condos - Other fuel (%)
House heating fuel used in houses and condos - No fuel used (%)
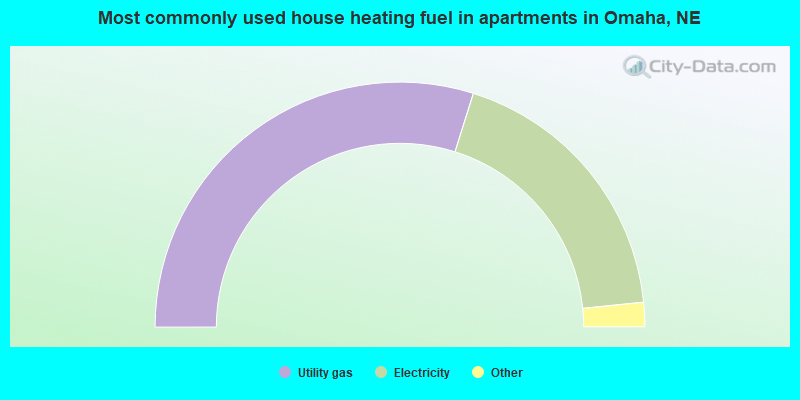
House heating fuel used in apartments - Utility gas (%)
House heating fuel used in apartments - Bottled, tank, or LP gas (%)
House heating fuel used in apartments - Electricity (%)
House heating fuel used in apartments - Fuel oil, kerosene, etc. (%)
House heating fuel used in apartments - Coal or coke (%)
House heating fuel used in apartments - Wood (%)
House heating fuel used in apartments - Solar energy (%)
House heating fuel used in apartments - Other fuel (%)
House heating fuel used in apartments - No fuel used (%)
Latest news about housing in Omaha, NE collected exclusively by city-data.com from local newspapers, TV, and radio stations
Median year house/condo built: 1973Median year apartment built: 1975Household type by relationship:
Households: 485,146
Male householders: 102,064 (36,060 living alone ), Female householders: 101,209 (36,219 living alone )80,652 spouses (79,743 opposite-sex spouses ), 14,471 unmarried partners , (13,720 opposite-sex unmarried partners ), 139,420 children (130,864 natural , 2,375 adopted , 6,181 stepchildren ), 6,292 grandchildren , 3,862 brothers or sisters , 5,156 parents , 39 foster children , 5,679 other relatives , 15,595 non-relatives In group quarters: 10,707
Size of family households: 50,089 2-persons , 24,823 3-persons , 22,599 4-persons , 11,045 5-persons , 3,966 6-persons , 2,779 7-or-more-persons .
Size of nonfamily households: 72,279 1-person , 12,920 2-persons , 2,020 3-persons , 434 4-persons , 181 5-persons , 138 6-persons .
74,111 married couples with children. single-parent households (7,638 men , 25,890 women ).
83.4% of residents of Omaha speak English at home. of residents speak Spanish at home (54% speak English very well , 18% speak English well , 14% speak English not well , 14% don't speak English at all ).of residents speak other Indo-European language at home (63% speak English very well , 24% speak English well , 11% speak English not well , 2% don't speak English at all ).of residents speak Asian or Pacific Island language at home (57% speak English very well , 22% speak English well , 14% speak English not well , 6% don't speak English at all ).of residents speak other language at home (63% speak English very well , 26% speak English well , 4% speak English not well , 7% don't speak English at all ).
Foreign born population: 50,230 (10.4%)of them are naturalized citizens )
Median number of rooms in houses and condos:
Median number of rooms in apartments
Owner-occupied Renter-occupied
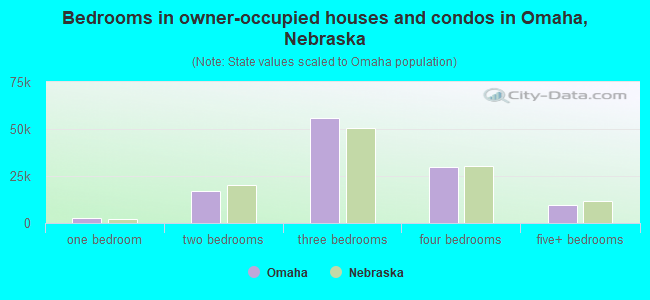
Bedrooms in owner-occupied houses and condos in Omaha, Nebraska
184 no bedroom 2,579 1 bedroom 16,916 2 bedrooms 55,919 3 bedrooms 29,882 4 bedrooms 9,532 5+ bedrooms
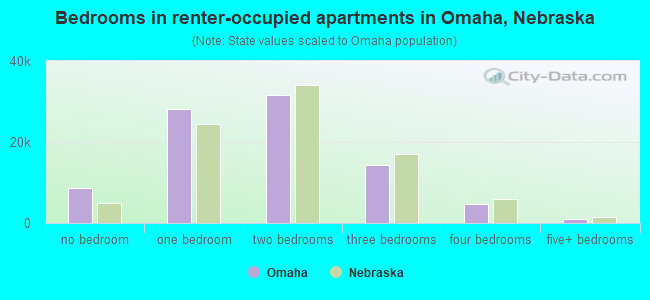
Bedrooms in renter-occupied apartments in Omaha, Nebraska
8,632 no bedroom 28,027 1 bedroom 31,535 2 bedrooms 14,263 3 bedrooms 4,789 4 bedrooms 1,015 5+ bedrooms
Owner-occupied Renter-occupied
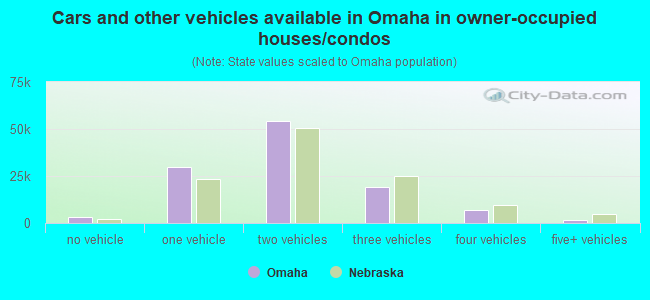
Cars and other vehicles available in Omaha in owner-occupied houses/condos
3,043 no vehicle 29,654 1 vehicle 54,040 2 vehicles 19,375 3 vehicles 7,151 4 vehicles 1,749 5+ vehicles
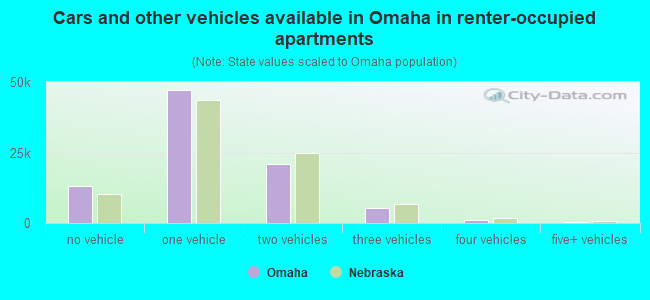
Cars and other vehicles available in Omaha in renter-occupied apartments
13,066 no vehicle 47,256 1 vehicle 21,060 2 vehicles 5,421 3 vehicles 965 4 vehicles 493 5+ vehicles
Owner-occupied Renter-occupied
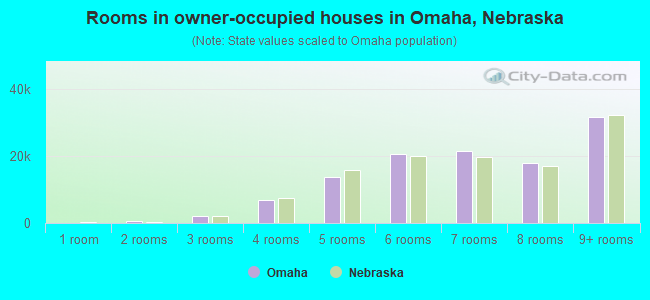
Rooms in owner-occupied houses in Omaha, Nebraska
84 1 room 591 2 rooms 2,185 3 rooms 6,905 4 rooms 13,624 5 rooms 20,477 6 rooms 21,444 7 rooms 18,001 8 rooms 31,701 9+ rooms
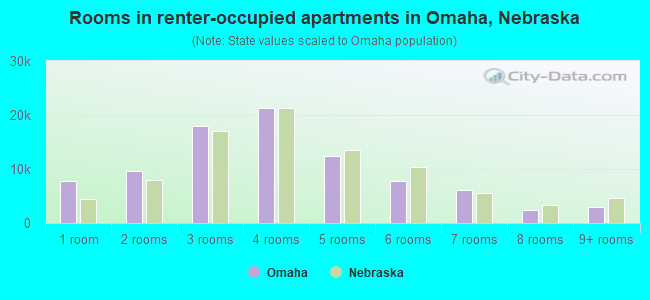
Rooms in renter-occupied apartments in Omaha, Nebraska
7,803 1 room 9,621 2 rooms 17,901 3 rooms 21,293 4 rooms 12,317 5 rooms 7,722 6 rooms 6,193 7 rooms 2,471 8 rooms 2,940 9+ rooms
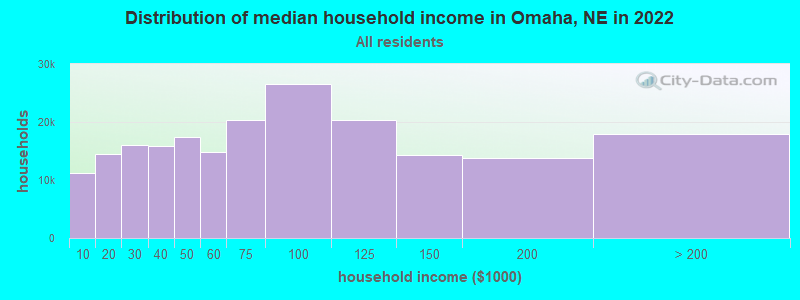
Omaha, NE household income distribution 11,219 Less than $10,00014,556 $10,000 to $19,99916,031 $20,000 to $29,99915,846 $30,000 to $39,99917,365 $40,000 to $49,99914,833 $50,000 to $59,99920,417 $60,000 to $74,99926,580 $75,000 to $99,99920,362 $100,000 to $124,99914,236 $125,000 to $149,99913,835 $150,000 to $199,99917,993 $200,000 or more
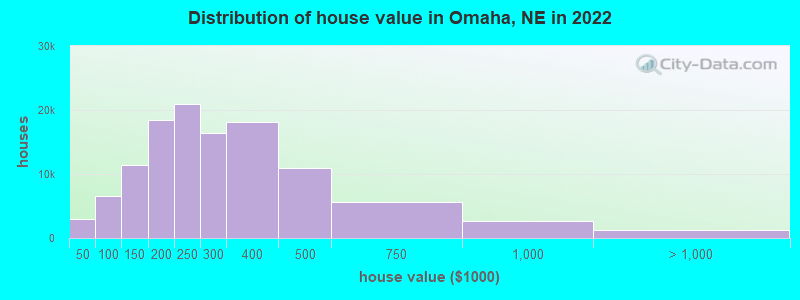
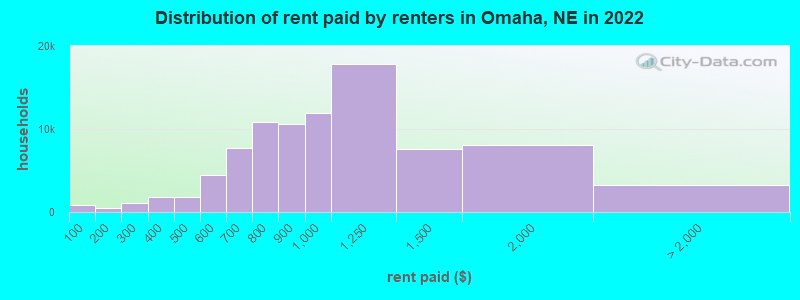
Home value of owner - occupied houses in 2022 in Omaha, NE 512 Less than $10,000451 $10,000 to $14,999460 $15,000 to $19,999490 $20,000 to $24,999286 $25,000 to $29,999345 $30,000 to $34,999129 $35,000 to $39,999296 $40,000 to $49,999933 $50,000 to $59,999445 $60,000 to $69,9991,306 $70,000 to $79,9991,669 $80,000 to $89,9991,899 $90,000 to $99,9996,377 $100,000 to $124,9995,053 $125,000 to $149,99910,077 $150,000 to $174,9998,411 $175,000 to $199,99920,958 $200,000 to $249,99916,468 $250,000 to $299,99918,187 $300,000 to $399,99910,926 $400,000 to $499,9995,559 $500,000 to $749,9992,590 $750,000 to $999,999741 $1,000,000 to $1,499,999172 $1,500,000 to $1,999,999272 $2,000,000 or moreRent paid by renters in 2022 in Omaha, NE 835 Less than $100364 $100 to $149108 $150 to $199460 $200 to $249610 $250 to $299959 $300 to $349881 $350 to $399785 $400 to $4491,056 $450 to $4991,655 $500 to $5492,796 $550 to $5994,419 $600 to $6493,237 $650 to $6994,175 $700 to $7496,663 $750 to $79910,578 $800 to $89911,902 $900 to $99917,789 $1,000 to $1,2497,586 $1,250 to $1,4998,110 $1,500 to $1,999832 $2,000 to $2,499239 $2,500 to $2,999170 $3,000 to $3,499400 $3,500 or more1,652 No cash rent
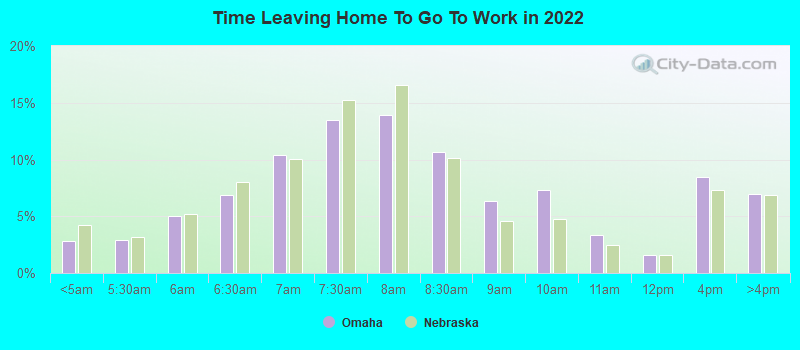
Percentage of workers working in this county: 87.5%Number of people working at home: 38,100 (15.1% of all workers )
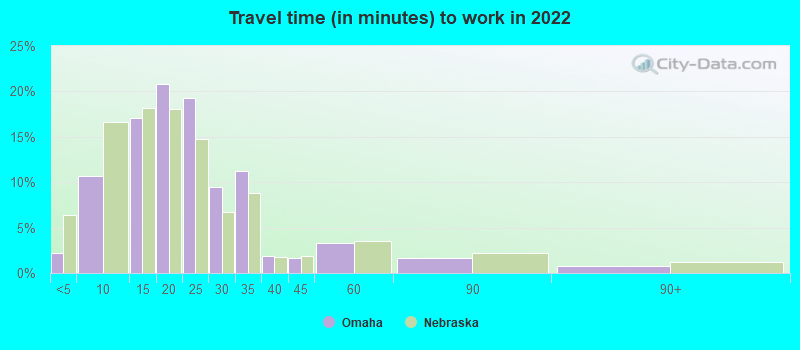
Travel time to work (commute)
Less than 5 minutes: 5,1415 to 9 minutes: 27,42510 to 14 minutes: 41,94815 to 19 minutes: 48,56220 to 24 minutes: 37,15625 to 29 minutes: 19,21030 to 34 minutes: 21,84935 to 39 minutes: 2,24440 to 44 minutes: 1,51545 to 59 minutes: 4,50260 to 89 minutes: 2,89990 or more minutes: 1,887
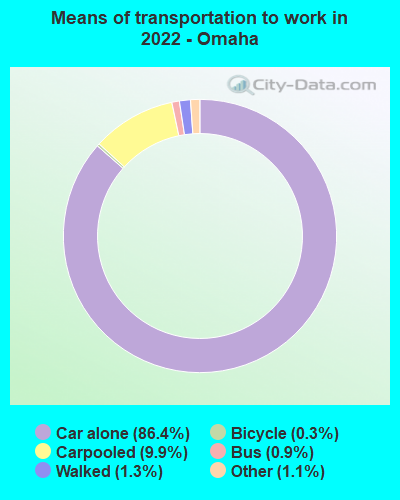
Means of transportation to work:
Drove a car alone: 247,026 (76.2%)Carpooled: 28,360 (8.8%)Bus : 2,446 (0.8%)Long-distance train or commuter rail : 279 (0.1%)Ferryboat: 91 (0.0%)Taxi: 3,228 (1.0%)Bicycle: 743 (0.2%)Walked: 3,776 (1.2%)Worked at home: 38,100 (11.8%)
Unemployment by race in 2022
Unemployment rate for White non-Hispanic residents 2.5% Males2.1% FemalesUnemployment rate for Black residents 12.9% Males9.1% FemalesUnemployment rate for American Indian and Alaska Native residents 3.1% Males7.6% FemalesUnemployment rate for Asian residents 5.8% Males2.9% FemalesUnemployment rate for other race residents 2.4% Males2.8% FemalesUnemployment rate for two or more race residents 5.6% Males3.0% FemalesUnemployment rate for Hispanic or Latino residents 0.4% Males1.7% Females
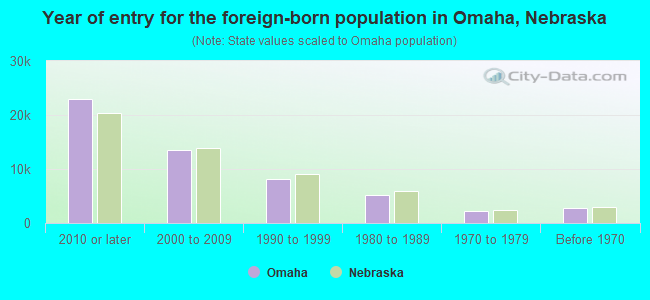
Year of entry for the foreign-born population in Omaha, Nebraska
22,871 2010 or later 13,507 2000 to 2009 8,177 1990 to 1999 5,242 1980 to 1989 2,280 1970 to 1979 2,853 Before 1970
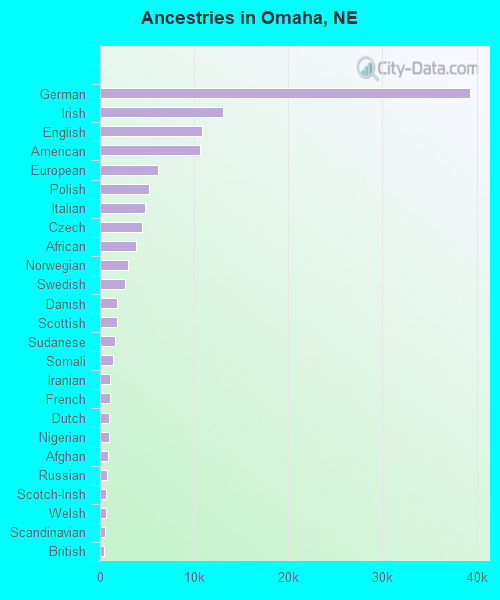
First ancestries reported:
German: 39,346 (16.8%)
Irish: 13,061 (5.6%)
English: 10,838 (4.6%)
American: 10,602 (4.5%)
European: 6,173 (2.6%)
Polish: 5,152 (2.2%)
Italian: 4,737 (2.0%)
Czech: 4,449 (1.9%)
African: 3,781 (1.6%)
Norwegian: 2,996 (1.3%)
Swedish: 2,686 (1.1%)
Danish: 1,835 (0.8%)
Scottish: 1,764 (0.8%)
Sudanese: 1,607 (0.7%)
Somali: 1,376 (0.6%)
Iranian: 1,093 (0.5%)
French: 1,081 (0.5%)
Dutch: 998 (0.4%)
Nigerian: 903 (0.4%)
Afghan: 864 (0.4%)
Russian: 727 (0.3%)
Scotch-Irish: 686 (0.3%)
Welsh: 678 (0.3%)
Scandinavian: 571 (0.2%)
British: 453 (0.2%)
German Russian: 442 (0.2%)
Eastern European: 421 (0.2%)
Lithuanian: 381 (0.2%)
Hungarian: 360 (0.2%)
Czechoslovakian: 326 (0.1%)
Arab: 289 (0.1%)
Ukrainian: 285 (0.1%)
French Canadian: 284 (0.1%)
Canadian: 282 (0.1%)
Northern European: 272 (0.1%)
Lebanese: 227 (0.10%)
Swiss: 223 (0.10%)
Greek: 212 (0.09%)
Icelander: 193 (0.08%)
Egyptian: 174 (0.07%)
Jamaican: 157 (0.07%)
Croatian: 155 (0.07%)
Kenyan: 141 (0.06%)
Slavic: 132 (0.06%)
Yugoslavian: 106 (0.05%)
Brazilian: 102 (0.04%)
Syrian: 91 (0.04%)
Ghanaian: 89 (0.04%)
Ethiopian: 82 (0.04%)
Albanian: 78 (0.03%)
Austrian: 78 (0.03%)
Iraqi: 76 (0.03%)
Latvian: 76 (0.03%)
Finnish: 75 (0.03%)
Luxembourger: 72 (0.03%)
Australian: 70 (0.03%)
Belgian: 65 (0.03%)
Zimbabwean: 63 (0.03%)
Slovak: 59 (0.03%)
Palestinian: 54 (0.02%)
Turkish: 44 (0.02%)
Portuguese: 42 (0.02%)
Slovene: 38 (0.02%)
Jordanian: 38 (0.02%)
Serbian: 36 (0.02%)
Armenian: 35 (0.01%)
Cajun: 34 (0.01%)
Guyanese: 34 (0.01%)
Sierra Leonean: 27 (0.01%)
Estonian: 26 (0.01%)
Romanian: 25 (0.01%)
Pennsylvania German: 25 (0.01%)
Bulgarian: 25 (0.01%)
Moroccan: 19 (0.01%)
South African: 18 (0.01%)
Trinidadian and Tobagonian: 12 (0.01%)
Most common places of birth for foreign-born residents (%): Mexico Omaha:
30.6% (16,406)Nebraska:
31.7% (46,610)
Guatemala Omaha:
6.1% (3,240)Nebraska:
7.2% (10,604)
India Omaha:
5.6% (2,999)Nebraska:
4.2% (6,118)
Burma (Myanmar) Omaha:
5.4% (2,909)Nebraska:
2.7% (3,951)
Thailand Omaha:
3.6% (1,915)Nebraska:
2.2% (3,167)
El Salvador Omaha:
3.1% (1,686)Nebraska:
3.7% (5,421)
China, excluding Hong Kong and Taiwan Omaha:
3.0% (1,597)Nebraska:
2.6% (3,808)
Sudan Omaha:
2.1% (1,099)Nebraska:
1.7% (2,482)
Vietnam Omaha:
2.0% (1,082)Nebraska:
4.0% (5,832)
Nepal Omaha:
1.9% (1,028)Nebraska:
1.1% (1,612)
Honduras Omaha:
1.7% (928)Nebraska:
1.9% (2,763)
Canada Omaha:
1.7% (893)Nebraska:
1.4% (1,995)
Togo Omaha:
1.7% (885)Nebraska:
1.1% (1,685)
Philippines Omaha:
1.6% (842)Nebraska:
2.2% (3,185)
Somalia Omaha:
1.6% (831)Nebraska:
1.4% (2,075)
Place of birth for U.S.-born residents:
This state: 287,113Other state: 142,841Northeast: 9,044Midwest: 74,944South: 27,856West: 30,997 87.5% of Omaha residents lived in the same house 1 years ago.
Out of people who lived in different houses, 36.8% lived in this county.
Out of people who lived in different counties, 42.9% lived in Nebraska.
Omaha:
87.5%State average:
87.4%
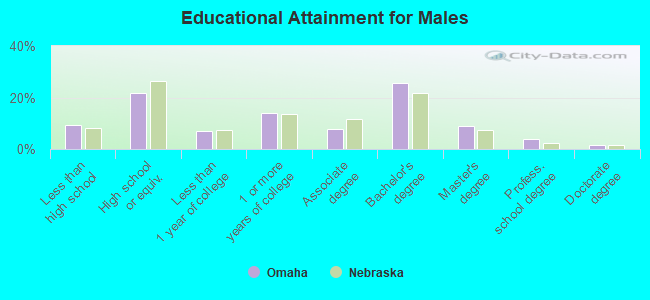
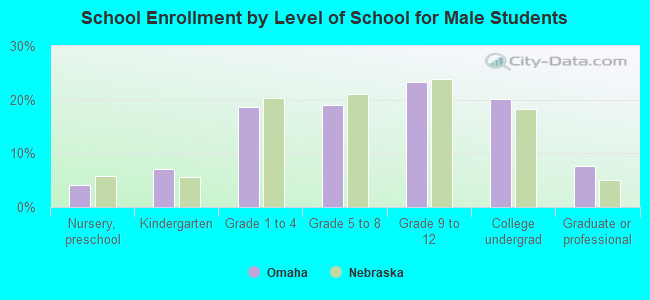
Education attainment for males 25 years and older:
No schooling: 5,218Nursery to 4th grade: 5925th and 6th grade: 6737th and 8th grade: 1,0359th grade: 67510th grade: 1,85011th grade: 1,97812th grade, no diploma: 2,636High school graduate (or equivalency): 34,417Less than 1 year of college: 10,753Some college more than 1 year, no degree: 22,330Associate degree: 12,462Bachelor's degree: 40,397Master's degree: 14,203Professional school degree: 6,315Doctorate degree: 2,689
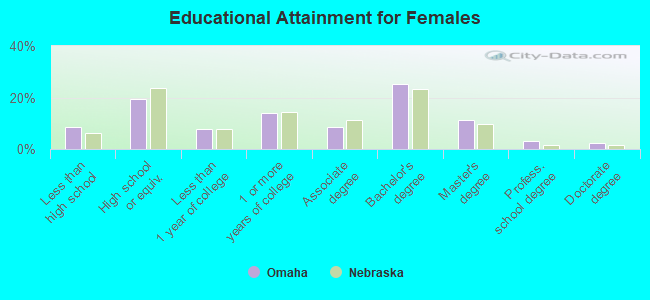
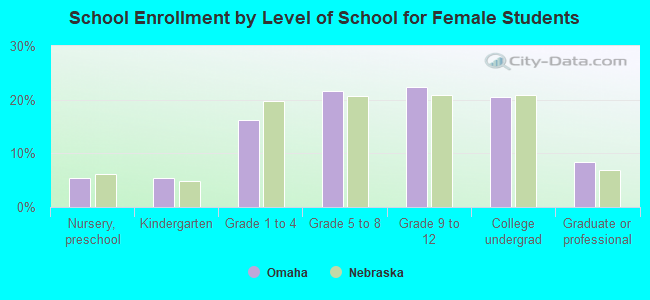
Education attainment for females 25 years and older:
No schooling: 3,872Nursery to 4th grade: 8735th and 6th grade: 1,7387th and 8th grade: 8919th grade: 50510th grade: 1,35311th grade: 1,59112th grade, no diploma: 3,050High school graduate (or equivalency): 31,255Less than 1 year of college: 12,379Some college more than 1 year, no degree: 22,367Associate degree: 13,646Bachelor's degree: 40,337Master's degree: 17,887Professional school degree: 4,928Doctorate degree: 3,527
Housing units in structures:
One, detached: 134,404One, attached: 9,027Two: 2,7363 or 4: 5,8505 to 9: 11,21710 to 19: 17,82120 to 49: 14,04950 or more: 18,376Mobile homes: 1,189Median worth of mobile homes: $39,500
Housing units lacking complete plumbing facilities in 2022: 0.6%Housing units lacking complete kitchen facilities in 2022: 1.6%House/condo owner moved in on average 11 years ago
Renter moved in on average 2 years ago
Private vs. public school enrollment:
Students in private schools in grades 1 to 8 (elementary and middle school): 7,268 Students in private schools in grades 9 to 12 (high school): 4,835 Students in private undergraduate colleges: 6,000