Owatonna, MN (Minnesota) Houses and Residents
| Owatonna: | $237,705 |
| Minnesota: | $314,600 |
Mean price in 2022:
Detached houses: $261,529
Here: $261,529 State: $374,552 Townhouses or other attached units: $296,938
Here: $296,938 State: $312,049 In 2-unit structures: $212,914
Here: $212,914 State: $323,045 In 5-or-more-unit structures: $229,446
Here: $229,446 State: $258,516 Mobile homes: $28,000
Here: $28,000 State: $94,605
Total population: 25,625 (Urban population: 22,233 (all inside urban clusters), Rural population: 182 (all nonfarm))
Houses: 11,541 (11,194 occupied: 8,317 owner occupied, 2,961 renter occupied)
| % of renters here: | 26% |
| State: | 28% |
Housing density: 916 houses/condos per square mile
Median price asked for vacant for-sale houses and condos in 2022 in this county: $146,103.
Median contract rent in 2022: $844 (lower quartile is $645, upper quartile is $1,113)
Median rent asked for vacant for-rent units in 2022: $953
Median gross rent in Owatonna, MN in 2022: $942
Housing units in Owatonna with a mortgage: 5,403 (528 second mortgage, 25 home equity loan, 398 both second mortgage and home equity loan)
Houses without a mortgage: 86
Median household income for houses/condos with a mortgage: $109,696
Median household income for apartments without a mortgage: $65,137
Median monthly housing costs: $1,117
Compare current foreclosures near Owatonna, MN:
| Photo | Address | Area | Beds / Baths | Price | Details |
|---|---|---|---|---|---|

|
#1
South St
Owatonna, MN 55060
|
2,906 sq. feet
|
1 baths 3 beds |
show details | |

|
#2
14th St NE
Owatonna, MN 55060
|
1,268 sq. feet
|
1 baths 3 beds |
show details | |

|
#3
Kriesel Pl NE
Owatonna, MN 55060
|
1,383 sq. feet
|
2 baths 3 beds |
show details | |

|
#4
E Main St
Owatonna, MN 55060
|
1,566 sq. feet
|
1 baths 3 beds |
show details | |

|
#5
Mineral Springs Pkwy
Owatonna, MN 55060
|
- sq. feet
|
2 baths 2 beds |
show details | |

|
#6
E Academy St Apt J
Owatonna, MN 55060
|
- sq. feet
|
- baths - beds |
show details | |

|
#7
N Cedar Ave
Owatonna, MN 55060
|
- sq. feet
|
- baths - beds |
show details | |

|
#8
E Broadway St
Owatonna, MN 55060
|
1,233 sq. feet
|
- baths - beds |
show details | |

|
#9
E Mckinley St
Owatonna, MN 55060
|
990 sq. feet
|
- baths - beds |
show details | |

|
#10
3rd Ave Nw, Trlr 12
Owatonna, MN 55060
|
- sq. feet
|
- baths - beds |
show details |
| Photo | Address | Area | Beds / Baths | Price | Details |
|---|---|---|---|---|---|

|
#11
S Grove Ave
Owatonna, MN 55060
|
- sq. feet
|
- baths - beds |
show details | |

|
#12
N Cedar Ave # 7
Owatonna, MN 55060
|
- sq. feet
|
- baths - beds |
show details | |

|
#13
E Main St
Owatonna, MN 55060
|
1,054 sq. feet
|
- baths - beds |
show details | |

|
#14
Austin Rd
Owatonna, MN 55060
|
- sq. feet
|
- baths - beds |
show details | |

|
#15
3rd Ave Nw, Trlr 6
Owatonna, MN 55060
|
- sq. feet
|
- baths - beds |
show details | |

|
#16
W Bridge St Apt 201
Owatonna, MN 55060
|
- sq. feet
|
- baths - beds |
show details | |

|
#17
Bixby Ave
Faribault, MN 55021
|
1,522 sq. feet
|
2 baths 3 beds |
$269,900
|
show details |

|
#18
Fawn Ave
Waseca, MN 56093
|
1,421 sq. feet
|
2 baths 2 beds |
$174,900
|
show details |

|
#19
20th St NE
Owatonna, MN 55060
|
- sq. feet
|
- baths - beds |
show details | |

|
#20
Bellflower Ln
Owatonna, MN 55060
|
- sq. feet
|
- baths - beds |
show details |
| Photo | Address | Area | Beds / Baths | Price | Details |
|---|---|---|---|---|---|

|
#21
Glendale St
Owatonna, MN 55060
|
- sq. feet
|
- baths - beds |
show details | |

|
#22
Linn Ave
Owatonna, MN 55060
|
- sq. feet
|
- baths - beds |
show details | |

|
#23
Cedar Ave
Owatonna, MN 55060
|
- sq. feet
|
- baths - beds |
show details | |

|
#24
8th Ave NE
Owatonna, MN 55060
|
- sq. feet
|
- baths - beds |
show details | |

|
#25
20th St NE
Owatonna, MN 55060
|
- sq. feet
|
- baths - beds |
show details | |

|
#26
Willow Creek Dr
Owatonna, MN 55060
|
- sq. feet
|
- baths - beds |
show details | |

|
#27
Linden Ave
Owatonna, MN 55060
|
- sq. feet
|
- baths - beds |
show details | |

|
#28
E School St
Owatonna, MN 55060
|
- sq. feet
|
- baths - beds |
show details | |

|
#29
7th Ave SW
Faribault, MN 55021
|
1,058 sq. feet
|
1 baths 2 beds |
show details | |

|
#30
Goodhue Ave
Kenyon, MN 55946
|
1,530 sq. feet
|
1 baths 3 beds |
show details |
| Photo | Address | Area | Beds / Baths | Price | Details |
|---|---|---|---|---|---|

|
#31
W Main St
Morristown, MN 55052
|
1,124 sq. feet
|
1 baths 3 beds |
show details | |

|
#32
Ne3rd St
Medford, MN 55049
|
1,801 sq. feet
|
1 baths 3 beds |
show details | |

|
#33
3rd Ave SE
Waseca, MN 56093
|
956 sq. feet
|
1 baths 3 beds |
show details | |

|
#34
Birn Hill Dr
Faribault, MN 55021
|
974 sq. feet
|
1 baths 4 beds |
show details | |

|
#35
1st Ave NW
Faribault, MN 55021
|
720 sq. feet
|
1 baths 2 beds |
show details | |

|
#36
15 1/2 St NW
Faribault, MN 55021
|
1,750 sq. feet
|
1 baths 3 beds |
show details | |

|
#37
Village Dr
Faribault, MN 55021
|
1,577 sq. feet
|
1 baths 2 beds |
show details | |

|
#38
4th St SW
Morristown, MN 55052
|
1,232 sq. feet
|
2 baths 3 beds |
show details | |

|
#39
5th St NW
Faribault, MN 55021
|
792 sq. feet
|
1 baths 2 beds |
show details | |

|
#40
E 210th St
Kenyon, MN 55946
|
1,591 sq. feet
|
1 baths 5 beds |
show details |
| Photo | Address | Area | Beds / Baths | Price | Details |
|---|---|---|---|---|---|

|
#41
Saint Paul Ave
Faribault, MN 55021
|
2,190 sq. feet
|
2 baths 5 beds |
show details | |

|
#42
Prairie Ave SW
Faribault, MN 55021
|
892 sq. feet
|
1 baths 3 beds |
show details | |

|
#43
2nd Ave NW
Faribault, MN 55021
|
1,939 sq. feet
|
1 baths 4 beds |
show details | |

|
#44
Willow St
Faribault, MN 55021
|
884 sq. feet
|
1 baths 3 beds |
show details | |

|
#45
9th St SW
Faribault, MN 55021
|
1,222 sq. feet
|
1 baths 4 beds |
show details | |

|
#46
7th Ave SW
Faribault, MN 55021
|
1,574 sq. feet
|
2 baths 5 beds |
show details | |

|
#47
Tatepaha Blvd
Faribault, MN 55021
|
1,634 sq. feet
|
1 baths 3 beds |
show details | |

|
#48
Greenwood Pl
Faribault, MN 55021
|
816 sq. feet
|
1 baths 2 beds |
show details | |

|
#49
7th Ave SW
Faribault, MN 55021
|
1,344 sq. feet
|
1 baths 4 beds |
show details | |

|
Check over 1 million property listings on Foreclosure.com!
|
browse all offers | |||

Latest news about housing in Owatonna, MN collected exclusively by city-data.com from local newspapers, TV, and radio stations

 | Need your help moving for work to Wanamingo, MN (7 replies) |
| Renting in Owatonna/Albert Lea/Blooming Prairie/Austin Area (1 reply) |
| Mankato to Bloomington (19 replies) |
| Moving back to Minnesota after a 38 years, need help (26 replies) |
| Moving to Rochester area, suggestions? (12 replies) |
| Moving to the Kasson/Rochester area (3 replies) |

Median year apartment built: 1975
Household type by relationship:
Households: 26,501- Male householders: 5,768 (1,756 living alone), Female householders: 5,232 (1,804 living alone)
5,514 spouses (5,467 opposite-sex spouses), 594 unmarried partners, (539 opposite-sex unmarried partners), 7,578 children (7,164 natural, 210 adopted, 202 stepchildren), 224 grandchildren, 40 brothers or sisters, 61 parents, 37 foster children, 94 other relatives, 843 non-relatives
- In group quarters: 513
Size of family households: 3,560 2-persons, 977 3-persons, 1,314 4-persons, 922 5-persons, 115 6-persons, 104 7-or-more-persons.
Size of nonfamily households: 3,705 1-person, 443 2-persons, 107 3-persons, 48 4-persons.
4,526 married couples with children.
1,566 single-parent households (158 men, 1,408 women).
93.4% of residents of Owatonna speak English at home.
3.6% of residents speak Spanish at home (56% speak English very well, 14% speak English well, 13% speak English not well, 18% don't speak English at all).
0.5% of residents speak other Indo-European language at home (83% speak English very well, 17% speak English not well).
0.2% of residents speak Asian or Pacific Island language at home (63% speak English very well, 37% speak English not well).
2.5% of residents speak other language at home (51% speak English very well, 21% speak English well, 19% speak English not well, 9% don't speak English at all).
Foreign born population: 1,383 (5.2%)
(50.8% of them are naturalized citizens)
| Here: | 7.3 |
| State: | 7.1 |
| Here: | 3.9 |
| State: | 3.8 |

- Bedrooms in owner-occupied houses and condos in Owatonna, Minnesota
- 0no bedroom
- 791 bedroom
- 1,0602 bedrooms
- 3,6813 bedrooms
- 2,7374 bedrooms
- 7615+ bedrooms

- Bedrooms in renter-occupied apartments in Owatonna, Minnesota
- 128no bedroom
- 1,0851 bedroom
- 1,1092 bedrooms
- 4633 bedrooms
- 574 bedrooms
- 1205+ bedrooms

- Cars and other vehicles available in Owatonna in owner-occupied houses/condos
- 208no vehicle
- 1,7971 vehicle
- 3,5762 vehicles
- 2,0063 vehicles
- 6654 vehicles
- 665+ vehicles

- Cars and other vehicles available in Owatonna in renter-occupied apartments
- 760no vehicle
- 1,5921 vehicle
- 4442 vehicles
- 1073 vehicles
- 594 vehicles
- 05+ vehicles

- Rooms in owner-occupied houses in Owatonna, Minnesota
- 01 room
- 172 rooms
- 673 rooms
- 4914 rooms
- 8505 rooms
- 1,5336 rooms
- 1,4347 rooms
- 1,4798 rooms
- 2,4479+ rooms

- Rooms in renter-occupied apartments in Owatonna, Minnesota
- 1281 room
- 1912 rooms
- 8093 rooms
- 6514 rooms
- 6235 rooms
- 2876 rooms
- 837 rooms
- 498 rooms
- 1409+ rooms


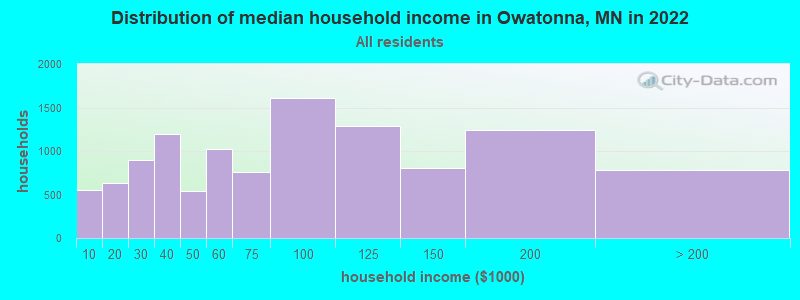
Owatonna, MN household income distribution

- 546Less than $10,000
- 629$10,000 to $19,999
- 892$20,000 to $29,999
- 1,200$30,000 to $39,999
- 538$40,000 to $49,999
- 1,018$50,000 to $59,999
- 763$60,000 to $74,999
- 1,611$75,000 to $99,999
- 1,290$100,000 to $124,999
- 807$125,000 to $149,999
- 1,246$150,000 to $199,999
- 783$200,000 or more
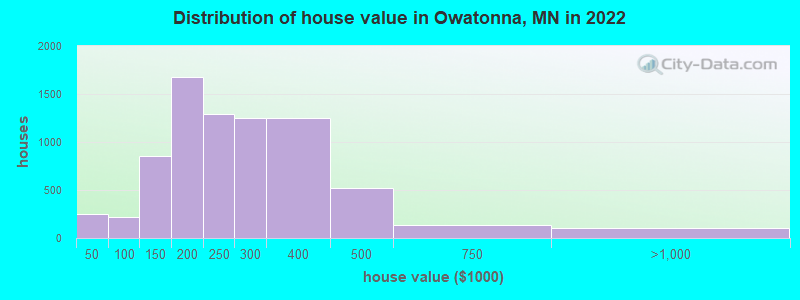
Home value of owner - occupied houses in 2022 in Owatonna, MN
-
- 102Less than $10,000
- 37$10,000 to $14,999
- 32$15,000 to $19,999
- 37$20,000 to $24,999
- 3$25,000 to $29,999
- 11$30,000 to $34,999
- 14$35,000 to $39,999
- 16$40,000 to $49,999
- 62$50,000 to $59,999
- 27$60,000 to $69,999
- 21$70,000 to $79,999
- 50$80,000 to $89,999
- 42$90,000 to $99,999
- 179$100,000 to $124,999
- 671$125,000 to $149,999
- 951$150,000 to $174,999
- 722$175,000 to $199,999
- 1,288$200,000 to $249,999
- 1,250$250,000 to $299,999
- 1,250$300,000 to $399,999
- 515$400,000 to $499,999
- 132$500,000 to $749,999
- 96$750,000 to $999,999
- 12$1,500,000 to $1,999,999
Rent paid by renters in 2022 in Owatonna, MN
-
- 13Less than $100
- 82$150 to $199
- 55$200 to $249
- 51$250 to $299
- 5$300 to $349
- 53$350 to $399
- 47$400 to $449
- 68$450 to $499
- 64$500 to $549
- 84$550 to $599
- 327$600 to $649
- 130$650 to $699
- 168$700 to $749
- 152$750 to $799
- 443$800 to $899
- 298$900 to $999
- 341$1,000 to $1,249
- 385$1,250 to $1,499
- 104$1,500 to $1,999
- 15$2,000 to $2,499
- 20$3,000 to $3,499
- 107No cash rent


Percentage of workers working in this county: 82.1%
Number of people working at home: 1,073 (8.0% of all workers)
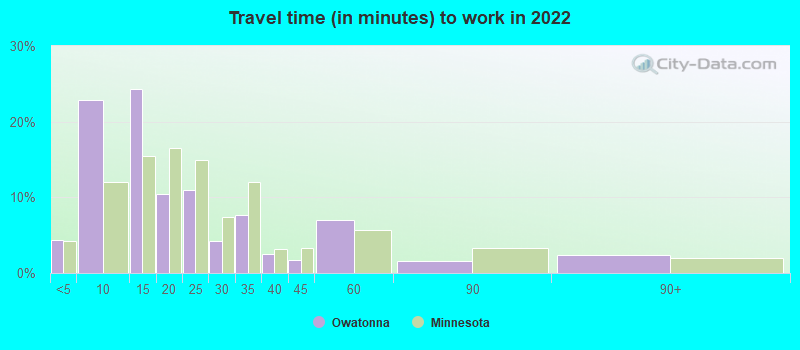
Travel time to work (commute)
- Less than 5 minutes: 573
- 5 to 9 minutes: 3,558
- 10 to 14 minutes: 3,750
- 15 to 19 minutes: 959
- 20 to 24 minutes: 790
- 25 to 29 minutes: 441
- 30 to 34 minutes: 625
- 35 to 39 minutes: 124
- 40 to 44 minutes: 238
- 45 to 59 minutes: 548
- 60 to 89 minutes: 244
- 90 or more minutes: 167
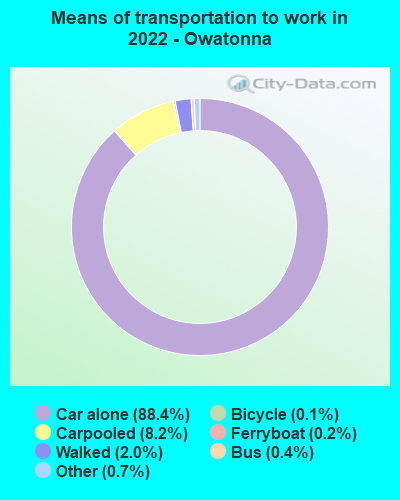
Means of transportation to work:
- Drove a car alone: 14,422 (81.0%)
- Carpooled: 1,365 (7.7%)
- Bus: 44 (0.2%)
- Ferryboat: 26 (0.1%)
- Taxi: 137 (0.8%)
- Bicycle: 17 (0.1%)
- Walked: 337 (1.9%)
- Worked at home: 1,073 (6.0%)

- Unemployment by race in 2022
- Unemployment rate for White non-Hispanic residents
- 3.0%Males
- 2.9%Females
- Unemployment rate for Black residents
- 9.3%Females
- Unemployment rate for other race residents
- 7.9%Males
- Unemployment rate for two or more race residents
- 4.4%Males
- Unemployment rate for Hispanic or Latino residents
- 2.6%Males

- Year of entry for the foreign-born population in Owatonna, Minnesota
- 4322010 or later
- 3612000 to 2009
- 3731990 to 1999
- 1631980 to 1989
- 271970 to 1979
- 89Before 1970

First ancestries reported:
- German: 2,723 (23.8%)
- Norwegian: 1,299 (11.4%)
- American: 975 (8.5%)
- English: 475 (4.2%)
- European: 432 (3.8%)
- Irish: 416 (3.6%)
- Czech: 353 (3.1%)
- Somali: 335 (2.9%)
- Swedish: 286 (2.5%)
- Dutch: 274 (2.4%)
- Italian: 265 (2.3%)
- Scandinavian: 227 (2.0%)
- Finnish: 139 (1.2%)
- Polish: 119 (1.0%)
- Danish: 109 (1.0%)
- Greek: 82 (0.7%)
- Northern European: 72 (0.6%)
- Sudanese: 65 (0.6%)
- Welsh: 60 (0.5%)
- Croatian: 51 (0.4%)
- French Canadian: 49 (0.4%)
- Jamaican: 48 (0.4%)
- Egyptian: 44 (0.4%)
- Scottish: 44 (0.4%)
- French: 40 (0.3%)
- Czechoslovakian: 32 (0.3%)
- Haitian: 26 (0.2%)
- Scotch-Irish: 25 (0.2%)
- Kenyan: 25 (0.2%)
- British: 24 (0.2%)
- Swiss: 24 (0.2%)
- Austrian: 21 (0.2%)
- Canadian: 20 (0.2%)
- Luxembourger: 16 (0.1%)
- Ethiopian: 15 (0.1%)
- Nigerian: 2 (0.02%)
Most common places of birth for foreign-born residents (%):
| Owatonna: | 36.5% (505) |
| Minnesota: | 12.1% (58,312) |
| Owatonna: | 19.7% (273) |
| Minnesota: | 8.0% (38,461) |
| Owatonna: | 8.5% (117) |
| Minnesota: | 0.1% (624) |
| Owatonna: | 6.7% (93) |
| Minnesota: | 3.3% (15,701) |
| Owatonna: | 4.7% (65) |
| Minnesota: | 0.2% (998) |
| Owatonna: | 4.3% (60) |
| Minnesota: | 2.5% (11,939) |
| Owatonna: | 3.8% (52) |
| Minnesota: | 5.1% (24,630) |
| Owatonna: | 3.4% (47) |
| Minnesota: | 0.2% (771) |
| Owatonna: | 3.3% (45) |
| Minnesota: | 2.4% (11,675) |
| Owatonna: | 2.9% (40) |
| Minnesota: | 0.4% (2,042) |
| Owatonna: | 2.5% (34) |
| Minnesota: | 0.6% (2,929) |
| Owatonna: | 2.4% (33) |
| Minnesota: | 0.2% (934) |
| Owatonna: | 1.5% (21) |
| Minnesota: | 0.2% (1,001) |
Place of birth for U.S.-born residents:
- This state: 19,202
- Other state: 5,625
- Northeast: 368
- Midwest: 3,815
- South: 828
- West: 608
88.2% of Owatonna residents lived in the same house 1 years ago.
Out of people who lived in different houses, 34.5% lived in this county.
Out of people who lived in different counties, 69.1% lived in Minnesota.
| Owatonna: | 88.2% |
| State average: | 87.4% |
Education attainment for males 25 years and older:
- No schooling: 65
- Nursery to 4th grade: 0
- 5th and 6th grade: 0
- 7th and 8th grade: 90
- 9th grade: 62
- 10th grade: 161
- 11th grade: 57
- 12th grade, no diploma: 115
- High school graduate (or equivalency): 2,427
- Less than 1 year of college: 841
- Some college more than 1 year, no degree: 1,441
- Associate degree: 1,017
- Bachelor's degree: 1,836
- Master's degree: 491
- Professional school degree: 257
- Doctorate degree: 41

Education attainment for females 25 years and older:
- No schooling: 145
- Nursery to 4th grade: 0
- 5th and 6th grade: 0
- 7th and 8th grade: 28
- 9th grade: 22
- 10th grade: 78
- 11th grade: 180
- 12th grade, no diploma: 69
- High school graduate (or equivalency): 2,613
- Less than 1 year of college: 709
- Some college more than 1 year, no degree: 1,135
- Associate degree: 933
- Bachelor's degree: 1,704
- Master's degree: 1,084
- Professional school degree: 165
- Doctorate degree: 93


Housing units in structures:
- One, detached: 8,226
- One, attached: 696
- Two: 370
- 3 or 4: 263
- 5 to 9: 226
- 10 to 19: 498
- 20 to 49: 684
- 50 or more: 351
- Mobile homes: 195
- Boats, RVs, vans, etc.: 27
Housing units lacking complete kitchen facilities in 2022: 2.1%
House/condo owner moved in on average 11 years ago
Renter moved in on average 2 years ago

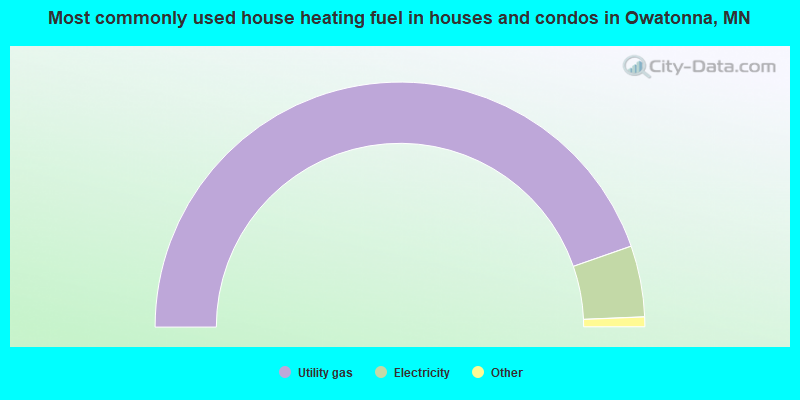
- 89.3%Utility gas
- 9.4%Electricity
- 0.7%Bottled, tank, or LP gas
- 0.3%Wood
- 0.2%No fuel used
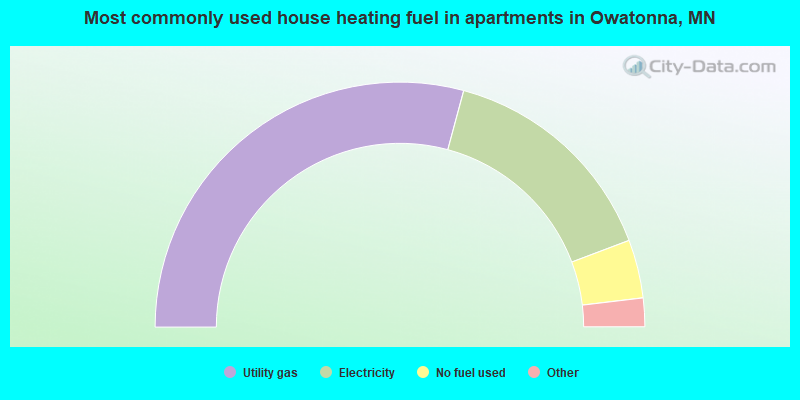
- 58.4%Utility gas
- 30.1%Electricity
- 7.7%No fuel used
- 2.9%Other fuel
- 0.9%Bottled, tank, or LP gas
Private vs. public school enrollment:
| Here: | 17.2% |
| Minnesota: | 12.9% |
| Here: | 4.9% |
| Minnesota: | 8.6% |
| Here: | 24.0% |
| Minnesota: | 26.2% |


