Pacific Grove, CA (California) Houses and Residents
| Pacific Grove: | $1,135,552 |
| California: | $715,900 |
Mean price in 2022:
Detached houses: $1,490,775
Here: $1,490,775 State: $988,808 Townhouses or other attached units: $1,130,477
Here: $1,130,477 State: $838,546 In 2-unit structures: $1,080,219
Here: $1,080,219 State: $1,138,100 In 3-to-4-unit structures: $1,481,684
Here: $1,481,684 State: $824,253 In 5-or-more-unit structures: $436,703
Here: $436,703 State: $730,996 Mobile homes: $693,169
Here: $693,169 State: $184,506
Total population: 15,601 (Urban population: 15,459, Rural population: 0)
Houses: 8,420 (6,931 occupied: 3,391 owner occupied, 3,543 renter occupied)
| % of renters here: | 51% |
| State: | 44% |
Housing density: 2,929 houses/condos per square mile
Median price asked for vacant for-sale houses and condos in 2022: $1,025,354.
Median contract rent in 2022: over $2,000 (lower quartile is $1,723, upper quartile is over $2,000)
Median rent asked for vacant for-rent units in 2022: $2,782
Median gross rent in Pacific Grove, CA in 2022: over $2,000
Housing units in Pacific Grove with a mortgage: 1,790 (216 second mortgage, 12 home equity loan, 220 both second mortgage and home equity loan)
Houses without a mortgage: 60
Median household income for houses/condos with a mortgage: $157,958
Median household income for apartments without a mortgage: $103,575
Median monthly housing costs: $2,226
Compare current foreclosures near Pacific Grove, CA:
| Photo | Address | Area | Beds / Baths | Price | Details |
|---|---|---|---|---|---|

|
#1
Junipero Ave
Pacific Grove, CA 93950
|
1,640 sq. feet
|
2 baths 3 beds |
show details | |

|
#2
Shell Ave
Pacific Grove, CA 93950
|
1,916 sq. feet
|
2 baths 4 beds |
show details | |

|
#3
Pine Ave
Pacific Grove, CA 93950
|
900 sq. feet
|
1 baths 2 beds |
show details | |

|
#4
Piedmont Ave
Pacific Grove, CA 93950
|
1,078 sq. feet
|
1 baths 3 beds |
show details | |

|
#5
2nd St
Pacific Grove, CA 93950
|
998 sq. feet
|
1 baths 2 beds |
show details | |

|
#6
Central Ave
Pacific Grove, CA 93950
|
1,012 sq. feet
|
1 baths 2 beds |
show details | |

|
#7
Lawton Ave
Pacific Grove, CA 93950
|
638 sq. feet
|
1 baths 2 beds |
show details | |

|
#8
Willow St
Pacific Grove, CA 93950
|
1,710 sq. feet
|
1 baths 3 beds |
show details | |

|
#9
17th St
Pacific Grove, CA 93950
|
- sq. feet
|
1 baths 2 beds |
show details | |

|
#10
Pacific Grove Ln Apt 6
Pacific Grove, CA 93950
|
- sq. feet
|
- baths - beds |
show details |
| Photo | Address | Area | Beds / Baths | Price | Details |
|---|---|---|---|---|---|

|
#11
Melrose St
Pacific Grove, CA 93950
|
- sq. feet
|
- baths - beds |
show details | |

|
#12
Lighthouse Ave Apt 212
Pacific Grove, CA 93950
|
- sq. feet
|
- baths - beds |
show details | |

|
#13
Forest Ave Apt A
Pacific Grove, CA 93950
|
- sq. feet
|
- baths - beds |
show details | |

|
#14
Grand Ave
Pacific Grove, CA 93950
|
- sq. feet
|
- baths - beds |
show details | |

|
#15
Gibson Ave
Pacific Grove, CA 93950
|
- sq. feet
|
- baths - beds |
show details | |

|
#16
Pedersen Ct
Pacific Grove, CA 93950
|
- sq. feet
|
- baths - beds |
show details | |

|
#17
Jewell Ave
Pacific Grove, CA 93950
|
- sq. feet
|
- baths - beds |
show details | |

|
#18
Lighthouse Ave Apt 112
Pacific Grove, CA 93950
|
- sq. feet
|
- baths - beds |
show details | |

|
#19
Walnut St
Pacific Grove, CA 93950
|
- sq. feet
|
- baths - beds |
show details | |

|
#20
Via Linda
Castroville, CA 95012
|
1,688 sq. feet
|
3 baths 4 beds |
show details |
| Photo | Address | Area | Beds / Baths | Price | Details |
|---|---|---|---|---|---|

|
#21
Loyola Dr
Salinas, CA 93901
|
2,749 sq. feet
|
2 baths 4 beds |
show details | |

|
#22
Preston St
Castroville, CA 95012
|
784 sq. feet
|
1 baths 1 beds |
show details | |

|
#23
Del Monte Ave
Castroville, CA 95012
|
938 sq. feet
|
1 baths 2 beds |
show details | |

|
#24
San Vincente Ave
Salinas, CA 93901
|
2,286 sq. feet
|
2 baths 4 beds |
show details | |

|
#25
Lemos Ave
Salinas, CA 93901
|
1,152 sq. feet
|
2 baths 3 beds |
show details | |

|
#26
Davis St
Castroville, CA 95012
|
1,388 sq. feet
|
2 baths 4 beds |
show details | |

|
#27
Primavera Way
Salinas, CA 93901
|
1,787 sq. feet
|
2 baths 3 beds |
show details | |

|
#28
Weston Ridge Rd
Carmel, CA 93923
|
590 sq. feet
|
1 baths 1 beds |
show details | |

|
#29
Legends Ct
Salinas, CA 93908
|
3,821 sq. feet
|
4 baths 5 beds |
show details | |

|
#30
Rancho Fiesta Rd
Carmel Valley, CA 93924
|
936 sq. feet
|
1 baths 2 beds |
show details |
| Photo | Address | Area | Beds / Baths | Price | Details |
|---|---|---|---|---|---|

|
#31
La Rancheria
Carmel Valley, CA 93924
|
2,993 sq. feet
|
2 baths 3 beds |
show details | |

|
#32
Mescal St
Seaside, CA 93955
|
1,800 sq. feet
|
2 baths 3 beds |
show details | |

|
#33
Saddle Rd
Monterey, CA 93940
|
5,165 sq. feet
|
5 baths 4 beds |
show details | |

|
#34
Yankee Point Dr
Carmel, CA 93923
|
6,317 sq. feet
|
6 baths 3 beds |
show details | |

|
#35
Center St Apt 2
Carmel, CA 93923
|
1,017 sq. feet
|
2 baths 2 beds |
show details | |

|
#36
Elinore Pl
Carmel, CA 93923
|
2,707 sq. feet
|
2 baths 3 beds |
show details | |

|
#37
Belavida Rd
Monterey, CA 93940
|
5,790 sq. feet
|
5 baths 5 beds |
show details | |

|
#38
Hillcrest Ave
Marina, CA 93933
|
1,903 sq. feet
|
2 baths 3 beds |
show details | |

|
#39
Ellen Ct
Marina, CA 93933
|
1,276 sq. feet
|
2 baths 4 beds |
show details | |

|
#40
Valley View Ave
Carmel, CA 93923
|
3,282 sq. feet
|
4 baths 3 beds |
show details |
| Photo | Address | Area | Beds / Baths | Price | Details |
|---|---|---|---|---|---|

|
#41
Fontes Ln
Salinas, CA 93907
|
1,409 sq. feet
|
4 baths 6 beds |
show details | |

|
#42
Mescal St
Seaside, CA 93955
|
1,747 sq. feet
|
2 baths 3 beds |
show details | |

|
#43
Ancon St
Seaside, CA 93955
|
1,668 sq. feet
|
2 baths 3 beds |
show details | |

|
#44
Fairway Dr
Seaside, CA 93955
|
3,456 sq. feet
|
4 baths 4 beds |
show details | |

|
#45
Highland St
Seaside, CA 93955
|
1,616 sq. feet
|
2 baths 3 beds |
show details | |

|
#46
W Alisal St
Salinas, CA 93901
|
2,122 sq. feet
|
1 baths 3 beds |
show details | |

|
#47
Tulane St
Salinas, CA 93906
|
1,048 sq. feet
|
1 baths 2 beds |
show details | |

|
#48
Fulton Way
Salinas, CA 93907
|
1,248 sq. feet
|
2 baths 3 beds |
show details | |

|
#49
Century Oak Rd
Salinas, CA 93907
|
2,026 sq. feet
|
2 baths 4 beds |
show details | |

|
Check over 1 million property listings on Foreclosure.com!
|
browse all offers | |||


 | Seaside towns with housing for $1.5M or less? (10 replies) |
| Rental inventory in Pacific Grove/Carmel (3 replies) |
| Attending HS in Pacific Grove (9 replies) |
| Housing Costs Are Even Crazier Here Than Southland (24 replies) |
| Seeking advice on moving to Monterey (apartments) (10 replies) |
| Monterey/ Pacific Grove or Sonoma County (7 replies) |

Median year apartment built: 1963
Household type by relationship:
Households: 14,934- Male householders: 3,138 (785 living alone), Female householders: 3,646 (1,578 living alone)
3,228 spouses (3,205 opposite-sex spouses), 295 unmarried partners, (295 opposite-sex unmarried partners), 3,351 children (3,118 natural, 135 adopted, 96 stepchildren), 91 grandchildren, 82 brothers or sisters, 146 parents, 0 foster children, 52 other relatives, 542 non-relatives
- In group quarters: 358
Size of family households: 2,409 2-persons, 722 3-persons, 656 4-persons, 97 5-persons, 84 6-persons, 27 7-or-more-persons.
Size of nonfamily households: 2,372 1-person, 503 2-persons, 41 3-persons, 32 4-persons.
1,784 married couples with children.
599 single-parent households (203 men, 396 women).
81.2% of residents of Pacific Grove speak English at home.
5.5% of residents speak Spanish at home (84% speak English very well, 7% speak English well, 5% speak English not well, 4% don't speak English at all).
5.7% of residents speak other Indo-European language at home (83% speak English very well, 11% speak English well, 7% speak English not well).
4.5% of residents speak Asian or Pacific Island language at home (80% speak English very well, 11% speak English well, 8% speak English not well).
1.9% of residents speak other language at home (76% speak English very well, 10% speak English well, 14% speak English not well).
Foreign born population: 2,008 (13.4%)
(66.8% of them are naturalized citizens)
| Here: | 5.7 |
| State: | 6.0 |
| Here: | 3.8 |
| State: | 3.9 |

- Bedrooms in owner-occupied houses and condos in Pacific Grove, California
- 0no bedroom
- 1021 bedroom
- 9192 bedrooms
- 1,5593 bedrooms
- 6294 bedrooms
- 1835+ bedrooms

- Bedrooms in renter-occupied apartments in Pacific Grove, California
- 395no bedroom
- 9561 bedroom
- 1,8052 bedrooms
- 3073 bedrooms
- 804 bedrooms
- 05+ bedrooms

- Cars and other vehicles available in Pacific Grove in owner-occupied houses/condos
- 123no vehicle
- 1,0821 vehicle
- 1,4742 vehicles
- 4983 vehicles
- 1504 vehicles
- 655+ vehicles

- Cars and other vehicles available in Pacific Grove in renter-occupied apartments
- 268no vehicle
- 1,8041 vehicle
- 1,2682 vehicles
- 1693 vehicles
- 354 vehicles
- 05+ vehicles

- Rooms in owner-occupied houses in Pacific Grove, California
- 01 room
- 152 rooms
- 1883 rooms
- 3734 rooms
- 9425 rooms
- 6146 rooms
- 5177 rooms
- 2898 rooms
- 4549+ rooms

- Rooms in renter-occupied apartments in Pacific Grove, California
- 3751 room
- 3092 rooms
- 7533 rooms
- 1,1654 rooms
- 4215 rooms
- 2586 rooms
- 1947 rooms
- 168 rooms
- 539+ rooms


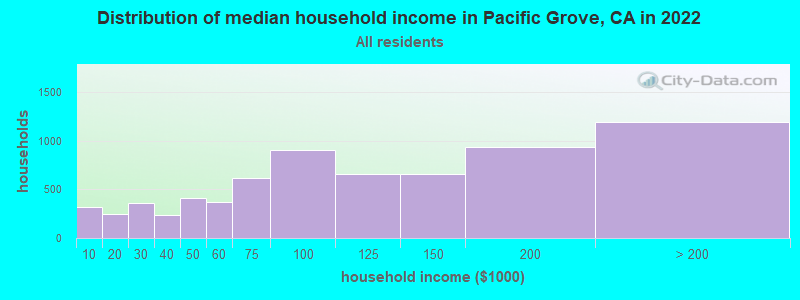
Pacific Grove, CA household income distribution

- 319Less than $10,000
- 242$10,000 to $19,999
- 355$20,000 to $29,999
- 236$30,000 to $39,999
- 413$40,000 to $49,999
- 375$50,000 to $59,999
- 612$60,000 to $74,999
- 909$75,000 to $99,999
- 661$100,000 to $124,999
- 656$125,000 to $149,999
- 937$150,000 to $199,999
- 1,193$200,000 or more
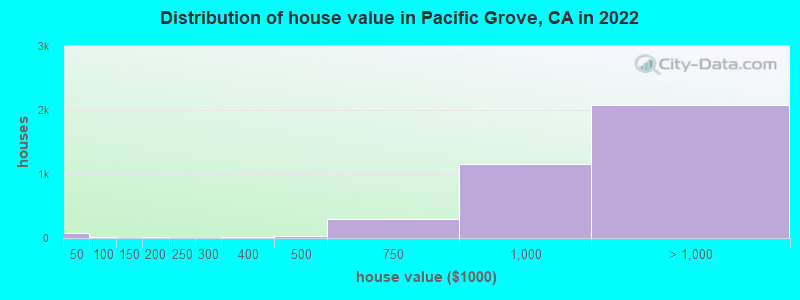
Home value of owner - occupied houses in 2022 in Pacific Grove, CA
-
- 60Less than $10,000
- 11$10,000 to $14,999
- 18$90,000 to $99,999
- 3$100,000 to $124,999
- 9$150,000 to $174,999
- 4$175,000 to $199,999
- 4$250,000 to $299,999
- 22$300,000 to $399,999
- 27$400,000 to $499,999
- 301$500,000 to $749,999
- 1,158$750,000 to $999,999
- 1,061$1,000,000 to $1,499,999
- 363$1,500,000 to $1,999,999
- 656$2,000,000 or more
Rent paid by renters in 2022 in Pacific Grove, CA
-
- 1$250 to $299
- 13$300 to $349
- 15$350 to $399
- 3$450 to $499
- 24$600 to $649
- 13$700 to $749
- 6$750 to $799
- 7$900 to $999
- 129$1,000 to $1,249
- 257$1,250 to $1,499
- 1,033$1,500 to $1,999
- 702$2,000 to $2,499
- 345$2,500 to $2,999
- 542$3,000 to $3,499
- 376$3,500 or more
- 232No cash rent


Percentage of workers working in this county: 97.1%
Number of people working at home: 1,526 (22.0% of all workers)
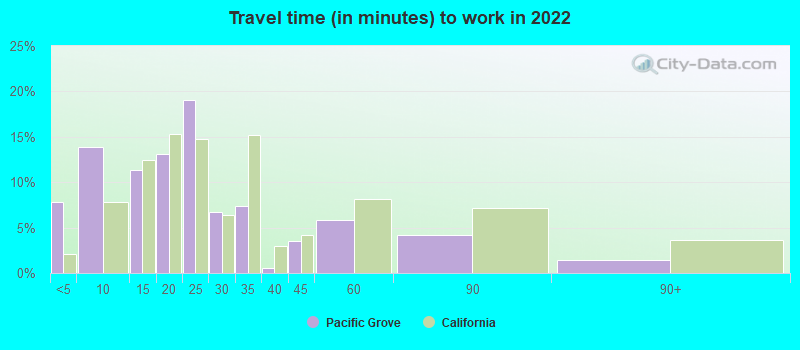
Travel time to work (commute)
- Less than 5 minutes: 412
- 5 to 9 minutes: 684
- 10 to 14 minutes: 927
- 15 to 19 minutes: 917
- 20 to 24 minutes: 1,067
- 25 to 29 minutes: 103
- 30 to 34 minutes: 523
- 35 to 39 minutes: 214
- 40 to 44 minutes: 146
- 45 to 59 minutes: 168
- 60 to 89 minutes: 155
- 90 or more minutes: 65
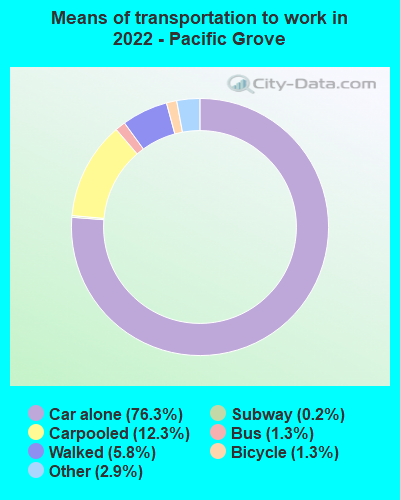
Means of transportation to work:
- Drove a car alone: 3,024 (58.3%)
- Carpooled: 439 (8.5%)
- Bus: 90 (1.7%)
- Long-distance train or commuter rail: 8 (0.2%)
- Taxi: 89 (1.7%)
- Bicycle: 72 (1.4%)
- Walked: 281 (5.4%)
- Worked at home: 1,526 (29.4%)

- Unemployment by race in 2022
- Unemployment rate for White non-Hispanic residents
- 8.7%Males
- 1.9%Females
- Unemployment rate for Asian residents
- 5.3%Males
- 6.3%Females
- Unemployment rate for other race residents
- 8.7%Males
- Unemployment rate for two or more race residents
- 2.3%Males
- 4.3%Females
- Unemployment rate for Hispanic or Latino residents
- 4.3%Males
- 3.2%Females

- Year of entry for the foreign-born population in Pacific Grove, California
- 3962010 or later
- 4272000 to 2009
- 2141990 to 1999
- 4641980 to 1989
- 2391970 to 1979
- 770Before 1970

First ancestries reported:
- English: 629 (8.6%)
- American: 582 (7.9%)
- Irish: 557 (7.6%)
- German: 527 (7.2%)
- Italian: 310 (4.2%)
- European: 265 (3.6%)
- Portuguese: 234 (3.2%)
- Scottish: 105 (1.4%)
- Afghan: 96 (1.3%)
- Northern European: 86 (1.2%)
- Scotch-Irish: 82 (1.1%)
- Swedish: 78 (1.1%)
- Ukrainian: 77 (1.0%)
- Russian: 72 (1.0%)
- Hungarian: 72 (1.0%)
- Albanian: 56 (0.8%)
- Scandinavian: 47 (0.6%)
- Polish: 46 (0.6%)
- British: 45 (0.6%)
- Welsh: 44 (0.6%)
- Dutch: 43 (0.6%)
- Syrian: 43 (0.6%)
- Croatian: 39 (0.5%)
- French: 35 (0.5%)
- Danish: 35 (0.5%)
- Eastern European: 30 (0.4%)
- Finnish: 26 (0.4%)
- Egyptian: 25 (0.3%)
- Norwegian: 25 (0.3%)
- Lebanese: 24 (0.3%)
- Jordanian: 20 (0.3%)
- Armenian: 14 (0.2%)
- French Canadian: 14 (0.2%)
- Israeli: 10 (0.1%)
- Greek: 10 (0.1%)
- Haitian: 10 (0.1%)
- Jamaican: 9 (0.1%)
- Yugoslavian: 8 (0.1%)
- Slovene: 7 (0.10%)
- Arab: 6 (0.08%)
- Slovak: 6 (0.08%)
- Basque: 5 (0.07%)
- Belgian: 5 (0.07%)
- Brazilian: 5 (0.07%)
- Lithuanian: 5 (0.07%)
- African: 5 (0.07%)
- Swiss: 5 (0.07%)
- Czechoslovakian: 3 (0.04%)
Most common places of birth for foreign-born residents (%):
| Pacific Grove: | 8.6% (169) |
| California: | 37.2% (3,881,193) |
| Pacific Grove: | 7.2% (143) |
| California: | 5.2% (539,184) |
| Pacific Grove: | 6.4% (126) |
| California: | 3.0% (315,248) |
| Pacific Grove: | 5.5% (109) |
| California: | 7.8% (818,297) |
| Pacific Grove: | 5.0% (98) |
| California: | 0.7% (73,304) |
| Pacific Grove: | 4.7% (93) |
| California: | 0.5% (53,260) |
| Pacific Grove: | 3.8% (75) |
| California: | 0.6% (57,953) |
| Pacific Grove: | 3.8% (75) |
| California: | 1.0% (103,575) |
| Pacific Grove: | 3.4% (68) |
| California: | 0.5% (53,222) |
| Pacific Grove: | 3.4% (67) |
| California: | 0.6% (60,761) |
| Pacific Grove: | 3.4% (67) |
| California: | 0.2% (25,462) |
| Pacific Grove: | 3.3% (65) |
| California: | 0.4% (42,718) |
| Pacific Grove: | 2.9% (57) |
| California: | 0.1% (10,936) |
| Pacific Grove: | 2.7% (53) |
| California: | 1.2% (127,477) |
| Pacific Grove: | 2.5% (49) |
| California: | 0.3% (33,960) |
| Pacific Grove: | 2.2% (44) |
| California: | 0.7% (74,025) |
| Pacific Grove: | 2.1% (41) |
| California: | 0.7% (71,932) |
| Pacific Grove: | 2.1% (41) |
| California: | 6.6% (684,672) |
| Pacific Grove: | 2.1% (41) |
| California: | 0.5% (48,911) |
| Pacific Grove: | 1.9% (38) |
| California: | 0.3% (30,949) |
| Pacific Grove: | 1.7% (34) |
| California: | 0.6% (60,582) |
| Pacific Grove: | 1.6% (31) |
| California: | 0.2% (16,586) |
| Pacific Grove: | 1.5% (30) |
| California: | 1.7% (176,274) |
Place of birth for U.S.-born residents:
- This state: 7,535
- Other state: 4,955
- Northeast: 1,254
- Midwest: 1,489
- South: 1,245
- West: 910
81.2% of Pacific Grove residents lived in the same house 1 years ago.
Out of people who lived in different houses, 38.3% lived in this county.
Out of people who lived in different counties, 52.6% lived in California.
| Pacific Grove: | 81.2% |
| State average: | 88.9% |
Education attainment for males 25 years and older:
- No schooling: 76
- Nursery to 4th grade: 0
- 5th and 6th grade: 0
- 7th and 8th grade: 0
- 9th grade: 26
- 10th grade: 4
- 11th grade: 85
- 12th grade, no diploma: 73
- High school graduate (or equivalency): 604
- Less than 1 year of college: 193
- Some college more than 1 year, no degree: 715
- Associate degree: 390
- Bachelor's degree: 1,596
- Master's degree: 961
- Professional school degree: 293
- Doctorate degree: 368

Education attainment for females 25 years and older:
- No schooling: 41
- Nursery to 4th grade: 16
- 5th and 6th grade: 13
- 7th and 8th grade: 0
- 9th grade: 30
- 10th grade: 0
- 11th grade: 57
- 12th grade, no diploma: 164
- High school graduate (or equivalency): 717
- Less than 1 year of college: 272
- Some college more than 1 year, no degree: 699
- Associate degree: 752
- Bachelor's degree: 1,949
- Master's degree: 887
- Professional school degree: 447
- Doctorate degree: 328


Housing units in structures:
- One, detached: 5,163
- One, attached: 393
- Two: 382
- 3 or 4: 575
- 5 to 9: 612
- 10 to 19: 309
- 20 to 49: 473
- 50 or more: 325
- Mobile homes: 183
Median worth of mobile homes: $600,785
Housing units lacking complete kitchen facilities in 2022: 1.7%
House/condo owner moved in on average 16 years ago
Renter moved in on average 2 years ago

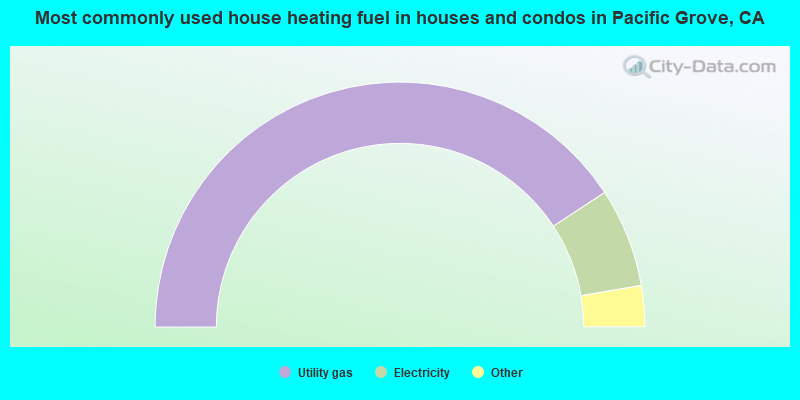
- 81.5%Utility gas
- 13.1%Electricity
- 2.2%Solar energy
- 2.1%Bottled, tank, or LP gas
- 0.6%Wood
- 0.3%No fuel used
- 0.2%Other fuel
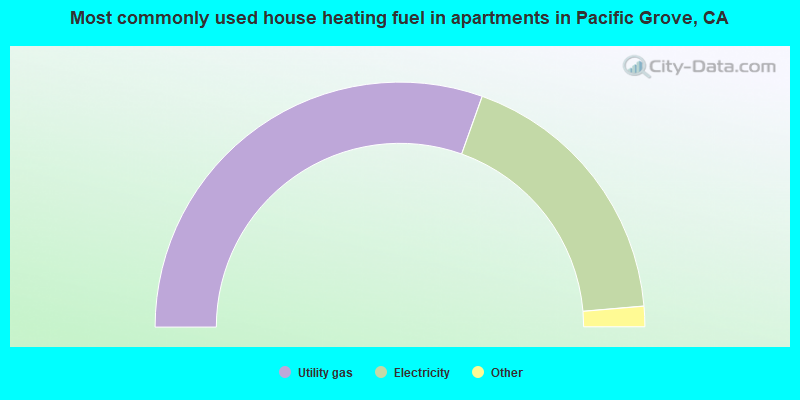
- 60.9%Utility gas
- 36.4%Electricity
- 1.3%No fuel used
- 1.0%Bottled, tank, or LP gas
- 0.3%Wood
Private vs. public school enrollment:
| Here: | 12.2% |
| California: | 10.5% |
| Here: | 16.8% |
| California: | 8.5% |
| Here: | 23.1% |
| California: | 15.9% |


