Pelham, MA (Massachusetts) Houses and Residents
| Pelham: | $460,521 |
| Massachusetts: | $534,700 |
Total population: 1,321 (Urban population: 278 (all inside urban clusters), Rural population: 1,125 (6 farm, 1,119 nonfarm))
Houses: 556 (545 occupied: 458 owner occupied, 87 renter occupied)
| % of renters here: | 16% |
| State: | 38% |
Housing density: 22 houses/condos per square mile
Median price asked for vacant for-sale houses and condos in 2022 in this county: $222,792.
Median contract rent in 2022: $1,456 (lower quartile is $1,248, upper quartile is over $2,000)
Median gross rent in Pelham, MA in 2022: $1,643
Housing units in Pelham with a mortgage: 247 (23 second mortgage, 58 home equity loan, 0 both second mortgage and home equity loan)
Houses without a mortgage: 120
Compare current foreclosures near Pelham, MA:
| Photo | Address | Area | Beds / Baths | Price | Details |
|---|---|---|---|---|---|

|
#1
Hardwick Road
Hardwick, MA 01037
|
- sq. feet
|
1 baths 3 beds |
$229,900
|
show details |

|
#2
Main St
Palmer, MA 01069
|
1,114 sq. feet
|
2 baths 2 beds |
show details | |

|
#3
Church St
Ware, MA 01082
|
2,080 sq. feet
|
1 baths 4 beds |
show details | |

|
#4
Gilbertville Rd
Ware, MA 01082
|
3,079 sq. feet
|
4 baths 6 beds |
show details | |

|
#5
Frink St
Chicopee, MA 01020
|
1,200 sq. feet
|
2 baths 3 beds |
show details | |

|
#6
Long Plain Road, Whately, Ma A/k/a 79 Long Plain Road
South Deerfield, MA 01373
|
1,909 sq. feet
|
2 baths 4 beds |
show details | |

|
#7
Brown Ave
Holyoke, MA 01040
|
2,388 sq. feet
|
2 baths 6 beds |
show details | |

|
#8
Royal St
Chicopee, MA 01020
|
3,296 sq. feet
|
4 baths 7 beds |
show details | |

|
#9
Brown Ave
Holyoke, MA 01040
|
2,090 sq. feet
|
2 baths 6 beds |
show details | |

|
#10
N Main St
New Salem, MA 01355
|
2,304 sq. feet
|
2 baths 3 beds |
show details |
| Photo | Address | Area | Beds / Baths | Price | Details |
|---|---|---|---|---|---|

|
#11
West St
Granby, MA 01033
|
940 sq. feet
|
2 baths 3 beds |
show details | |

|
#12
Stone Rd
Orange, MA 01364
|
1,312 sq. feet
|
1 baths 3 beds |
show details | |

|
#13
Day Ave
Northampton, MA 01060
|
2,406 sq. feet
|
2 baths 4 beds |
show details | |

|
#14
Hovey Rd
Monson, MA 01057
|
2,256 sq. feet
|
1 baths 4 beds |
show details | |

|
#15
Warebrook Vlg
Ware, MA 01082
|
1,344 sq. feet
|
2 baths 3 beds |
show details | |

|
#16
South Street
Ware, MA 01082
|
2,145 sq. feet
|
2 baths 4 beds |
show details | |

|
#17
Birch Hill Rd
Florence, MA 01062
|
1,376 sq. feet
|
2 baths 4 beds |
show details | |

|
#18
Grove St
Ware, MA 01082
|
1,386 sq. feet
|
3 baths 3 beds |
show details | |

|
#19
College St
Chicopee, MA 01020
|
1,902 sq. feet
|
2 baths 3 beds |
show details | |

|
#20
Ridge Rd
South Hadley, MA 01075
|
1,056 sq. feet
|
2 baths 3 beds |
show details |
| Photo | Address | Area | Beds / Baths | Price | Details |
|---|---|---|---|---|---|

|
#21
Pendleton Ave
Chicopee, MA 01022
|
1,024 sq. feet
|
1 baths 2 beds |
show details | |

|
#22
Lane Rd
Barre, MA 01005
|
2,346 sq. feet
|
2 baths 2 beds |
show details | |

|
#23
Central Park Dr
Holyoke, MA 01040
|
2,844 sq. feet
|
2 baths 4 beds |
show details | |

|
#24
Leverett Rd
Shutesbury, MA 01072
|
1,131 sq. feet
|
1 baths 3 beds |
show details | |

|
#25
Graves Rd
Conway, MA 01341
|
1,440 sq. feet
|
1 baths 3 beds |
show details | |

|
#26
S Main St
Palmer, MA 01069
|
1,117 sq. feet
|
2 baths 2 beds |
show details | |

|
#27
Pleasant St
Holyoke, MA 01040
|
4,057 sq. feet
|
3 baths 6 beds |
show details | |

|
#28
Dwight St
Holyoke, MA 01040
|
3,194 sq. feet
|
2 baths 4 beds |
show details | |

|
#29
Stebbins St
Belchertown, MA 01007
|
1,011 sq. feet
|
1 baths 3 beds |
show details | |

|
#30
Maple Ave
Ware, MA 01082
|
1,681 sq. feet
|
1 baths 3 beds |
show details |
| Photo | Address | Area | Beds / Baths | Price | Details |
|---|---|---|---|---|---|

|
#31
Duke St
Ludlow, MA 01056
|
1,251 sq. feet
|
2 baths 2 beds |
show details | |

|
#32
Laroche St
Ludlow, MA 01056
|
1,321 sq. feet
|
1 baths 3 beds |
show details | |

|
#33
Mount Warner Rd
Hadley, MA 01035
|
1,008 sq. feet
|
1 baths 3 beds |
show details | |

|
#34
Washington Ave
Holyoke, MA 01040
|
2,169 sq. feet
|
2 baths 4 beds |
show details | |

|
#35
Church St
Ware, MA 01082
|
1,539 sq. feet
|
1 baths 3 beds |
show details | |

|
#36
West St
Greenfield, MA 01301
|
1,858 sq. feet
|
2 baths 3 beds |
show details | |

|
#37
Daniel Shays Hwy
Athol, MA 01331
|
1,736 sq. feet
|
2 baths 4 beds |
show details | |

|
#38
Deerfield St
Greenfield, MA 01301
|
1,496 sq. feet
|
2 baths 3 beds |
show details | |

|
#39
N Main St, Unit A
Orange, MA 01364
|
598 sq. feet
|
1 baths 2 beds |
show details | |

|
#40
Labelle Cir
Chicopee, MA 01020
|
2,234 sq. feet
|
1 baths 4 beds |
show details |
| Photo | Address | Area | Beds / Baths | Price | Details |
|---|---|---|---|---|---|

|
#41
Winsor St
Ludlow, MA 01056
|
1,602 sq. feet
|
2 baths 3 beds |
show details | |

|
#42
Rogers Ave
Orange, MA 01364
|
1,296 sq. feet
|
1 baths 3 beds |
show details | |

|
#43
Wauwinet Rd
Barre, MA 01005
|
2,560 sq. feet
|
2 baths 5 beds |
show details | |

|
#44
Pondview Dr
Chicopee, MA 01020
|
1,200 sq. feet
|
1 baths 3 beds |
show details | |

|
#45
Elm St
Holyoke, MA 01040
|
3,617 sq. feet
|
3 baths 8 beds |
show details | |

|
#46
Maple St
Ludlow, MA 01056
|
1,701 sq. feet
|
2 baths 4 beds |
show details | |

|
#47
Albert St
Chicopee, MA 01020
|
768 sq. feet
|
1 baths 2 beds |
show details | |

|
#48
Tucker Rd
West Brookfield, MA 01585
|
2,240 sq. feet
|
2 baths 3 beds |
show details | |

|
#49
Quartus St
Chicopee, MA 01013
|
1,184 sq. feet
|
1 baths 3 beds |
show details | |

|
Check over 1 million property listings on Foreclosure.com!
|
browse all offers | |||
Latest news about housing in Pelham, MA collected exclusively by city-data.com from local newspapers, TV, and radio stations

 | How Much Massachusetts Households Make Per Year: Census Data (37 replies) |
| 2023 Real Estate Observations (5278 replies) |
| Amherst? Older parents with kids looking to retire in a college town (25 replies) |
| Why is the housing stock so crappy in Boston metro? (170 replies) |
| 1 day trip across MA - what route for iconic scenery? (43 replies) |
| Cape Cod observations from a 1st timer (77 replies) |

Household type by relationship:
Households: 137,248- In family households: 102,805 (23,141 male householders, 11,339 female householders)
26,289 spouses, 34,225 children (31,880 natural, 1,196 adopted, 1,149 stepchildren), 1,465 grandchildren, 834 brothers or sisters, 944 parents, foster children, 834 other relatives, 3,097 non-relatives
- In nonfamily households: 34,443 (10,544 male householders (7,207 living alone)), 13,678 female householders (10,221 living alone)), 10,221 nonrelatives
- In group quarters: 20,832 (1,268 institutionalized population)
21,116 married couples with children.
6,740 single-parent households (1,315 men, 5,425 women).
93.6% of residents of Pelham speak English at home.
1.3% of residents speak Spanish at home (83% speak English very well, 17% speak English well).
3.3% of residents speak other Indo-European language at home (84% speak English very well, 14% speak English well, 2% speak English not well).
1.3% of residents speak Asian or Pacific Island language at home (89% speak English very well, 11% speak English well).
0.4% of residents speak other language at home (100% speak English very well).
Foreign born population: 107 (7.1%)
(57.9% of them are naturalized citizens)
| Here: | 7.6 |
| State: | 6.5 |
| Here: | 6.0 |
| State: | 4.0 |

- Bedrooms in owner-occupied houses and condos in Pelham, Massachusetts
- 0no bedroom
- 111 bedroom
- 572 bedrooms
- 2103 bedrooms
- 1484 bedrooms
- 325+ bedrooms

- Bedrooms in renter-occupied apartments in Pelham, Massachusetts
- 6no bedroom
- 181 bedroom
- 212 bedrooms
- 283 bedrooms
- 124 bedrooms
- 25+ bedrooms

- Cars and other vehicles available in Pelham in owner-occupied houses/condos
- 4no vehicle
- 1231 vehicle
- 2372 vehicles
- 733 vehicles
- 154 vehicles
- 65+ vehicles

- Cars and other vehicles available in Pelham in renter-occupied apartments
- 6no vehicle
- 381 vehicle
- 292 vehicles
- 73 vehicles
- 74 vehicles
- 05+ vehicles

- Rooms in owner-occupied houses in Pelham, Massachusetts
- 01 room
- 22 rooms
- 113 rooms
- 114 rooms
- 535 rooms
- 816 rooms
- 1257 rooms
- 898 rooms
- 869+ rooms

- Rooms in renter-occupied apartments in Pelham, Massachusetts
- 61 room
- 22 rooms
- 103 rooms
- 184 rooms
- 235 rooms
- 136 rooms
- 17 rooms
- 118 rooms
- 39+ rooms


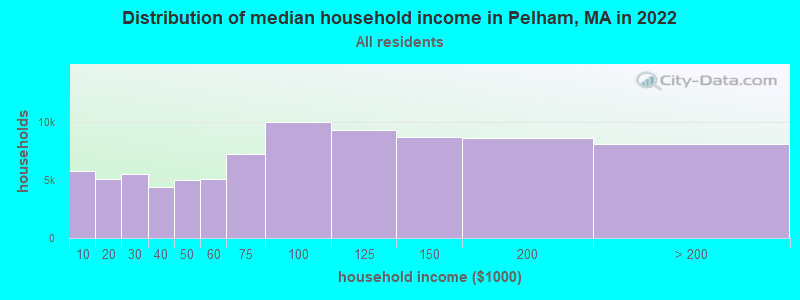
Pelham, MA household income distribution

- 5,780Less than $10,000
- 5,075$10,000 to $19,999
- 5,481$20,000 to $29,999
- 4,402$30,000 to $39,999
- 4,954$40,000 to $49,999
- 5,108$50,000 to $59,999
- 7,200$60,000 to $74,999
- 9,982$75,000 to $99,999
- 9,305$100,000 to $124,999
- 8,690$125,000 to $149,999
- 8,641$150,000 to $199,999
- 8,117$200,000 or more
Percentage of workers working in this county: 80.7%
Number of people working at home: 166 (18.4% of all workers)
Travel time to work (commute)
- Less than 5 minutes: 6
- 5 to 9 minutes: 71
- 10 to 14 minutes: 193
- 15 to 19 minutes: 134
- 20 to 24 minutes: 70
- 25 to 29 minutes: 23
- 30 to 34 minutes: 94
- 35 to 39 minutes: 28
- 40 to 44 minutes: 35
- 45 to 59 minutes: 53
- 60 to 89 minutes: 19
- 90 or more minutes: 10
Means of transportation to work:
- Drove a car alone: 655 (82.8%)
- Carpooled: 66 (8.3%)
- Subway or elevated: 3 (0.4%)
- Bicycle: 7 (0.9%)
- Walked: 5 (0.6%)
- Worked at home: 55 (7.0%)


- Year of entry for the foreign-born population in Pelham, Massachusetts
- 111995 to March 2000
- 51990 to 1994
- 141985 to 1989
- 101980 to 1984
- 31975 to 1979
- 01970 to 1974
- 51965 to 1969
- 23Before 1965

First ancestries reported:
- English: 328 (18.7%)
- Irish: 261 (14.9%)
- Other: 228 (13.0%)
- German: 177 (10.1%)
- Polish: 127 (7.2%)
- French: 97 (5.5%)
- Italian: 90 (5.1%)
- Scottish: 65 (3.7%)
- French Canadian: 52 (3.0%)
- United States: 52 (3.0%)
- Russian: 47 (2.7%)
- Scotch-Irish: 33 (1.9%)
- Dutch: 32 (1.8%)
- Czech: 24 (1.4%)
- Greek: 22 (1.3%)
- Swedish: 22 (1.3%)
- Danish: 18 (1.0%)
- Ukrainian: 18 (1.0%)
- Portuguese: 11 (0.6%)
- Welsh: 11 (0.6%)
- Subsaharan African: 10 (0.6%)
- Norwegian: 6 (0.3%)
- Slovak: 6 (0.3%)
- Hungarian: 5 (0.3%)
- Swiss: 5 (0.3%)
- Lithuanian: 4 (0.2%)
- Arab: 2 (0.1%)
- West Indian: 1 (0.06%)
Most common places of birth for foreign-born residents (%):
| Pelham: | 15.5% (11) |
| Massachusetts: | 1.9% (14,883) |
| Pelham: | 11.3% (8) |
| Massachusetts: | 5.2% (40,247) |
| Pelham: | 8.5% (6) |
| Massachusetts: | 0.7% (5,693) |
| Pelham: | 8.5% (6) |
| Massachusetts: | 2.0% (15,286) |
| Pelham: | 7.0% (5) |
| Massachusetts: | 1.6% (12,350) |
| Pelham: | 5.6% (4) |
| Massachusetts: | 3.3% (25,403) |
| Pelham: | 5.6% (4) |
| Massachusetts: | 0.3% (2,242) |
| Pelham: | 4.2% (3) |
| Massachusetts: | 0.4% (3,051) |
| Pelham: | 4.2% (3) |
| Massachusetts: | 2.3% (17,449) |
| Pelham: | 4.2% (3) |
| Massachusetts: | 1.0% (7,937) |
| Pelham: | 4.2% (3) |
| Massachusetts: | 0.2% (1,855) |
| Pelham: | 2.8% (2) |
| Massachusetts: | 0.8% (5,895) |
| Pelham: | 2.8% (2) |
| Massachusetts: | 0.3% (2,470) |
| Pelham: | 2.8% (2) |
| Massachusetts: | 0.2% (1,710) |
| Pelham: | 2.8% (2) |
| Massachusetts: | 0.9% (7,258) |
| Pelham: | 2.8% (2) |
| Massachusetts: | 0.1% (1,104) |
| Pelham: | 2.8% (2) |
| Massachusetts: | 1.0% (7,414) |
Place of birth for U.S.-born residents:
- This state: 782
- Other state: 525
- Northeast: 305
- Midwest: 100
- South: 68
- West: 52
68% of Pelham residents lived in the same house 5 years ago.
Out of people who lived in different houses, 52% lived in this county.
Out of people who lived in different counties, 51% lived in Massachusetts.
Education attainment for males 25 years and older:
- No schooling: 4
- Nursery to 4th grade: 0
- 5th and 6th grade: 0
- 7th and 8th grade: 12
- 9th grade: 3
- 10th grade: 14
- 11th grade: 0
- 12th grade, no diploma: 3
- High school graduate (or equivalency): 76
- Less than 1 year of college: 13
- Some college more than 1 year, no degree: 49
- Associate degree: 20
- Bachelor's degree: 81
- Master's degree: 70
- Professional school degree: 24
- Doctorate degree: 81

Education attainment for females 25 years and older:
- No schooling: 0
- Nursery to 4th grade: 0
- 5th and 6th grade: 0
- 7th and 8th grade: 0
- 9th grade: 5
- 10th grade: 6
- 11th grade: 3
- 12th grade, no diploma: 3
- High school graduate (or equivalency): 83
- Less than 1 year of college: 19
- Some college more than 1 year, no degree: 39
- Associate degree: 26
- Bachelor's degree: 136
- Master's degree: 136
- Professional school degree: 12
- Doctorate degree: 47


Housing units in structures:
- One, detached: 470
- One, attached: 17
- Two: 52
- 3 or 4: 9
- Mobile homes: 8
Median worth of mobile homes: $49,691

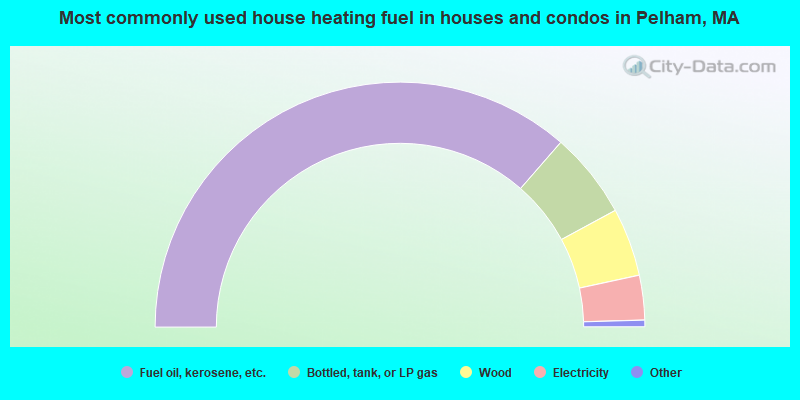
- 72.9%Fuel oil, kerosene, etc.
- 11.4%Bottled, tank, or LP gas
- 9.0%Wood
- 5.9%Electricity
- 0.4%Utility gas
- 0.4%Other fuel
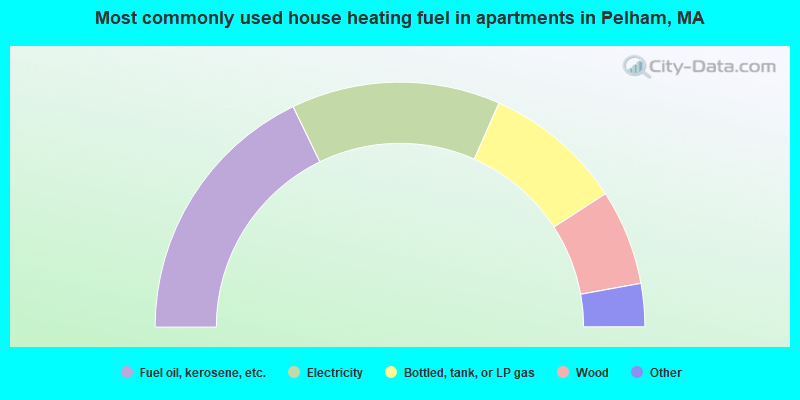
- 35.6%Fuel oil, kerosene, etc.
- 27.6%Electricity
- 18.4%Bottled, tank, or LP gas
- 12.6%Wood
- 3.4%Utility gas
- 2.3%Other fuel
Private vs. public school enrollment:
| Here: | 3.0% |
| Massachusetts: | 10.8% |
| Here: | 12.7% |
| Massachusetts: | 12.2% |
| Here: | 12.9% |
| Massachusetts: | 48.2% |


