Phenix City, AL (Alabama) Houses and Residents
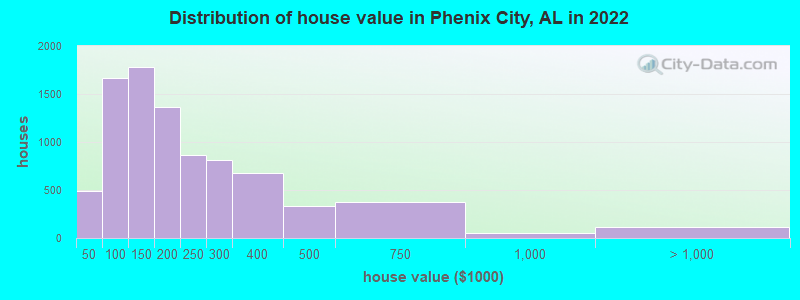
Estimated median house or condo value in 2022: $172,456 (it was $72,500 in 2000 )
Phenix City:
$172,456Alabama:
$200,900
Lower value quartile - upper value quartile: $107,878 - $273,590Mean price in 2022: Detached houses: $207,270 Here:
$207,270State:
$273,076
Townhouses or other attached units: $142,678 Here:
$142,678State:
$222,857
In 2-unit structures: $289,393 Here:
$289,393State:
$191,282
In 3-to-4-unit structures: $84,550 Here:
$84,550State:
$194,388
Mobile homes: $12,826 Here:
$12,826State:
$77,780
Total population: 37,540 (Urban population: 28,087, Rural population: 251 (all nonfarm) )
Houses: 18,698 (16,146 occupied: 8,564 owner occupied, 7,970 renter occupied )
% of renters here:
48%State:
30%
Housing density: 760 houses/condos per square mile
Median price asked for vacant for-sale houses and condos in 2022: $198,501.
Median contract rent in 2022: $706 (lower quartile is $478, upper quartile is $916)
Median rent asked for vacant for-rent units in 2022: $736
Median gross rent in Phenix City, AL in 2022: $911
Housing units in Phenix City with a mortgage: 5,178 (326 second mortgage, 20 home equity loan, 212 both second mortgage and home equity loan )Houses without a mortgage: 116
Median household income for houses/condos with a mortgage: $82,308
Median household income for apartments without a mortgage: $48,278
Median monthly housing costs: $892
Data:
Median house or condo value ($)
Median house or condo value ($ change since 2000)
Median house or condo value ($) - White
Median house or condo value ($) - Black or African American
Median house or condo value ($) - Asian
Median house or condo value ($) - Hispanic or Latino
Median house or condo value ($) - American Indian and Alaska Native
Median house or condo value ($) - Multirace
Median house or condo value ($) - Other Race
Median price asked for mobile homes ($)
Household density (households per square mile)
Mean house or condo value by units in structure - 1, detached ($)
Mean house or condo value by units in structure - 1, attached ($)
Mean house or condo value by units in structure - 2 ($)
Mean house or condo value by units in structure by units in structure - 3 or 4 ($)
Mean house or condo value by units in structure - 5 or more ($)
Mean house or condo value by units in structure - Boat, RV, van, etc. ($)
Mean house or condo value by units in structure - Mobile home ($)
Median contract rent ($)
Median contract rent - Lower quartile ($)
Median contract rent - Upper quartile ($)
Median gross rent ($)
Urban houses (%)
Rural houses (%)
Houses occupied (%)
Houses occupied (% change since 2000)
Houses owner occupied (%)
Houses owner occupied (% change since 2000)
Houses renter occupied (%)
Houses renter occupied (% change since 2000)
Vacant housing units - For rent (%)
Vacant housing units - For rent (% change since 2000)
Vacant housing units - For sale only (%)
Vacant housing units - For sale only (% change since 2000)
Vacant housing units - Rented or sold, not occupied (%)
Vacant housing units - Rented or sold, not occupied (% change since 2000)
Vacant housing units - For seasonal, recreational, or occasional use (%)
Vacant housing units - For seasonal, recreational, or occasional use (% change since 2000)
Vacant housing units - For migrant workers (%)
Vacant housing units - For migrant workers (% change since 2000)
Vacant housing units - Other vacant (%)
Vacant housing units - Other vacant (% change since 2000)
Median monthly housing costs ($)
Median household income for houses/condos with a mortgage ($)
Median household income for houses/condos without a mortgage ($)
Median household income ($)
Median household income ($) - White
Median household income ($) - Black or African American
Median household income ($) - Asian
Median household income ($) - Hispanic or Latino
Median household income ($) - American Indian and Alaska Native
Median household income ($) - Multirace
Median household income ($) - Other Race
Mortgage status - with mortgage (%)
Mortgage status - with second mortgage (%)
Mortgage status - with home equity loan (%)
Mortgage status - with both second mortgage and home equity loan (%)
Mortgage status - without a mortgage (%)
Median year house/condo built
Median year apartment built
Household type by relationship - Male householder living alone (%)
Household type by relationship - Male householder not living alone (%)
Household type by relationship - Female householder living alone (%)
Household type by relationship - Female householder not living alone (%)
Household type by relationship - Opposite-Sex spouse (%)
Household type by relationship - Same-Sex spouse (%)
Household type by relationship - Opposite-Sex unmarried partner (%)
Household type by relationship - Same-Sex unmarried partner (%)
Household type by relationship - In group quarters (%)
Size of family households - 2-person household (%)
Size of family households - 3-person household (%)
Size of family households - 4-person household (%)
Size of family households - 5-person household (%)
Size of family households - 6-person household (%)
Size of family households - 7-or-more-person household (%)
Size of nonfamily households - 1-person household (%)
Size of nonfamily households - 2-person household (%)
Size of nonfamily households - 3-person household (%)
Size of nonfamily households - 4-person household (%)
Size of nonfamily households - 5-person household (%)
Size of nonfamily households - 6-person household (%)
Size of nonfamily households - 7-or-moreperson household (%)
Year house built - Built 2010 or later (%)
Year house built - Built 2000 to 2009 (%)
Year house built - Built 1990 to 1999 (%)
Year house built - Built 1980 to 1989 (%)
Year house built - Built 1970 to 1979 (%)
Year house built - Built 1960 to 1969 (%)
Year house built - Built 1950 to 1959 (%)
Year house built - Built 1940 to 1949 (%)
Year house built - Built 1939 or earlier (%)
Median number of rooms in houses and condos
Median number of rooms in apartments
Median number of bedrooms in owner occupied houses
Mean number of bedrooms in owner occupied houses
Median number of bedrooms in renter occupied houses
Mean number of bedrooms in renter occupied houses
Median number of vehichles in owner occupied houses
Mean number of vehichles in owner occupied houses
Median number of vehichles in renter occupied houses
Mean number of vehichles in renter occupied houses
Rooms in owner-occupied houses - 1 room (%)
Rooms in owner-occupied houses - 2 rooms (%)
Rooms in owner-occupied houses - 3 rooms (%)
Rooms in owner-occupied houses - 4 rooms (%)
Rooms in owner-occupied houses - 5 rooms (%)
Rooms in owner-occupied houses - 6 rooms (%)
Rooms in owner-occupied houses - 7 rooms (%)
Rooms in owner-occupied houses - 8 rooms (%)
Rooms in owner-occupied houses - 9+ rooms (%)
Rooms in renter-occupied houses - 1 room (%)
Rooms in renter-occupied houses - 2 rooms (%)
Rooms in renter-occupied houses - 3 rooms (%)
Rooms in renter-occupied houses - 4 rooms (%)
Rooms in renter-occupied houses - 5 rooms (%)
Rooms in renter-occupied houses - 6 rooms (%)
Rooms in renter-occupied houses - 7 rooms (%)
Rooms in renter-occupied houses - 8 rooms (%)
Rooms in renter-occupied houses - 9+ rooms (%)
Bedrooms in owner-occupied houses - no bedrooms (%)
Bedrooms in owner-occupied houses - 1 bedroom (%)
Bedrooms in owner-occupied houses - 2 bedrooms (%)
Bedrooms in owner-occupied houses - 3 bedrooms (%)
Bedrooms in owner-occupied houses - 4 bedrooms (%)
Bedrooms in owner-occupied houses - 5+ bedrooms (%)
Bedrooms in renter-occupied houses - no bedrooms (%)
Bedrooms in renter-occupied houses - 1 bedroom (%)
Bedrooms in renter-occupied houses - 2 bedrooms (%)
Bedrooms in renter-occupied houses - 3 bedrooms (%)
Bedrooms in renter-occupied houses - 4 bedrooms (%)
Bedrooms in renter-occupied houses - 5+ bedrooms (%)
Vehicles available in owner-occupied houses - no vehicle available (%)
Vehicles available in owner-occupied houses - 1 vehicle available(%)
Vehicles available in owner-occupied houses - 2 Vehicles available (%)
Vehicles available in owner-occupied houses - 3 Vehicles available (%)
Vehicles available in owner-occupied houses - 4 Vehicles available (%)
Vehicles available in owner-occupied houses - 5+ Vehicles available (%)
Vehicles available in renter-occupied houses - no vehicle available (%)
Vehicles available in renter-occupied houses - 1 vehicle available (%)
Vehicles available in renter-occupied houses - 2 Vehicles available (%)
Vehicles available in renter-occupied houses - 3 Vehicles available (%)
Vehicles available in renter-occupied houses - 4 Vehicles available (%)
Vehicles available in renter-occupied houses - 5+ Vehicles available (%)
Housing units in structures - 1, detached (%)
Housing units in structures - 1, attached (%)
Housing units in structures - 2 (%)
Housing units in structures - 3 or 4 (%)
Housing units in structures - 5 to 9 (%)
Housing units in structures - 10 to 19 (%)
Housing units in structures - 20 to 49 (%)
Housing units in structures - 50 or more (%)
Housing units in structures - Mobile home (%)
Housing units in structures - Boat, RV, van, etc. (%)
Housing units in structures - Owners - 1, detached (%)
Housing units in structures - Owners - 1, attached (%)
Housing units in structures - Owners - 2 (%)
Housing units in structures - Owners - 3 or 4 (%)
Housing units in structures - Owners - 5 to 9 (%)
Housing units in structures - Owners - 10 to 19 (%)
Housing units in structures - Owners - 20 to 49 (%)
Housing units in structures - Owners - 50 or more (%)
Housing units in structures - Owners - Mobile home (%)
Housing units in structures - Owners - Boat, RV, van, etc. (%)
Housing units in structures - Renters - 1, detached (%)
Housing units in structures - Renters - 1, attached (%)
Housing units in structures - Renters - 2 (%)
Housing units in structures - Renters - 3 or 4 (%)
Housing units in structures - Renters - 5 to 9 (%)
Housing units in structures - Renters - 10 to 19 (%)
Housing units in structures - Renters - 20 to 49 (%)
Housing units in structures - Renters - 50 or more (%)
Housing units in structures - Renters - Mobile home (%)
Housing units in structures - Renters - Boat, RV, van, etc. (%)
House/condo owner moved in on average (years ago)
Renter moved in on average (years ago)
Year householder moved into unit - Moved in 1999 to March 2000 (%)
Year householder moved into unit - Moved in 1999 to March 2000 (%) - White
Year householder moved into unit - Moved in 1999 to March 2000 (%) - Black or African American
Year householder moved into unit - Moved in 1999 to March 2000 (%) - Asian
Year householder moved into unit - Moved in 1999 to March 2000 (%) - Hispanic or Latino
Year householder moved into unit - Moved in 1999 to March 2000 (%) - American Indian and Alaska Native
Year householder moved into unit - Moved in 1999 to March 2000 (%) - Multirace
Year householder moved into unit - Moved in 1999 to March 2000 (%) - Other Race
Year householder moved into unit - Moved in 1995 to 1998 (%)
Year householder moved into unit - Moved in 1995 to 1998 (%) - White
Year householder moved into unit - Moved in 1995 to 1998 (%) - Black or African American
Year householder moved into unit - Moved in 1995 to 1998 (%) - Asian
Year householder moved into unit - Moved in 1995 to 1998 (%) - Hispanic or Latino
Year householder moved into unit - Moved in 1995 to 1998 (%) - American Indian and Alaska Native
Year householder moved into unit - Moved in 1995 to 1998 (%) - Multirace
Year householder moved into unit - Moved in 1995 to 1998 (%) - Other Race
Year householder moved into unit - Moved in 1990 to 1994 (%)
Year householder moved into unit - Moved in 1990 to 1994 (%) - White
Year householder moved into unit - Moved in 1990 to 1994 (%) - Black or African American
Year householder moved into unit - Moved in 1990 to 1994 (%) - Asian
Year householder moved into unit - Moved in 1990 to 1994 (%) - Hispanic or Latino
Year householder moved into unit - Moved in 1990 to 1994 (%) - American Indian and Alaska Native
Year householder moved into unit - Moved in 1990 to 1994 (%) - Multirace
Year householder moved into unit - Moved in 1990 to 1994 (%) - Other Race
Year householder moved into unit - Moved in 1980 to 1989 (%)
Year householder moved into unit - Moved in 1980 to 1989 (%) - White
Year householder moved into unit - Moved in 1980 to 1989 (%) - Black or African American
Year householder moved into unit - Moved in 1980 to 1989 (%) - Asian
Year householder moved into unit - Moved in 1980 to 1989 (%) - Hispanic or Latino
Year householder moved into unit - Moved in 1980 to 1989 (%) - American Indian and Alaska Native
Year householder moved into unit - Moved in 1980 to 1989 (%) - Multirace
Year householder moved into unit - Moved in 1980 to 1989 (%) - Other Race
Year householder moved into unit - Moved in 1970 to 1979 (%)
Year householder moved into unit - Moved in 1970 to 1979 (%) - White
Year householder moved into unit - Moved in 1970 to 1979 (%) - Black or African American
Year householder moved into unit - Moved in 1970 to 1979 (%) - Asian
Year householder moved into unit - Moved in 1970 to 1979 (%) - Hispanic or Latino
Year householder moved into unit - Moved in 1970 to 1979 (%) - American Indian and Alaska Native
Year householder moved into unit - Moved in 1970 to 1979 (%) - Multirace
Year householder moved into unit - Moved in 1970 to 1979 (%) - Other Race
Year householder moved into unit - Moved in 1969 or earlier (%)
Year householder moved into unit - Moved in 1969 or earlier (%) - White
Year householder moved into unit - Moved in 1969 or earlier (%) - Black or African American
Year householder moved into unit - Moved in 1969 or earlier (%) - Asian
Year householder moved into unit - Moved in 1969 or earlier (%) - Hispanic or Latino
Year householder moved into unit - Moved in 1969 or earlier (%) - American Indian and Alaska Native
Year householder moved into unit - Moved in 1969 or earlier (%) - Multirace
Year householder moved into unit - Moved in 1969 or earlier (%) - Other Race
Housing units lacking complete plumbing facilities (%)
Housing units lacking complete kitchen facilities (%)
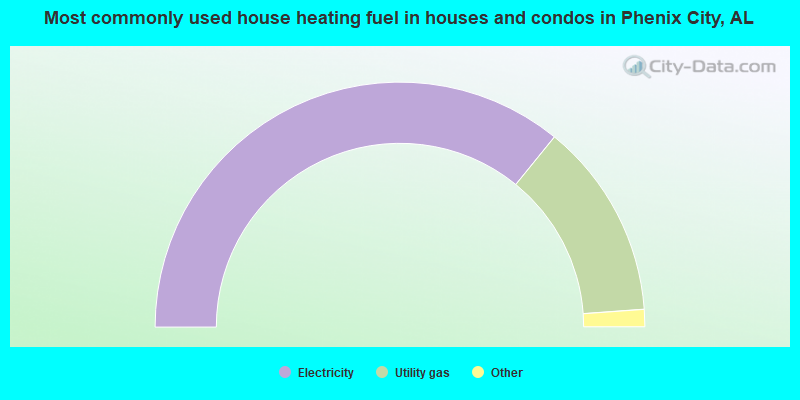
House heating fuel used in houses and condos - Utility gas (%)
House heating fuel used in houses and condos - Bottled, tank, or LP gas (%)
House heating fuel used in houses and condos - Electricity (%)
House heating fuel used in houses and condos - Fuel oil, kerosene, etc. (%)
House heating fuel used in houses and condos - Coal or coke (%)
House heating fuel used in houses and condos - Wood (%)
House heating fuel used in houses and condos - Solar energy (%)
House heating fuel used in houses and condos - Other fuel (%)
House heating fuel used in houses and condos - No fuel used (%)
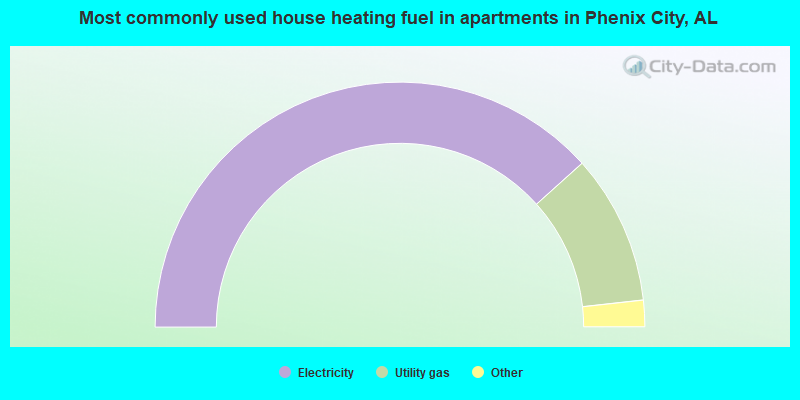
House heating fuel used in apartments - Utility gas (%)
House heating fuel used in apartments - Bottled, tank, or LP gas (%)
House heating fuel used in apartments - Electricity (%)
House heating fuel used in apartments - Fuel oil, kerosene, etc. (%)
House heating fuel used in apartments - Coal or coke (%)
House heating fuel used in apartments - Wood (%)
House heating fuel used in apartments - Solar energy (%)
House heating fuel used in apartments - Other fuel (%)
House heating fuel used in apartments - No fuel used (%)
Median year house/condo built: 1986Median year apartment built: 1981Household type by relationship:
Households: 38,765
Male householders: 6,968 (2,353 living alone ), Female householders: 9,029 (3,242 living alone )5,882 spouses (5,873 opposite-sex spouses ), 830 unmarried partners , (708 opposite-sex unmarried partners ), 12,039 children (11,006 natural , 339 adopted , 694 stepchildren ), 1,052 grandchildren , 507 brothers or sisters , 316 parents , 18 foster children , 693 other relatives , 875 non-relatives In group quarters: 551
Size of family households: 4,432 2-persons , 3,009 3-persons , 1,741 4-persons , 646 5-persons , 128 6-persons , 17 7-or-more-persons .
Size of nonfamily households: 5,785 1-person , 713 2-persons , 57 3-persons , 30 4-persons .
3,834 married couples with children. single-parent households (542 men , 3,799 women ).
93.1% of residents of Phenix City speak English at home. of residents speak Spanish at home (80% speak English very well , 6% speak English well , 13% speak English not well , 2% don't speak English at all ).of residents speak other Indo-European language at home (100% speak English very well ).of residents speak Asian or Pacific Island language at home (60% speak English very well , 31% speak English well , 8% speak English not well ).of residents speak other language at home (63% speak English very well , 37% speak English well ).
Foreign born population: 1,654 (4.3%)of them are naturalized citizens )
Median number of rooms in houses and condos:
Median number of rooms in apartments
Owner-occupied Renter-occupied
Rooms in owner-occupied houses in Phenix City, Alabama
17 1 room 0 2 rooms 132 3 rooms 538 4 rooms 1,327 5 rooms 2,467 6 rooms 1,393 7 rooms 1,061 8 rooms 1,630 9+ rooms
Rooms in renter-occupied apartments in Phenix City, Alabama
245 1 room 161 2 rooms 812 3 rooms 2,876 4 rooms 1,679 5 rooms 1,267 6 rooms 408 7 rooms 352 8 rooms 171 9+ rooms
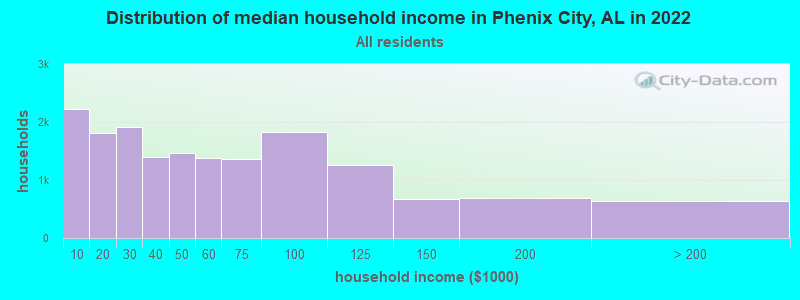
Phenix City, AL household income distribution 2,224 Less than $10,0001,809 $10,000 to $19,9991,907 $20,000 to $29,9991,404 $30,000 to $39,9991,473 $40,000 to $49,9991,372 $50,000 to $59,9991,364 $60,000 to $74,9991,831 $75,000 to $99,9991,251 $100,000 to $124,999673 $125,000 to $149,999696 $150,000 to $199,999634 $200,000 or more
Home value of owner - occupied houses in 2022 in Phenix City, AL 84 Less than $10,00037 $10,000 to $14,9995 $15,000 to $19,99914 $20,000 to $24,99941 $25,000 to $29,999111 $30,000 to $34,99912 $35,000 to $39,999185 $40,000 to $49,99982 $50,000 to $59,999482 $60,000 to $69,999404 $70,000 to $79,999250 $80,000 to $89,999257 $90,000 to $99,9991,124 $100,000 to $124,999661 $125,000 to $149,999776 $150,000 to $174,999585 $175,000 to $199,999862 $200,000 to $249,999815 $250,000 to $299,999680 $300,000 to $399,999337 $400,000 to $499,999374 $500,000 to $749,99950 $750,000 to $999,99971 $1,000,000 to $1,499,99915 $1,500,000 to $1,999,99927 $2,000,000 or moreRent paid by renters in 2022 in Phenix City, AL 69 Less than $100191 $100 to $149107 $150 to $199286 $200 to $249153 $250 to $299175 $300 to $349238 $350 to $399298 $400 to $449545 $450 to $499448 $500 to $549144 $550 to $599279 $600 to $649665 $650 to $699279 $700 to $749772 $750 to $799840 $800 to $899328 $900 to $9991,160 $1,000 to $1,249201 $1,250 to $1,499100 $1,500 to $1,999432 No cash rent
Percentage of workers working in this county: 30.9%Number of people working at home: 1,902 (10.9% of all workers )
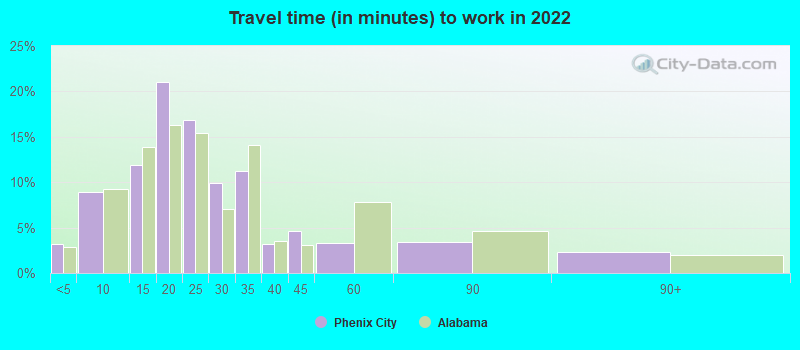
Travel time to work (commute)
Less than 5 minutes: 2635 to 9 minutes: 1,32710 to 14 minutes: 3,01315 to 19 minutes: 3,13720 to 24 minutes: 3,02425 to 29 minutes: 1,57630 to 34 minutes: 1,80435 to 39 minutes: 11440 to 44 minutes: 47745 to 59 minutes: 43060 to 89 minutes: 25790 or more minutes: 228
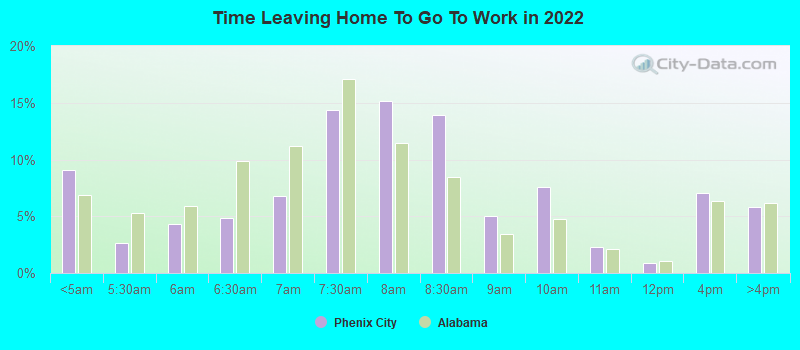
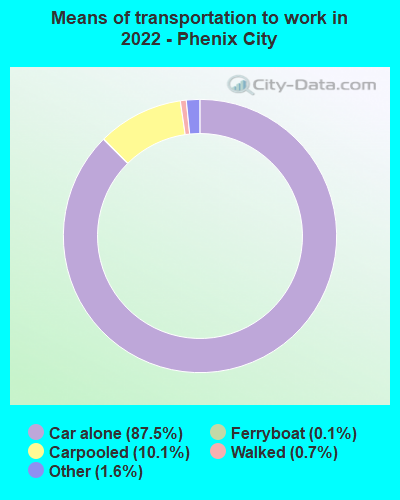
Means of transportation to work:
Drove a car alone: 9,695 (75.5%)Carpooled: 1,129 (8.8%)Ferryboat: 12 (0.1%)Taxi: 239 (1.9%)Walked: 86 (0.7%)Worked at home: 1,902 (14.8%)
Unemployment by race in 2022
Unemployment rate for White non-Hispanic residents 1.8% Males6.6% FemalesUnemployment rate for Black residents 7.6% Males7.4% FemalesUnemployment rate for two or more race residents 6.0% Males18.0% Females
Year of entry for the foreign-born population in Phenix City, Alabama
561 2010 or later 329 2000 to 2009 388 1990 to 1999 73 1980 to 1989 92 1970 to 1979 118 Before 1970
First ancestries reported:
American: 2,513 (11.0%)
English: 1,609 (7.0%)
German: 1,190 (5.2%)
Irish: 523 (2.3%)
European: 326 (1.4%)
Italian: 256 (1.1%)
African: 229 (1.0%)
Polish: 212 (0.9%)
Scotch-Irish: 153 (0.7%)
Scottish: 147 (0.6%)
Norwegian: 90 (0.4%)
Jamaican: 45 (0.2%)
Israeli: 44 (0.2%)
Ukrainian: 42 (0.2%)
Danish: 40 (0.2%)
Welsh: 27 (0.1%)
British: 26 (0.1%)
Nigerian: 25 (0.1%)
Greek: 23 (0.1%)
French: 17 (0.07%)
Palestinian: 10 (0.04%)
Haitian: 8 (0.04%)
Iranian: 5 (0.02%) Most common places of birth for foreign-born residents (%): Guatemala Phenix City:
23.0% (359)Alabama:
8.6% (15,159)
Germany Phenix City:
18.0% (282)Alabama:
3.9% (6,831)
Mexico Phenix City:
10.7% (168)Alabama:
26.4% (46,832)
Hong Kong Phenix City:
7.9% (123)Alabama:
0.2% (301)
Honduras Phenix City:
6.5% (102)Alabama:
1.9% (3,447)
Philippines Phenix City:
6.1% (95)Alabama:
2.9% (5,154)
Korea Phenix City:
4.2% (66)Alabama:
5.2% (9,293)
Vietnam Phenix City:
3.8% (60)Alabama:
3.6% (6,414)
Colombia Phenix City:
3.6% (57)Alabama:
1.1% (2,005)
China, excluding Hong Kong and Taiwan Phenix City:
2.4% (38)Alabama:
4.6% (8,075)
Jamaica Phenix City:
2.0% (32)Alabama:
1.3% (2,382)
England Phenix City:
1.9% (30)Alabama:
1.1% (1,877)
Ecuador Phenix City:
1.8% (28)Alabama:
0.2% (416)
Place of birth for U.S.-born residents:
This state: 11,483Other state: 25,457Northeast: 1,314Midwest: 1,565South: 21,067West: 1,748 87.6% of Phenix City residents lived in the same house 1 years ago.
Out of people who lived in different houses, 25.1% lived in this county.
Out of people who lived in different counties, 24.7% lived in Alabama.
Phenix City:
87.6%State average:
87.6%
Education attainment for males 25 years and older:
No schooling: 217Nursery to 4th grade: 295th and 6th grade: 307th and 8th grade: 1809th grade: 9310th grade: 15711th grade: 16912th grade, no diploma: 264High school graduate (or equivalency): 3,342Less than 1 year of college: 913Some college more than 1 year, no degree: 2,340Associate degree: 1,221Bachelor's degree: 1,721Master's degree: 903Professional school degree: 163Doctorate degree: 251
Education attainment for females 25 years and older:
No schooling: 200Nursery to 4th grade: 345th and 6th grade: 267th and 8th grade: 2609th grade: 10610th grade: 40311th grade: 25112th grade, no diploma: 490High school graduate (or equivalency): 3,794Less than 1 year of college: 1,149Some college more than 1 year, no degree: 2,628Associate degree: 1,868Bachelor's degree: 1,708Master's degree: 933Professional school degree: 89Doctorate degree: 94
Housing units in structures:
One, detached: 12,719One, attached: 248Two: 6273 or 4: 1,3595 to 9: 1,91510 to 19: 99720 to 49: 19350 or more: 406Mobile homes: 230Housing units lacking complete plumbing facilities in 2022: 1.5%Housing units lacking complete kitchen facilities in 2022: 3.1%House/condo owner moved in on average 10 years ago
Renter moved in on average 2 years ago
Private vs. public school enrollment:
Students in private schools in grades 1 to 8 (elementary and middle school): 719 Students in private schools in grades 9 to 12 (high school): 278 Students in private undergraduate colleges: 425