Housing density: 1,384 houses/condos per square mile
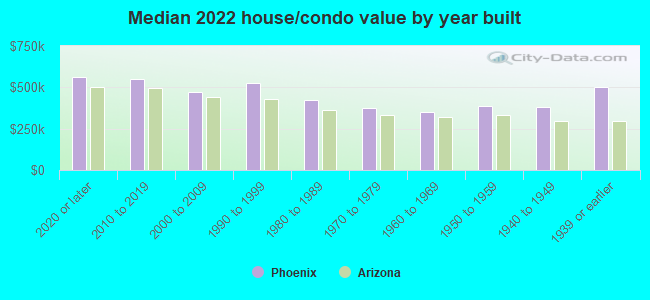
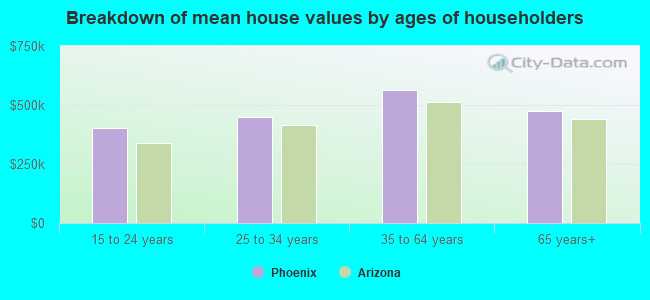
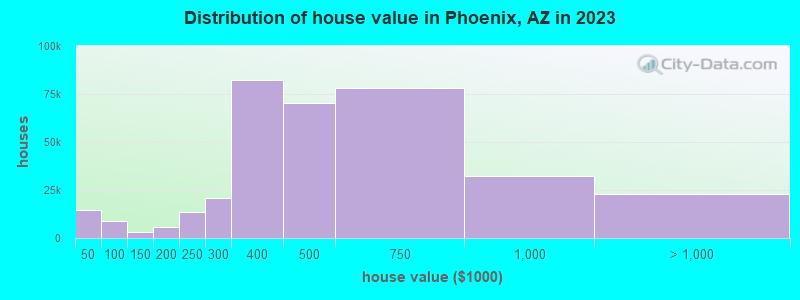
Median price asked for vacant for-sale houses and condos in 2022: $362,178.
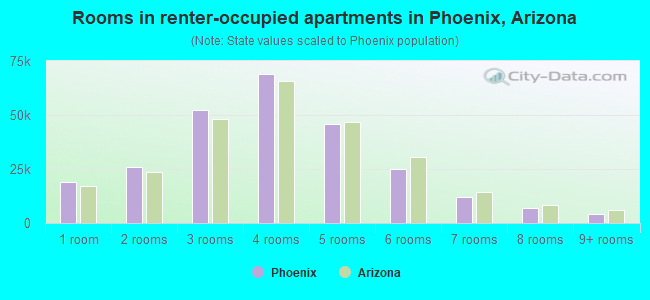
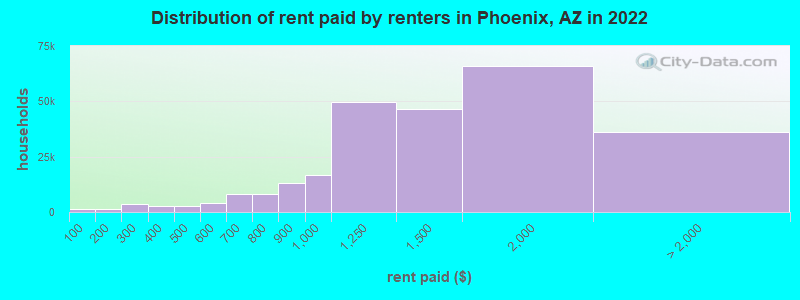
Median contract rent in 2022: $1,331 (lower quartile is $1,006, upper quartile is $1,742)
Median rent asked for vacant for-rent units in 2022: $1,660
Median gross rent in Phoenix, AZ in 2022: $1,486
Housing units in Phoenix with a mortgage: 234,031 (15,971 second mortgage, 284 home equity loan, 13,056 both second mortgage and home equity loan) Houses without a mortgage: 2,454
Median household income for houses/condos with a mortgage: $107,163
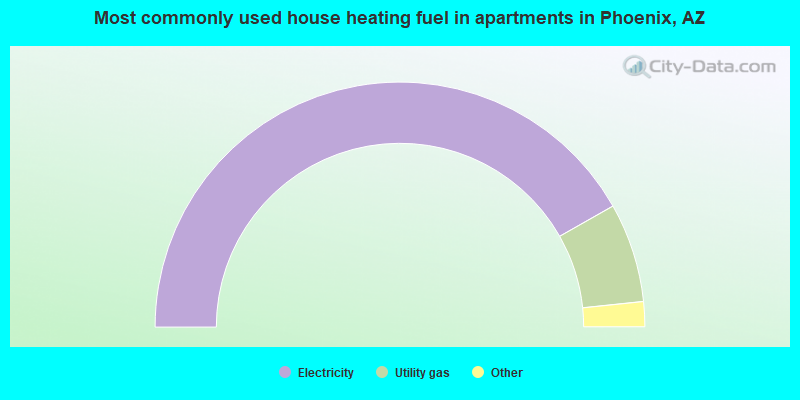
Median household income for apartments without a mortgage: $74,642
204,697 married couples with children.
122,376 single-parent households (35,214 men, 87,162 women).
62.6% of residents of Phoenix speak English at home.
30.6% of residents speak Spanish at home (64% speak English very well, 14% speak English well, 13% speak English not well, 9% don't speak English at all).
2.6% of residents speak other Indo-European language at home (78% speak English very well, 13% speak English well, 7% speak English not well, 1% don't speak English at all).
2.3% of residents speak Asian or Pacific Island language at home (58% speak English very well, 23% speak English well, 15% speak English not well, 4% don't speak English at all).
1.9% of residents speak other language at home (60% speak English very well, 26% speak English well, 11% speak English not well, 2% don't speak English at all).
Foreign born population: 322,675 (19.6%)
(40.5% of them are naturalized citizens)
Percentage of workers working in this county: 98.6% Number of people working at home: 169,934 (20.5% of all workers)
Travel time to work (commute)
Less than 5 minutes: 18,779
5 to 9 minutes: 47,387
10 to 14 minutes: 76,830
15 to 19 minutes: 103,849
20 to 24 minutes: 112,098
25 to 29 minutes: 55,192
30 to 34 minutes: 117,949
35 to 39 minutes: 24,473
40 to 44 minutes: 25,935
45 to 59 minutes: 41,847
60 to 89 minutes: 22,863
90 or more minutes: 10,038
Means of transportation to work:
Drove a car alone: 582,606 (65.2%)
Carpooled: 93,982 (10.5%)
Bus: 9,922 (1.1%)
Subway or elevated rail: 488 (0.1%)
Long-distance train or commuter rail: 210 (0.0%)
Light rail, streetcar or trolley: 1,174 (0.1%)
Ferryboat: 37 (0.0%)
Taxi: 20,336 (2.3%)
Bicycle: 3,132 (0.4%)
Walked: 11,202 (1.3%)
Worked at home: 169,934 (19.0%)
Unemployment by race in 2022
Unemployment rate for White non-Hispanic residents
3.3%Males
3.1%Females
Unemployment rate for Black residents
9.8%Males
6.3%Females
Unemployment rate for American Indian and Alaska Native residents
6.8%Males
7.3%Females
Unemployment rate for Asian residents
3.2%Males
1.9%Females
Unemployment rate for other race residents
3.5%Males
7.2%Females
Unemployment rate for two or more race residents
3.5%Males
6.8%Females
Unemployment rate for Hispanic or Latino residents
3.3%Males
6.6%Females
Year of entry for the foreign-born population in Phoenix, Arizona
88,4292010 or later
81,7952000 to 2009
78,2051990 to 1999
62,5921980 to 1989
25,0761970 to 1979
19,251Before 1970
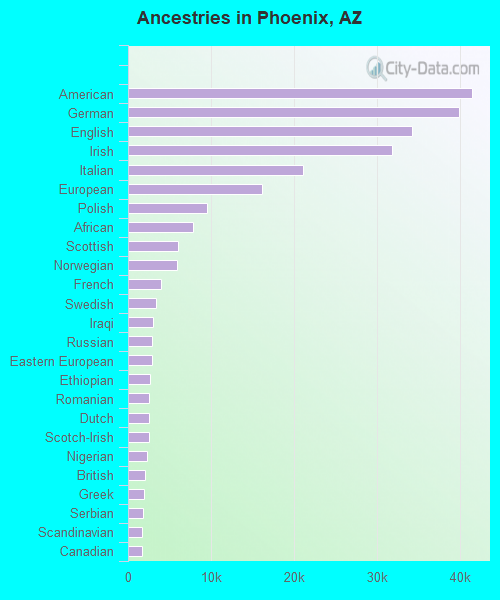
First ancestries reported:
American: 41,387 (4.5%)
German: 39,830 (4.4%)
English: 34,186 (3.7%)
Irish: 31,781 (3.5%)
Italian: 21,027 (2.3%)
European: 16,083 (1.8%)
Polish: 9,474 (1.0%)
African: 7,859 (0.9%)
Scottish: 6,037 (0.7%)
Norwegian: 5,932 (0.6%)
French: 3,994 (0.4%)
Swedish: 3,372 (0.4%)
Iraqi: 3,047 (0.3%)
Russian: 2,918 (0.3%)
Eastern European: 2,902 (0.3%)
Ethiopian: 2,613 (0.3%)
Romanian: 2,573 (0.3%)
Dutch: 2,565 (0.3%)
Scotch-Irish: 2,491 (0.3%)
Nigerian: 2,295 (0.3%)
British: 2,062 (0.2%)
Greek: 1,869 (0.2%)
Serbian: 1,771 (0.2%)
Scandinavian: 1,702 (0.2%)
Canadian: 1,673 (0.2%)
Yugoslavian: 1,552 (0.2%)
Lebanese: 1,511 (0.2%)
Ukrainian: 1,499 (0.2%)
Northern European: 1,460 (0.2%)
Hungarian: 1,451 (0.2%)
Welsh: 1,443 (0.2%)
French Canadian: 1,396 (0.2%)
Czech: 1,358 (0.1%)
Iranian: 1,289 (0.1%)
Somali: 1,259 (0.1%)
Arab: 1,178 (0.1%)
Portuguese: 1,171 (0.1%)
Kenyan: 1,126 (0.1%)
Croatian: 1,119 (0.1%)
Haitian: 1,116 (0.1%)
Afghan: 1,100 (0.1%)
Lithuanian: 1,042 (0.1%)
Assyrian: 996 (0.1%)
Danish: 876 (0.10%)
Armenian: 771 (0.08%)
Albanian: 759 (0.08%)
Jamaican: 684 (0.07%)
Bulgarian: 663 (0.07%)
Finnish: 630 (0.07%)
Czechoslovakian: 614 (0.07%)
Swiss: 604 (0.07%)
Brazilian: 558 (0.06%)
Jordanian: 554 (0.06%)
Slovak: 519 (0.06%)
Liberian: 498 (0.05%)
Austrian: 467 (0.05%)
Egyptian: 458 (0.05%)
Guyanese: 458 (0.05%)
West Indian: 438 (0.05%)
Sudanese: 427 (0.05%)
Australian: 415 (0.05%)
Turkish: 388 (0.04%)
Palestinian: 326 (0.04%)
Slavic: 285 (0.03%)
Syrian: 262 (0.03%)
Moroccan: 182 (0.02%)
Celtic: 178 (0.02%)
Ugandan: 170 (0.02%)
Belizean: 153 (0.02%)
Barbadian: 137 (0.01%)
South African: 126 (0.01%)
Pennsylvania German: 123 (0.01%)
Latvian: 123 (0.01%)
Cypriot: 120 (0.01%)
Ghanaian: 104 (0.01%)
Sierra Leonean: 101 (0.01%)
Israeli: 88 (0.01%)
Belgian: 88 (0.01%)
Cajun: 75 (0.01%)
Basque: 59 (0.01%)
Slovene: 55 (0.01%)
Trinidadian and Tobagonian: 55 (0.01%)
British West Indian: 49 (0.01%)
Icelander: 48 (0.01%)
New Zealander: 46 (0.01%)
Most common places of birth for foreign-born residents (%):
Mexico
Phoenix:
58.9% (187,661)
Arizona:
53.4% (500,086)
India
Phoenix:
4.6% (14,815)
Arizona:
4.5% (41,719)
Guatemala
Phoenix:
3.4% (10,706)
Arizona:
1.6% (14,556)
Philippines
Phoenix:
2.0% (6,442)
Arizona:
3.2% (30,378)
Vietnam
Phoenix:
1.7% (5,390)
Arizona:
2.1% (19,199)
Canada
Phoenix:
1.6% (5,053)
Arizona:
4.3% (40,102)
Cuba
Phoenix:
1.6% (5,048)
Arizona:
1.0% (8,899)
Iraq
Phoenix:
1.6% (4,975)
Arizona:
1.0% (9,335)
Place of birth for U.S.-born residents:
This state: 676,443
Other state: 620,161
Northeast: 93,233
Midwest: 201,401
South: 95,645
West: 229,882
86.3% of Phoenix residents lived in the same house 1 years ago. Out of people who lived in different houses, 41.5% lived in this county. Out of people who lived in different counties, 19.2% lived in Arizona.
Phoenix:
86.3%
State average:
86.0%
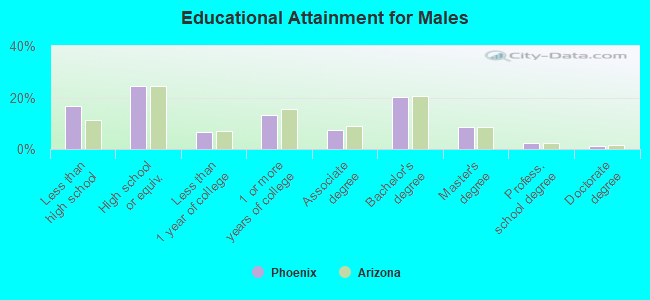
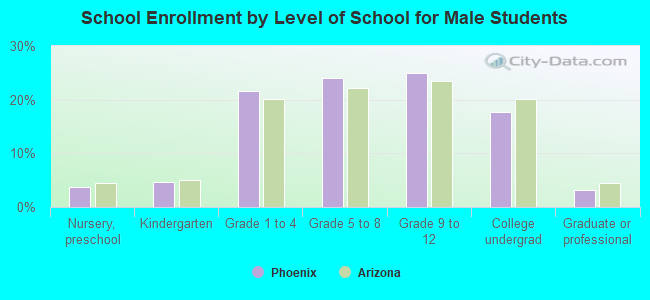
Education attainment for males 25 years and older:
No schooling: 16,087
Nursery to 4th grade: 4,145
5th and 6th grade: 12,268
7th and 8th grade: 8,923
9th grade: 13,066
10th grade: 8,834
11th grade: 8,273
12th grade, no diploma: 17,794
High school graduate (or equivalency): 131,365
Less than 1 year of college: 36,120
Some college more than 1 year, no degree: 70,670
Associate degree: 40,639
Bachelor's degree: 108,259
Master's degree: 45,562
Professional school degree: 11,891
Doctorate degree: 7,151
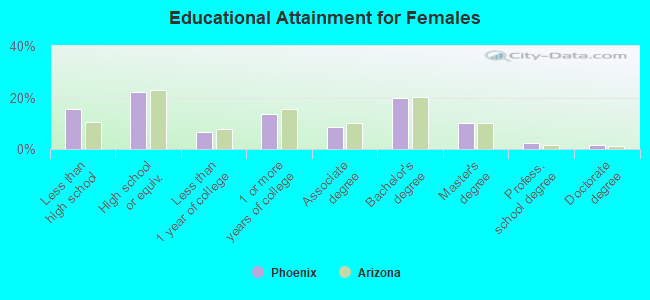
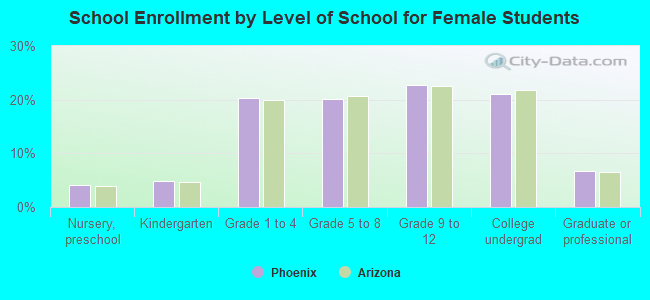
Education attainment for females 25 years and older:
No schooling: 18,077
Nursery to 4th grade: 4,721
5th and 6th grade: 12,552
7th and 8th grade: 10,123
9th grade: 9,108
10th grade: 6,804
11th grade: 8,542
12th grade, no diploma: 15,019
High school graduate (or equivalency): 122,688
Less than 1 year of college: 36,992
Some college more than 1 year, no degree: 75,161
Associate degree: 46,276
Bachelor's degree: 109,344
Master's degree: 54,785
Professional school degree: 11,829
Doctorate degree: 7,865
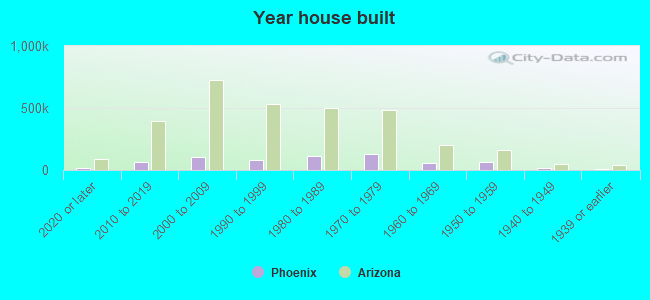
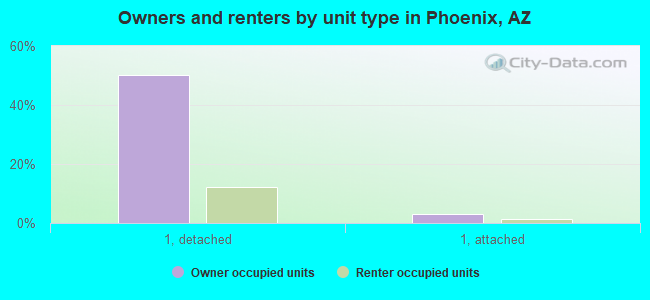
Housing units in structures:
One, detached: 401,736
One, attached: 29,660
Two: 11,160
3 or 4: 30,310
5 to 9: 29,406
10 to 19: 37,391
20 to 49: 22,221
50 or more: 76,667
Mobile homes: 17,723
Boats, RVs, vans, etc.: 961
Median worth of mobile homes: $44,500
Housing units lacking complete plumbing facilities in 2022: 1.0%
Housing units lacking complete kitchen facilities in 2022: 1.3%