Russellville, AR (Arkansas) Houses and Residents
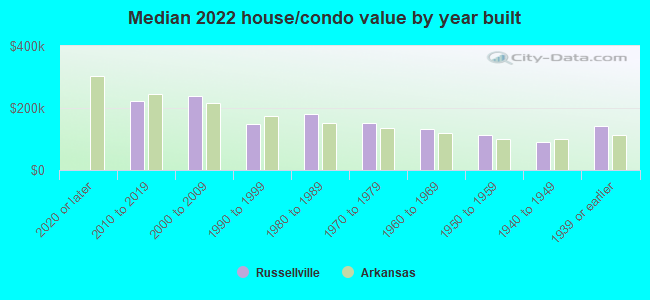
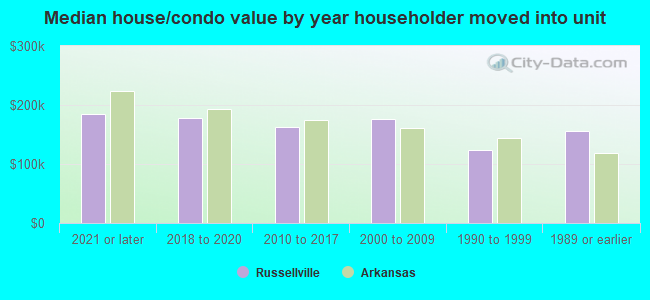
| Russellville: | $172,604 |
| Arkansas: | $179,800 |
Total population: 28,993 (Urban population: 22,395 (all inside urban clusters), Rural population: 1,274 (all nonfarm))
Houses: 12,092 (10,606 occupied: 6,364 owner occupied, 4,455 renter occupied)
| % of renters here: | 41% |
| State: | 34% |
Housing density: 466 houses/condos per square mile
Median price asked for vacant for-sale houses and condos in 2022: $145,772.
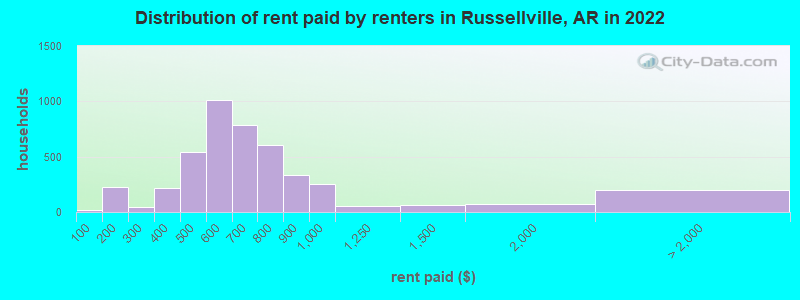
Median contract rent in 2022: $602 (lower quartile is $497, upper quartile is $766)
Median rent asked for vacant for-rent units in 2022: $463
Median gross rent in Russellville, AR in 2022: $764
Housing units in Russellville with a mortgage: 3,971 (159 second mortgage, 0 home equity loan, 68 both second mortgage and home equity loan)
Houses without a mortgage: 0
Median household income for houses/condos with a mortgage: $58,850
Median household income for apartments without a mortgage: $44,490
Median monthly housing costs: $781
Compare current foreclosures in Russellville, AR:
| Photo | Address | Area | Beds / Baths | Price | Details |
|---|---|---|---|---|---|

|
#1
S Arlington Ave
Russellville, AR 72801
|
2,036 sq. feet
|
2 baths 3 beds |
show details | |

|
#2
Us Highway 64 W
Russellville, AR 72802
|
1,271 sq. feet
|
2 baths - beds |
show details | |

|
#3
Martin Circle Dr
Russellville, AR 72802
|
2,816 sq. feet
|
2 baths - beds |
show details | |

|
#4
Ball Hill Rd
Russellville, AR 72802
|
690 sq. feet
|
1 baths - beds |
show details | |

|
#5
E K Pl
Russellville, AR 72801
|
1,357 sq. feet
|
2 baths - beds |
show details | |

|
#6
S Greenwich Ave
Russellville, AR 72801
|
1,223 sq. feet
|
2 baths - beds |
show details | |

|
#7
High Acres Dr
Russellville, AR 72802
|
2,616 sq. feet
|
2 baths - beds |
show details | |

|
#8
Heflin Hill Ln
Russellville, AR 72802
|
1,176 sq. feet
|
1 baths - beds |
show details | |

|
#9
E 14th St
Russellville, AR 72801
|
1,644 sq. feet
|
2 baths - beds |
show details | |

|
#10
E 14th St
Russellville, AR 72801
|
1,272 sq. feet
|
2 baths - beds |
show details |
| Photo | Address | Area | Beds / Baths | Price | Details |
|---|---|---|---|---|---|

|
#11
Honeysuckle Ln
Russellville, AR 72801
|
1,412 sq. feet
|
2 baths - beds |
show details | |

|
#12
Bakers Creek Rd
Russellville, AR 72802
|
1,568 sq. feet
|
1 baths - beds |
show details | |

|
#13
N Mobile Cv
Russellville, AR 72801
|
1,483 sq. feet
|
2 baths - beds |
show details | |

|
#14
N Mobile Cv
Russellville, AR 72801
|
1,189 sq. feet
|
2 baths - beds |
show details | |

|
#15
N Hastings Ave
Russellville, AR 72801
|
2,468 sq. feet
|
3 baths - beds |
show details | |

|
#16
E Holly St
Russellville, AR 72802
|
1,050 sq. feet
|
1 baths - beds |
show details | |

|
#17
E 15th St
Russellville, AR 72802
|
1,271 sq. feet
|
2 baths - beds |
show details | |

|
#18
E Date St
Russellville, AR 72802
|
1,584 sq. feet
|
2 baths - beds |
show details | |

|
#19
E K St
Russellville, AR 72801
|
1,664 sq. feet
|
1 baths - beds |
show details | |

|
#20
Us Highway 64 W
Russellville, AR 72802
|
1,290 sq. feet
|
1 baths - beds |
show details |
| Photo | Address | Area | Beds / Baths | Price | Details |
|---|---|---|---|---|---|

|
#21
E 23rd St
Russellville, AR 72802
|
1,008 sq. feet
|
2 baths - beds |
show details | |

|
#22
Ashbrook Ln
Russellville, AR 72802
|
1,835 sq. feet
|
2 baths - beds |
show details | |

|
#23
Cagle Rock Cir
Russellville, AR 72802
|
3,646 sq. feet
|
2 baths - beds |
show details | |

|
#24
Parker Rd Apt C
Russellville, AR 72801
|
- sq. feet
|
- baths - beds |
show details | |

|
#25
High Acres Dr
Russellville, AR 72802
|
- sq. feet
|
- baths - beds |
show details | |

|
#26
Stoneridge Cir
Russellville, AR 72802
|
- sq. feet
|
- baths - beds |
show details | |

|
#27
Sims Hollow Rd
Russellville, AR 72802
|
- sq. feet
|
- baths - beds |
show details | |

|
#28
Ashbrook Ln
Russellville, AR 72802
|
- sq. feet
|
- baths - beds |
show details | |

|
#29
E 10th St
Russellville, AR 72801
|
- sq. feet
|
- baths - beds |
show details | |

|
#30
S Pittsburg Ave
Russellville, AR 72802
|
- sq. feet
|
- baths - beds |
show details |
| Photo | Address | Area | Beds / Baths | Price | Details |
|---|---|---|---|---|---|

|
#31
W C St
Russellville, AR 72801
|
- sq. feet
|
- baths - beds |
show details | |

|
#32
S Elmira Ave Apt 505
Russellville, AR 72802
|
- sq. feet
|
- baths - beds |
show details | |

|
#33
S Erie Ave
Russellville, AR 72801
|
- sq. feet
|
- baths - beds |
show details | |

|
#34
Shady Ln
Russellville, AR 72802
|
- sq. feet
|
- baths - beds |
show details | |

|
#35
Lake Ridge Dr
Russellville, AR 72802
|
- sq. feet
|
- baths - beds |
show details | |

|
#36
S Ithaca Cv
Russellville, AR 72802
|
- sq. feet
|
- baths - beds |
show details | |

|
#37
Swordfish Dr
Russellville, AR 72802
|
- sq. feet
|
- baths - beds |
show details | |

|
#38
Mills Way Ln
Russellville, AR 72802
|
- sq. feet
|
- baths - beds |
show details | |

|
#39
W 2nd Ct Apt C
Russellville, AR 72801
|
- sq. feet
|
- baths - beds |
show details | |

|
#40
S Arkansas Ave Apt B
Russellville, AR 72802
|
- sq. feet
|
- baths - beds |
show details |
| Photo | Address | Area | Beds / Baths | Price | Details |
|---|---|---|---|---|---|

|
#41
W C St
Russellville, AR 72801
|
- sq. feet
|
- baths - beds |
show details | |

|
#42
W 2nd Ct Apt 108
Russellville, AR 72801
|
- sq. feet
|
- baths - beds |
show details | |

|
#43
W 12th St Apt K8
Russellville, AR 72801
|
- sq. feet
|
- baths - beds |
show details | |

|
#44
Upper Mcguire Loop
Russellville, AR 72802
|
- sq. feet
|
- baths - beds |
show details | |

|
Check over 1 million property listings on Foreclosure.com!
|
browse all offers | |||

Latest news about housing in Russellville, AR collected exclusively by city-data.com from local newspapers, TV, and radio stations

 | Best Metro in Arkansas for Homestead Farm? (6 replies) |
| Russellville RENTAL HOUSES (0 replies) |
| Fleeing to Arkansas (76 replies) |
| Need a Russellville, AR area Rental House (1 reply) |
| Moving to Russellville AR Area - Need Rental House (0 replies) |
| Reasons to Steer People to Other States (31 replies) |

Median year apartment built: 1988
Household type by relationship:
Households: 29,204- Male householders: 4,682 (1,367 living alone), Female householders: 5,834 (2,118 living alone)
4,361 spouses (4,344 opposite-sex spouses), 764 unmarried partners, (685 opposite-sex unmarried partners), 7,480 children (6,964 natural, 259 adopted, 256 stepchildren), 607 grandchildren, 279 brothers or sisters, 315 parents, 203 foster children, 281 other relatives, 1,184 non-relatives
- In group quarters: 3,208
Size of family households: 2,767 2-persons, 1,325 3-persons, 1,181 4-persons, 608 5-persons, 220 6-persons, 124 7-or-more-persons.
Size of nonfamily households: 3,778 1-person, 651 2-persons, 140 3-persons, 9 4-persons.
3,514 married couples with children.
1,926 single-parent households (208 men, 1,718 women).
83.4% of residents of Russellville speak English at home.
13.6% of residents speak Spanish at home (65% speak English very well, 17% speak English well, 16% speak English not well, 2% don't speak English at all).
1.8% of residents speak other Indo-European language at home (97% speak English very well, 3% speak English well).
1.7% of residents speak Asian or Pacific Island language at home (65% speak English very well, 20% speak English well, 15% speak English not well).
0.1% of residents speak other language at home (100% speak English very well).
Foreign born population: 3,003 (10.3%)
(43.1% of them are naturalized citizens)
| Here: | 6.1 |
| State: | 6.1 |
| Here: | 4.2 |
| State: | 4.3 |
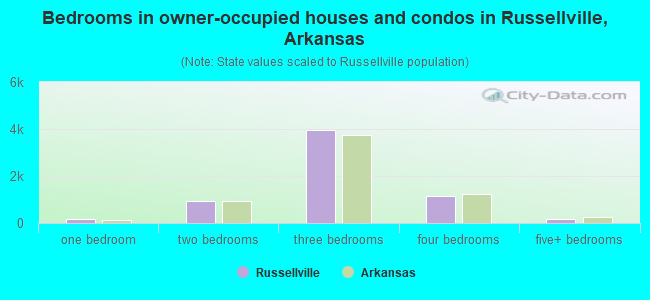
- Bedrooms in owner-occupied houses and condos in Russellville, Arkansas
- 0no bedroom
- 1491 bedroom
- 9322 bedrooms
- 3,9503 bedrooms
- 1,1534 bedrooms
- 1815+ bedrooms
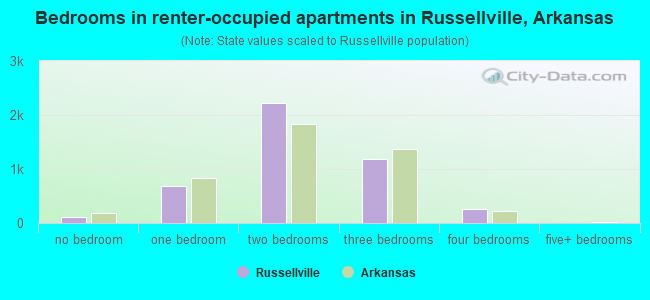
- Bedrooms in renter-occupied apartments in Russellville, Arkansas
- 107no bedroom
- 6781 bedroom
- 2,2292 bedrooms
- 1,1773 bedrooms
- 2624 bedrooms
- 35+ bedrooms
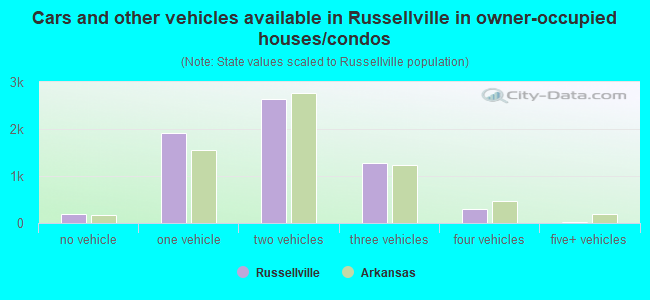
- Cars and other vehicles available in Russellville in owner-occupied houses/condos
- 202no vehicle
- 1,9131 vehicle
- 2,6312 vehicles
- 1,2823 vehicles
- 3074 vehicles
- 295+ vehicles
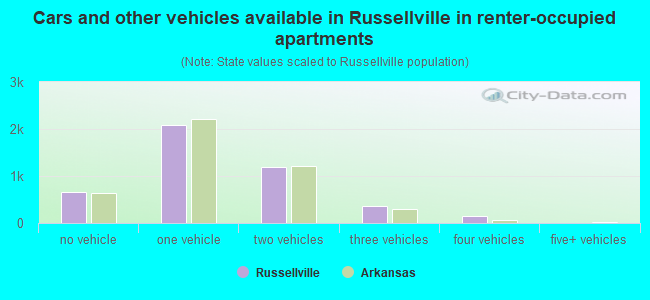
- Cars and other vehicles available in Russellville in renter-occupied apartments
- 654no vehicle
- 2,0911 vehicle
- 1,1982 vehicles
- 3573 vehicles
- 1564 vehicles
- 05+ vehicles
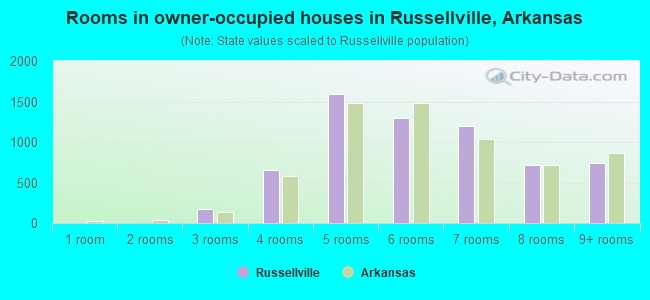
- Rooms in owner-occupied houses in Russellville, Arkansas
- 01 room
- 02 rooms
- 1733 rooms
- 6524 rooms
- 1,5895 rooms
- 1,3026 rooms
- 1,2007 rooms
- 7128 rooms
- 7379+ rooms
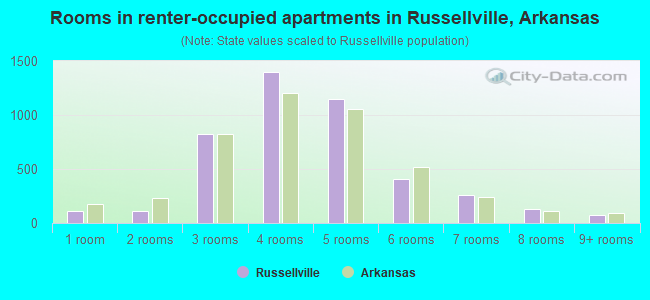
- Rooms in renter-occupied apartments in Russellville, Arkansas
- 1071 room
- 1112 rooms
- 8243 rooms
- 1,4004 rooms
- 1,1465 rooms
- 4116 rooms
- 2617 rooms
- 1268 rooms
- 709+ rooms
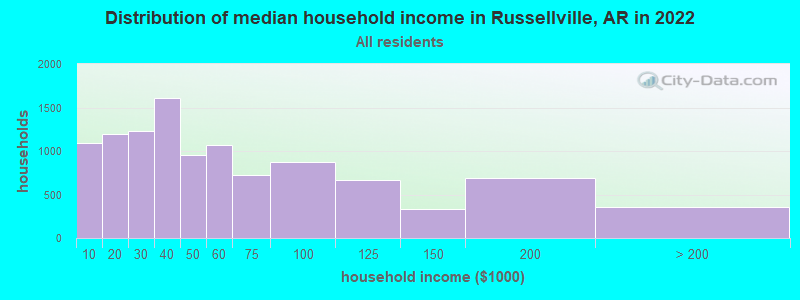
Russellville, AR household income distribution

- 1,097Less than $10,000
- 1,194$10,000 to $19,999
- 1,232$20,000 to $29,999
- 1,614$30,000 to $39,999
- 959$40,000 to $49,999
- 1,072$50,000 to $59,999
- 729$60,000 to $74,999
- 879$75,000 to $99,999
- 662$100,000 to $124,999
- 334$125,000 to $149,999
- 687$150,000 to $199,999
- 351$200,000 or more
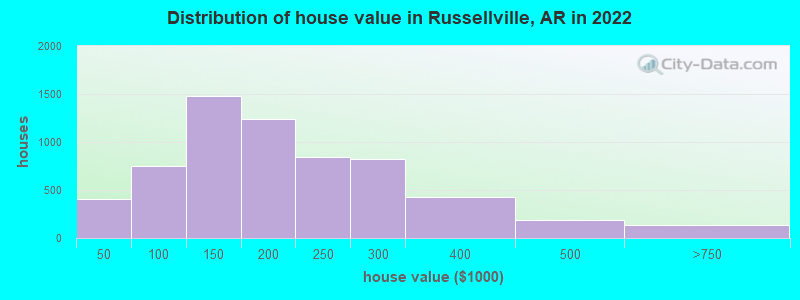
Home value of owner - occupied houses in 2022 in Russellville, AR
-
- 207Less than $10,000
- 37$10,000 to $14,999
- 64$15,000 to $19,999
- 14$20,000 to $24,999
- 34$25,000 to $29,999
- 34$30,000 to $34,999
- 15$40,000 to $49,999
- 93$50,000 to $59,999
- 77$60,000 to $69,999
- 106$70,000 to $79,999
- 268$80,000 to $89,999
- 183$90,000 to $99,999
- 1,052$100,000 to $124,999
- 428$125,000 to $149,999
- 804$150,000 to $174,999
- 429$175,000 to $199,999
- 839$200,000 to $249,999
- 819$250,000 to $299,999
- 422$300,000 to $399,999
- 188$400,000 to $499,999
- 136$500,000 to $749,999
Rent paid by renters in 2022 in Russellville, AR
-
- 19Less than $100
- 77$100 to $149
- 148$150 to $199
- 16$200 to $249
- 31$250 to $299
- 197$300 to $349
- 15$350 to $399
- 226$400 to $449
- 312$450 to $499
- 598$500 to $549
- 412$550 to $599
- 345$600 to $649
- 440$650 to $699
- 226$700 to $749
- 379$750 to $799
- 338$800 to $899
- 249$900 to $999
- 54$1,000 to $1,249
- 65$1,250 to $1,499
- 69$1,500 to $1,999
- 7$2,000 to $2,499
- 193No cash rent
Percentage of workers working in this county: 84.2%
Number of people working at home: 604 (4.7% of all workers)
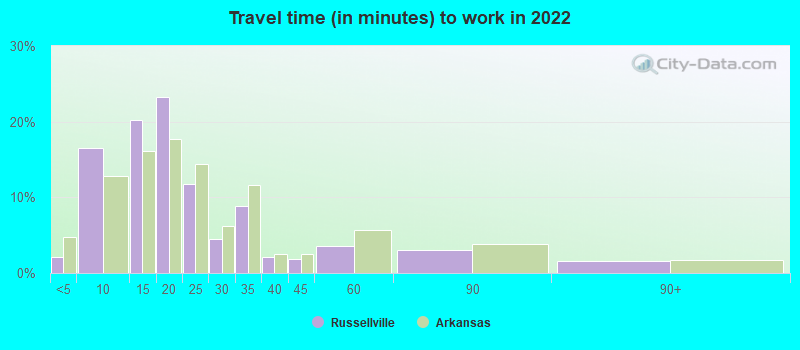
Travel time to work (commute)
- Less than 5 minutes: 555
- 5 to 9 minutes: 3,452
- 10 to 14 minutes: 3,245
- 15 to 19 minutes: 2,179
- 20 to 24 minutes: 590
- 25 to 29 minutes: 291
- 30 to 34 minutes: 676
- 35 to 39 minutes: 92
- 40 to 44 minutes: 25
- 45 to 59 minutes: 328
- 60 to 89 minutes: 437
- 90 or more minutes: 173

Means of transportation to work:
- Drove a car alone: 18,079 (81.9%)
- Carpooled: 2,168 (9.8%)
- Bus: 43 (0.2%)
- Taxi: 436 (2.0%)
- Bicycle: 6 (0.0%)
- Walked: 406 (1.8%)
- Worked at home: 604 (2.7%)
- Unemployment by race in 2022
- Unemployment rate for White non-Hispanic residents
- 5.5%Males
- 6.2%Females
- Unemployment rate for Black residents
- 6.9%Females
- Unemployment rate for other race residents
- 2.7%Males
- Unemployment rate for two or more race residents
- 15.0%Males
- 4.4%Females
- Unemployment rate for Hispanic or Latino residents
- 1.1%Males
- 1.2%Females
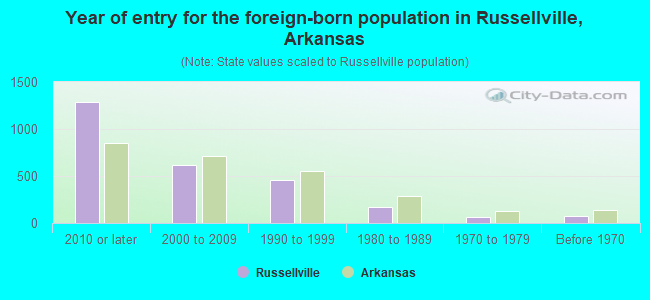
- Year of entry for the foreign-born population in Russellville, Arkansas
- 1,2832010 or later
- 6132000 to 2009
- 4581990 to 1999
- 1681980 to 1989
- 631970 to 1979
- 74Before 1970
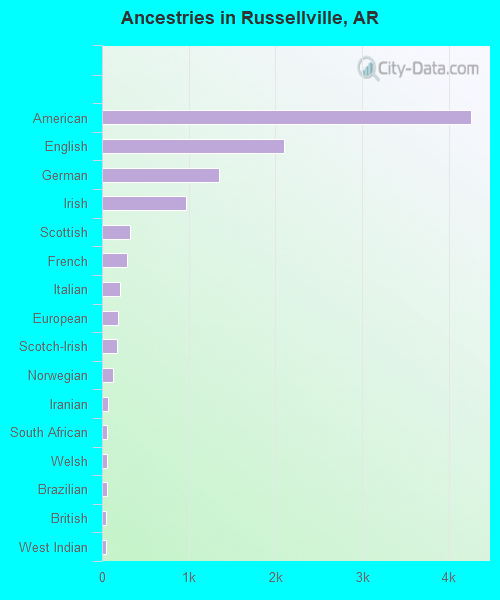
First ancestries reported:
- American: 4,250 (26.8%)
- English: 2,096 (13.2%)
- German: 1,350 (8.5%)
- Irish: 970 (6.1%)
- Scottish: 326 (2.1%)
- French: 288 (1.8%)
- Italian: 207 (1.3%)
- European: 184 (1.2%)
- Scotch-Irish: 171 (1.1%)
- Norwegian: 122 (0.8%)
- Iranian: 71 (0.4%)
- South African: 55 (0.3%)
- Welsh: 55 (0.3%)
- Brazilian: 52 (0.3%)
- British: 45 (0.3%)
- West Indian: 42 (0.3%)
- Scandinavian: 38 (0.2%)
- French Canadian: 36 (0.2%)
- Polish: 23 (0.1%)
- Hungarian: 22 (0.1%)
- Northern European: 22 (0.1%)
- Czechoslovakian: 17 (0.1%)
- Yugoslavian: 10 (0.06%)
- Ugandan: 9 (0.06%)
- Arab: 6 (0.04%)
- Celtic: 5 (0.03%)
- African: 2 (0.01%)
Most common places of birth for foreign-born residents (%):
| Russellville: | 48.7% (1,452) |
| Arkansas: | 40.2% (61,075) |
| Russellville: | 11.2% (333) |
| Arkansas: | 10.7% (16,210) |
| Russellville: | 8.6% (257) |
| Arkansas: | 1.1% (1,606) |
| Russellville: | 3.8% (114) |
| Arkansas: | 3.5% (5,376) |
| Russellville: | 3.7% (109) |
| Arkansas: | 2.3% (3,503) |
| Russellville: | 3.5% (103) |
| Arkansas: | 2.7% (4,028) |
| Russellville: | 2.3% (69) |
| Arkansas: | 0.3% (487) |
| Russellville: | 2.2% (66) |
| Arkansas: | 6.1% (9,278) |
| Russellville: | 2.2% (66) |
| Arkansas: | 0.5% (755) |
| Russellville: | 2.1% (64) |
| Arkansas: | 0.1% (201) |
| Russellville: | 1.8% (53) |
| Arkansas: | 1.0% (1,447) |
| Russellville: | 1.5% (45) |
| Arkansas: | 0.6% (889) |
Place of birth for U.S.-born residents:
- This state: 16,239
- Other state: 9,712
- Northeast: 716
- Midwest: 2,115
- South: 4,220
- West: 2,704
81.9% of Russellville residents lived in the same house 1 years ago.
Out of people who lived in different houses, 28.3% lived in this county.
Out of people who lived in different counties, 80.7% lived in Arkansas.
| Russellville: | 81.9% |
| State average: | 87.0% |
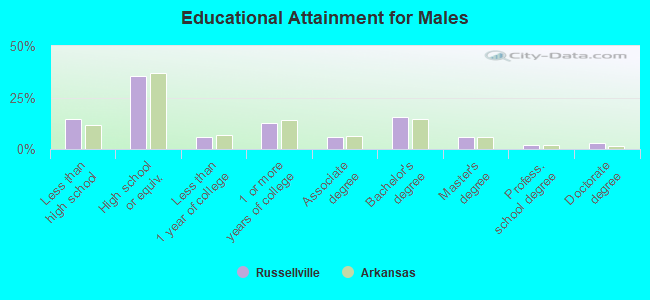
Education attainment for males 25 years and older:
- No schooling: 102
- Nursery to 4th grade: 137
- 5th and 6th grade: 90
- 7th and 8th grade: 47
- 9th grade: 78
- 10th grade: 158
- 11th grade: 168
- 12th grade, no diploma: 337
- High school graduate (or equivalency): 2,734
- Less than 1 year of college: 449
- Some college more than 1 year, no degree: 986
- Associate degree: 463
- Bachelor's degree: 1,197
- Master's degree: 443
- Professional school degree: 139
- Doctorate degree: 235
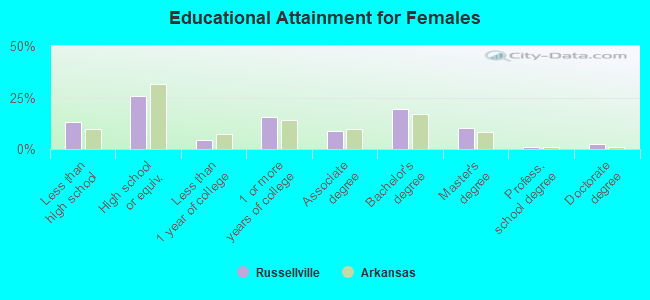
Education attainment for females 25 years and older:
- No schooling: 85
- Nursery to 4th grade: 16
- 5th and 6th grade: 263
- 7th and 8th grade: 93
- 9th grade: 95
- 10th grade: 122
- 11th grade: 274
- 12th grade, no diploma: 255
- High school graduate (or equivalency): 2,343
- Less than 1 year of college: 394
- Some college more than 1 year, no degree: 1,403
- Associate degree: 794
- Bachelor's degree: 1,759
- Master's degree: 950
- Professional school degree: 78
- Doctorate degree: 223


Housing units in structures:
- One, detached: 7,996
- One, attached: 227
- Two: 527
- 3 or 4: 1,102
- 5 to 9: 932
- 10 to 19: 501
- 20 to 49: 164
- 50 or more: 253
- Mobile homes: 385
Median worth of mobile homes: $11,348
Housing units lacking complete kitchen facilities in 2022: 4.7%
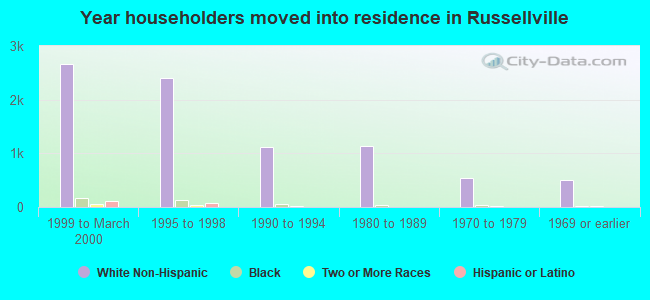
House/condo owner moved in on average 8 years ago
Renter moved in on average 3 years ago
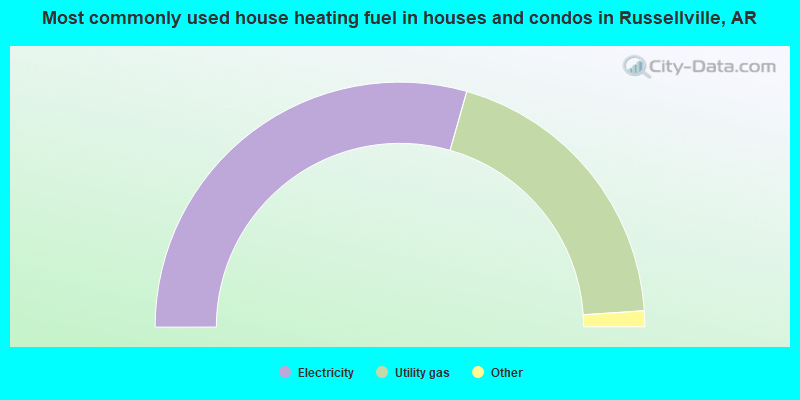
- 58.8%Electricity
- 39.1%Utility gas
- 1.6%Bottled, tank, or LP gas
- 0.5%Fuel oil, kerosene, etc.
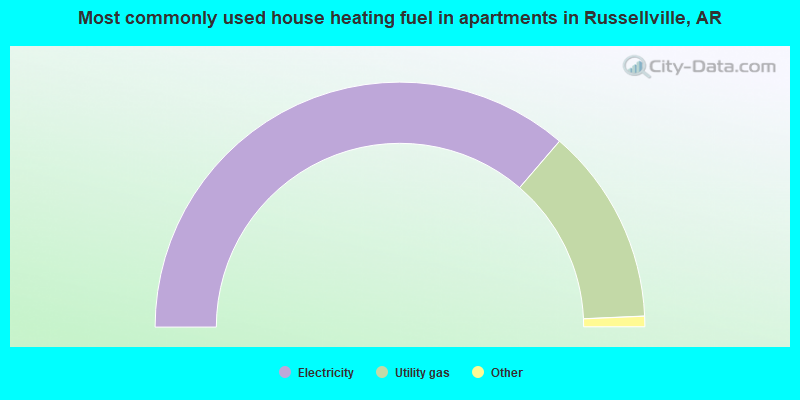
- 72.6%Electricity
- 26.0%Utility gas
- 1.3%Bottled, tank, or LP gas
- 0.1%No fuel used
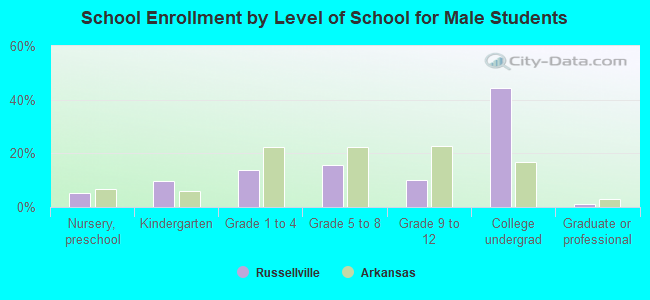
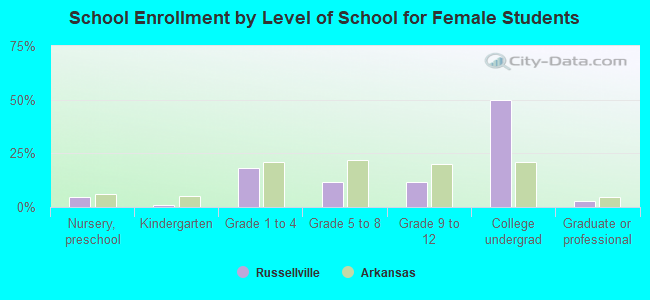
Private vs. public school enrollment:
| Here: | 1.4% |
| Arkansas: | 10.5% |
| Here: | 5.4% |
| Arkansas: | 8.7% |
| Here: | 14.4% |
| Arkansas: | 19.4% |