Sioux City, IA (Iowa) Houses and Residents
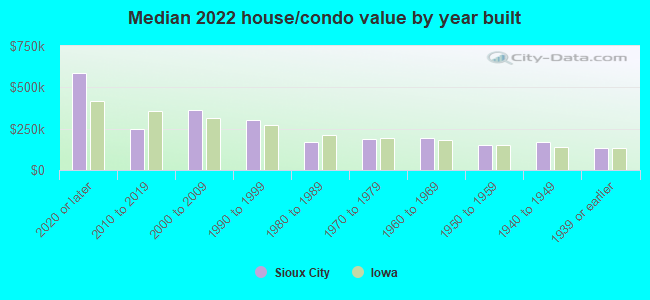
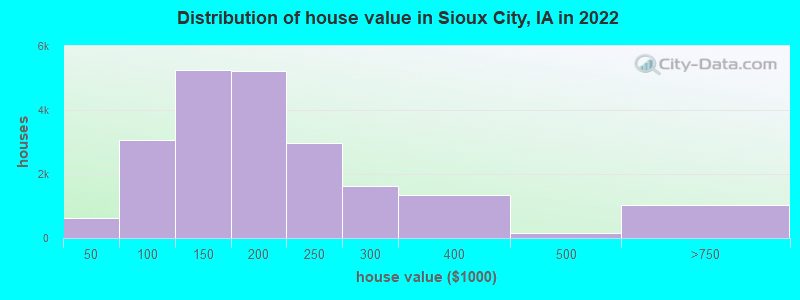
Estimated median house or condo value in 2022: $168,300 (it was $73,100 in 2000 )
Sioux City:
$168,300Iowa:
$194,600
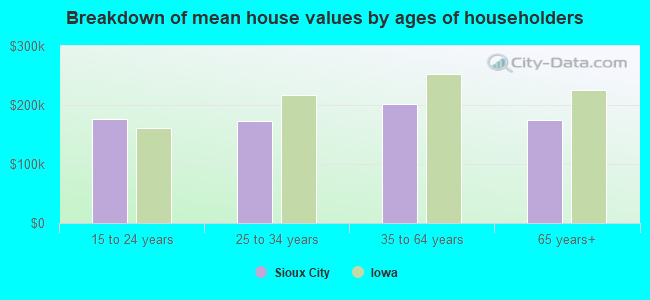
Lower value quartile - upper value quartile: $114,300 - $230,700Mean price in 2022: Detached houses: $180,849 Here:
$180,849State:
$245,224
Townhouses or other attached units: $188,875 Here:
$188,875State:
$238,767
In 2-unit structures: $150,171 Here:
$150,171State:
$243,070
In 3-to-4-unit structures: $115,801 Here:
$115,801State:
$162,139
In 5-or-more-unit structures: $254,869 Here:
$254,869State:
$190,519
Mobile homes: $56,396 Here:
$56,396State:
$51,271
Total population: 82,517 (All urban)
Houses: 35,092 (33,053 occupied: 21,185 owner occupied, 11,868 renter occupied )
% of renters here:
36%State:
28%
Housing density: 640 houses/condos per square mile
Median price asked for vacant for-sale houses and condos in 2022: $98,763.
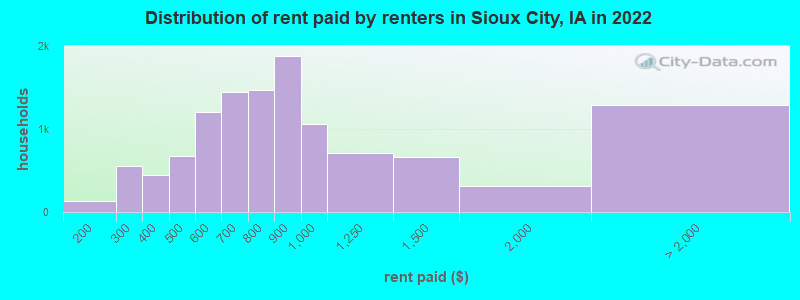
Median contract rent in 2022: $784 (lower quartile is $584, upper quartile is $955)
Median rent asked for vacant for-rent units in 2022: $1,251
Median gross rent in Sioux City, IA in 2022: $903
Housing units in Sioux City with a mortgage: 12,414 (827 second mortgage, 162 home equity loan, 554 both second mortgage and home equity loan )Houses without a mortgage: 142
Median household income for houses/condos with a mortgage: $93,599
Median household income for apartments without a mortgage: $68,079
Median monthly housing costs: $914
Data:
Median house or condo value ($)
Median house or condo value ($ change since 2000)
Median house or condo value ($) - White
Median house or condo value ($) - Black or African American
Median house or condo value ($) - Asian
Median house or condo value ($) - Hispanic or Latino
Median house or condo value ($) - American Indian and Alaska Native
Median house or condo value ($) - Multirace
Median house or condo value ($) - Other Race
Median price asked for mobile homes ($)
Household density (households per square mile)
Mean house or condo value by units in structure - 1, detached ($)
Mean house or condo value by units in structure - 1, attached ($)
Mean house or condo value by units in structure - 2 ($)
Mean house or condo value by units in structure by units in structure - 3 or 4 ($)
Mean house or condo value by units in structure - 5 or more ($)
Mean house or condo value by units in structure - Boat, RV, van, etc. ($)
Mean house or condo value by units in structure - Mobile home ($)
Median contract rent ($)
Median contract rent - Lower quartile ($)
Median contract rent - Upper quartile ($)
Median gross rent ($)
Urban houses (%)
Rural houses (%)
Houses occupied (%)
Houses occupied (% change since 2000)
Houses owner occupied (%)
Houses owner occupied (% change since 2000)
Houses renter occupied (%)
Houses renter occupied (% change since 2000)
Vacant housing units - For rent (%)
Vacant housing units - For rent (% change since 2000)
Vacant housing units - For sale only (%)
Vacant housing units - For sale only (% change since 2000)
Vacant housing units - Rented or sold, not occupied (%)
Vacant housing units - Rented or sold, not occupied (% change since 2000)
Vacant housing units - For seasonal, recreational, or occasional use (%)
Vacant housing units - For seasonal, recreational, or occasional use (% change since 2000)
Vacant housing units - For migrant workers (%)
Vacant housing units - For migrant workers (% change since 2000)
Vacant housing units - Other vacant (%)
Vacant housing units - Other vacant (% change since 2000)
Median monthly housing costs ($)
Median household income for houses/condos with a mortgage ($)
Median household income for houses/condos without a mortgage ($)
Median household income ($)
Median household income ($) - White
Median household income ($) - Black or African American
Median household income ($) - Asian
Median household income ($) - Hispanic or Latino
Median household income ($) - American Indian and Alaska Native
Median household income ($) - Multirace
Median household income ($) - Other Race
Mortgage status - with mortgage (%)
Mortgage status - with second mortgage (%)
Mortgage status - with home equity loan (%)
Mortgage status - with both second mortgage and home equity loan (%)
Mortgage status - without a mortgage (%)
Median year house/condo built
Median year apartment built
Household type by relationship - Male householder living alone (%)
Household type by relationship - Male householder not living alone (%)
Household type by relationship - Female householder living alone (%)
Household type by relationship - Female householder not living alone (%)
Household type by relationship - Opposite-Sex spouse (%)
Household type by relationship - Same-Sex spouse (%)
Household type by relationship - Opposite-Sex unmarried partner (%)
Household type by relationship - Same-Sex unmarried partner (%)
Household type by relationship - In group quarters (%)
Size of family households - 2-person household (%)
Size of family households - 3-person household (%)
Size of family households - 4-person household (%)
Size of family households - 5-person household (%)
Size of family households - 6-person household (%)
Size of family households - 7-or-more-person household (%)
Size of nonfamily households - 1-person household (%)
Size of nonfamily households - 2-person household (%)
Size of nonfamily households - 3-person household (%)
Size of nonfamily households - 4-person household (%)
Size of nonfamily households - 5-person household (%)
Size of nonfamily households - 6-person household (%)
Size of nonfamily households - 7-or-moreperson household (%)
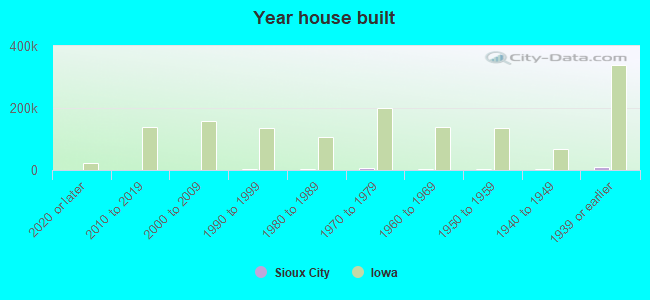
Year house built - Built 2010 or later (%)
Year house built - Built 2000 to 2009 (%)
Year house built - Built 1990 to 1999 (%)
Year house built - Built 1980 to 1989 (%)
Year house built - Built 1970 to 1979 (%)
Year house built - Built 1960 to 1969 (%)
Year house built - Built 1950 to 1959 (%)
Year house built - Built 1940 to 1949 (%)
Year house built - Built 1939 or earlier (%)
Median number of rooms in houses and condos
Median number of rooms in apartments
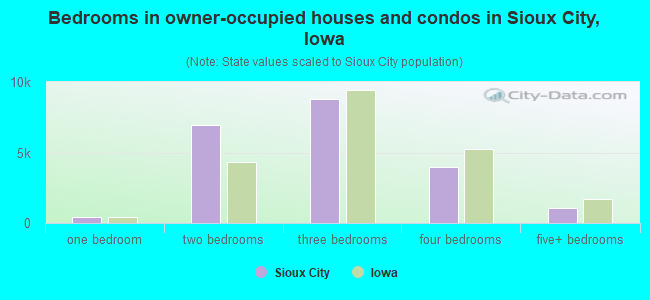
Median number of bedrooms in owner occupied houses
Mean number of bedrooms in owner occupied houses
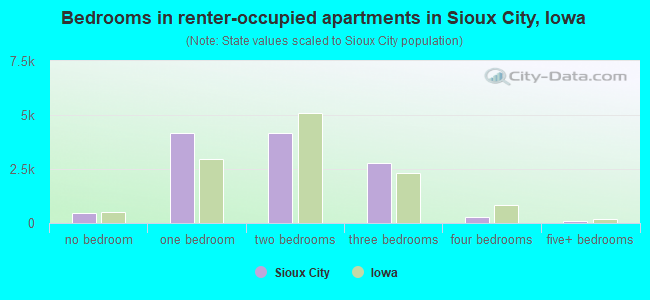
Median number of bedrooms in renter occupied houses
Mean number of bedrooms in renter occupied houses
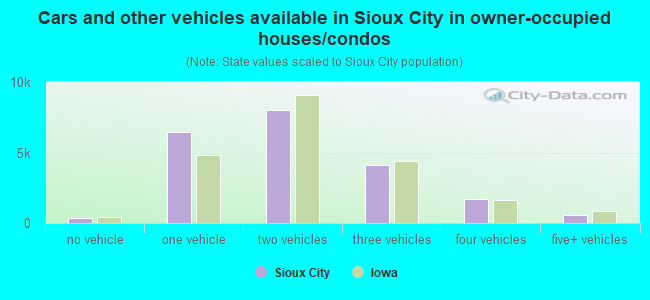
Median number of vehichles in owner occupied houses
Mean number of vehichles in owner occupied houses
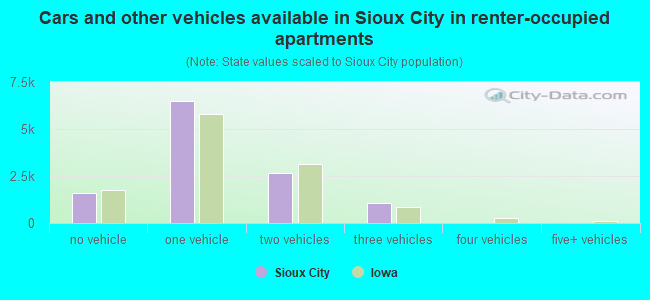
Median number of vehichles in renter occupied houses
Mean number of vehichles in renter occupied houses
Rooms in owner-occupied houses - 1 room (%)
Rooms in owner-occupied houses - 2 rooms (%)
Rooms in owner-occupied houses - 3 rooms (%)
Rooms in owner-occupied houses - 4 rooms (%)
Rooms in owner-occupied houses - 5 rooms (%)
Rooms in owner-occupied houses - 6 rooms (%)
Rooms in owner-occupied houses - 7 rooms (%)
Rooms in owner-occupied houses - 8 rooms (%)
Rooms in owner-occupied houses - 9+ rooms (%)
Rooms in renter-occupied houses - 1 room (%)
Rooms in renter-occupied houses - 2 rooms (%)
Rooms in renter-occupied houses - 3 rooms (%)
Rooms in renter-occupied houses - 4 rooms (%)
Rooms in renter-occupied houses - 5 rooms (%)
Rooms in renter-occupied houses - 6 rooms (%)
Rooms in renter-occupied houses - 7 rooms (%)
Rooms in renter-occupied houses - 8 rooms (%)
Rooms in renter-occupied houses - 9+ rooms (%)
Bedrooms in owner-occupied houses - no bedrooms (%)
Bedrooms in owner-occupied houses - 1 bedroom (%)
Bedrooms in owner-occupied houses - 2 bedrooms (%)
Bedrooms in owner-occupied houses - 3 bedrooms (%)
Bedrooms in owner-occupied houses - 4 bedrooms (%)
Bedrooms in owner-occupied houses - 5+ bedrooms (%)
Bedrooms in renter-occupied houses - no bedrooms (%)
Bedrooms in renter-occupied houses - 1 bedroom (%)
Bedrooms in renter-occupied houses - 2 bedrooms (%)
Bedrooms in renter-occupied houses - 3 bedrooms (%)
Bedrooms in renter-occupied houses - 4 bedrooms (%)
Bedrooms in renter-occupied houses - 5+ bedrooms (%)
Vehicles available in owner-occupied houses - no vehicle available (%)
Vehicles available in owner-occupied houses - 1 vehicle available(%)
Vehicles available in owner-occupied houses - 2 Vehicles available (%)
Vehicles available in owner-occupied houses - 3 Vehicles available (%)
Vehicles available in owner-occupied houses - 4 Vehicles available (%)
Vehicles available in owner-occupied houses - 5+ Vehicles available (%)
Vehicles available in renter-occupied houses - no vehicle available (%)
Vehicles available in renter-occupied houses - 1 vehicle available (%)
Vehicles available in renter-occupied houses - 2 Vehicles available (%)
Vehicles available in renter-occupied houses - 3 Vehicles available (%)
Vehicles available in renter-occupied houses - 4 Vehicles available (%)
Vehicles available in renter-occupied houses - 5+ Vehicles available (%)
Housing units in structures - 1, detached (%)
Housing units in structures - 1, attached (%)
Housing units in structures - 2 (%)
Housing units in structures - 3 or 4 (%)
Housing units in structures - 5 to 9 (%)
Housing units in structures - 10 to 19 (%)
Housing units in structures - 20 to 49 (%)
Housing units in structures - 50 or more (%)
Housing units in structures - Mobile home (%)
Housing units in structures - Boat, RV, van, etc. (%)
Housing units in structures - Owners - 1, detached (%)
Housing units in structures - Owners - 1, attached (%)
Housing units in structures - Owners - 2 (%)
Housing units in structures - Owners - 3 or 4 (%)
Housing units in structures - Owners - 5 to 9 (%)
Housing units in structures - Owners - 10 to 19 (%)
Housing units in structures - Owners - 20 to 49 (%)
Housing units in structures - Owners - 50 or more (%)
Housing units in structures - Owners - Mobile home (%)
Housing units in structures - Owners - Boat, RV, van, etc. (%)
Housing units in structures - Renters - 1, detached (%)
Housing units in structures - Renters - 1, attached (%)
Housing units in structures - Renters - 2 (%)
Housing units in structures - Renters - 3 or 4 (%)
Housing units in structures - Renters - 5 to 9 (%)
Housing units in structures - Renters - 10 to 19 (%)
Housing units in structures - Renters - 20 to 49 (%)
Housing units in structures - Renters - 50 or more (%)
Housing units in structures - Renters - Mobile home (%)
Housing units in structures - Renters - Boat, RV, van, etc. (%)
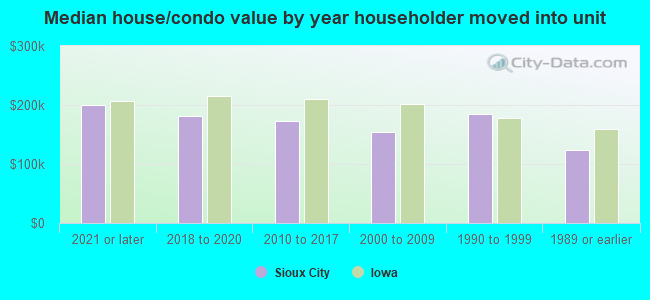
House/condo owner moved in on average (years ago)
Renter moved in on average (years ago)
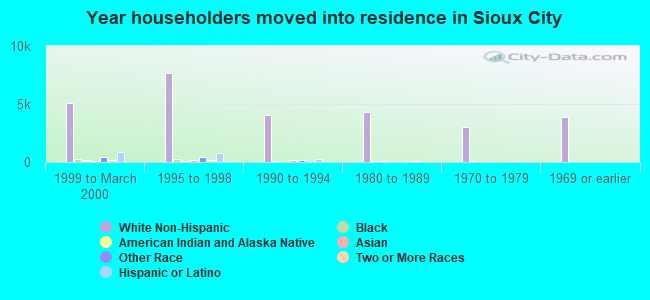
Year householder moved into unit - Moved in 1999 to March 2000 (%)
Year householder moved into unit - Moved in 1999 to March 2000 (%) - White
Year householder moved into unit - Moved in 1999 to March 2000 (%) - Black or African American
Year householder moved into unit - Moved in 1999 to March 2000 (%) - Asian
Year householder moved into unit - Moved in 1999 to March 2000 (%) - Hispanic or Latino
Year householder moved into unit - Moved in 1999 to March 2000 (%) - American Indian and Alaska Native
Year householder moved into unit - Moved in 1999 to March 2000 (%) - Multirace
Year householder moved into unit - Moved in 1999 to March 2000 (%) - Other Race
Year householder moved into unit - Moved in 1995 to 1998 (%)
Year householder moved into unit - Moved in 1995 to 1998 (%) - White
Year householder moved into unit - Moved in 1995 to 1998 (%) - Black or African American
Year householder moved into unit - Moved in 1995 to 1998 (%) - Asian
Year householder moved into unit - Moved in 1995 to 1998 (%) - Hispanic or Latino
Year householder moved into unit - Moved in 1995 to 1998 (%) - American Indian and Alaska Native
Year householder moved into unit - Moved in 1995 to 1998 (%) - Multirace
Year householder moved into unit - Moved in 1995 to 1998 (%) - Other Race
Year householder moved into unit - Moved in 1990 to 1994 (%)
Year householder moved into unit - Moved in 1990 to 1994 (%) - White
Year householder moved into unit - Moved in 1990 to 1994 (%) - Black or African American
Year householder moved into unit - Moved in 1990 to 1994 (%) - Asian
Year householder moved into unit - Moved in 1990 to 1994 (%) - Hispanic or Latino
Year householder moved into unit - Moved in 1990 to 1994 (%) - American Indian and Alaska Native
Year householder moved into unit - Moved in 1990 to 1994 (%) - Multirace
Year householder moved into unit - Moved in 1990 to 1994 (%) - Other Race
Year householder moved into unit - Moved in 1980 to 1989 (%)
Year householder moved into unit - Moved in 1980 to 1989 (%) - White
Year householder moved into unit - Moved in 1980 to 1989 (%) - Black or African American
Year householder moved into unit - Moved in 1980 to 1989 (%) - Asian
Year householder moved into unit - Moved in 1980 to 1989 (%) - Hispanic or Latino
Year householder moved into unit - Moved in 1980 to 1989 (%) - American Indian and Alaska Native
Year householder moved into unit - Moved in 1980 to 1989 (%) - Multirace
Year householder moved into unit - Moved in 1980 to 1989 (%) - Other Race
Year householder moved into unit - Moved in 1970 to 1979 (%)
Year householder moved into unit - Moved in 1970 to 1979 (%) - White
Year householder moved into unit - Moved in 1970 to 1979 (%) - Black or African American
Year householder moved into unit - Moved in 1970 to 1979 (%) - Asian
Year householder moved into unit - Moved in 1970 to 1979 (%) - Hispanic or Latino
Year householder moved into unit - Moved in 1970 to 1979 (%) - American Indian and Alaska Native
Year householder moved into unit - Moved in 1970 to 1979 (%) - Multirace
Year householder moved into unit - Moved in 1970 to 1979 (%) - Other Race
Year householder moved into unit - Moved in 1969 or earlier (%)
Year householder moved into unit - Moved in 1969 or earlier (%) - White
Year householder moved into unit - Moved in 1969 or earlier (%) - Black or African American
Year householder moved into unit - Moved in 1969 or earlier (%) - Asian
Year householder moved into unit - Moved in 1969 or earlier (%) - Hispanic or Latino
Year householder moved into unit - Moved in 1969 or earlier (%) - American Indian and Alaska Native
Year householder moved into unit - Moved in 1969 or earlier (%) - Multirace
Year householder moved into unit - Moved in 1969 or earlier (%) - Other Race
Housing units lacking complete plumbing facilities (%)
Housing units lacking complete kitchen facilities (%)
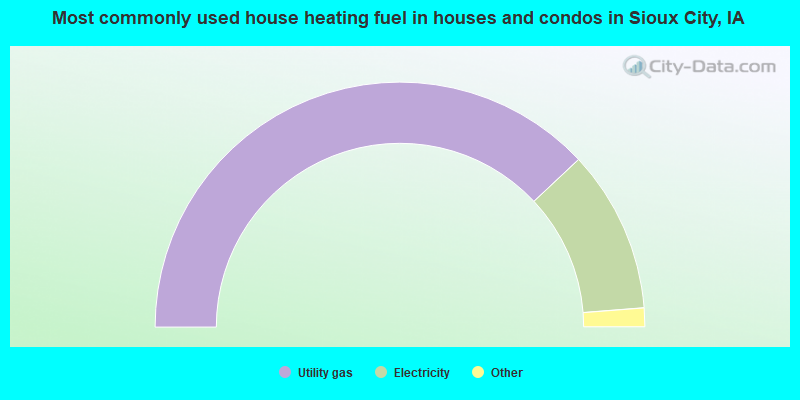
House heating fuel used in houses and condos - Utility gas (%)
House heating fuel used in houses and condos - Bottled, tank, or LP gas (%)
House heating fuel used in houses and condos - Electricity (%)
House heating fuel used in houses and condos - Fuel oil, kerosene, etc. (%)
House heating fuel used in houses and condos - Coal or coke (%)
House heating fuel used in houses and condos - Wood (%)
House heating fuel used in houses and condos - Solar energy (%)
House heating fuel used in houses and condos - Other fuel (%)
House heating fuel used in houses and condos - No fuel used (%)
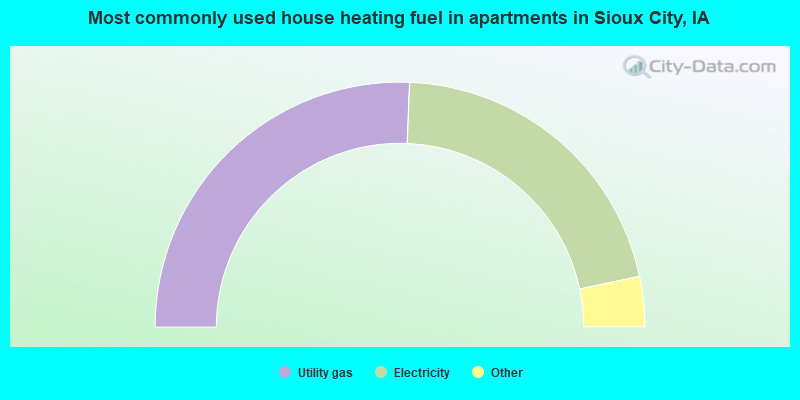
House heating fuel used in apartments - Utility gas (%)
House heating fuel used in apartments - Bottled, tank, or LP gas (%)
House heating fuel used in apartments - Electricity (%)
House heating fuel used in apartments - Fuel oil, kerosene, etc. (%)
House heating fuel used in apartments - Coal or coke (%)
House heating fuel used in apartments - Wood (%)
House heating fuel used in apartments - Solar energy (%)
House heating fuel used in apartments - Other fuel (%)
House heating fuel used in apartments - No fuel used (%)
Median year house/condo built: 1955Median year apartment built: 1970Household type by relationship:
Households: 83,215
Male householders: 13,382 (4,986 living alone ), Female householders: 19,671 (6,406 living alone )12,739 spouses (12,598 opposite-sex spouses ), 2,472 unmarried partners , (2,472 opposite-sex unmarried partners ), 24,855 children (24,184 natural , 40 adopted , 631 stepchildren ), 1,760 grandchildren , 1,836 brothers or sisters , 1,052 parents , 0 foster children , 945 other relatives , 1,989 non-relatives In group quarters: 2,514
Size of family households: 9,576 2-persons , 3,647 3-persons , 3,015 4-persons , 2,240 5-persons , 406 6-persons , 392 7-or-more-persons .
Size of nonfamily households: 11,392 1-person , 2,199 2-persons , 127 3-persons , 59 4-persons .
11,797 married couples with children. single-parent households (949 men , 6,162 women ).
78.1% of residents of Sioux City speak English at home. of residents speak Spanish at home (54% speak English very well , 16% speak English well , 25% speak English not well , 5% don't speak English at all ).of residents speak other Indo-European language at home (53% speak English very well , 40% speak English well , 7% speak English not well ).of residents speak Asian or Pacific Island language at home (37% speak English very well , 16% speak English well , 34% speak English not well , 13% don't speak English at all ).of residents speak other language at home (65% speak English very well , 23% speak English well , 12% don't speak English at all ).
Foreign born population: 8,336 (10.0%)of them are naturalized citizens )
Median number of rooms in houses and condos:
Median number of rooms in apartments
Owner-occupied Renter-occupied
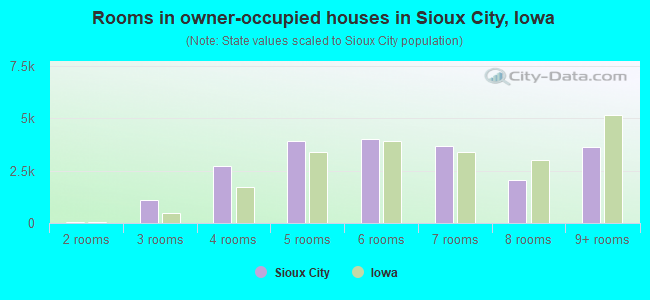
Rooms in owner-occupied houses in Sioux City, Iowa
0 1 room 41 2 rooms 1,081 3 rooms 2,739 4 rooms 3,932 5 rooms 4,001 6 rooms 3,677 7 rooms 2,075 8 rooms 3,639 9+ rooms
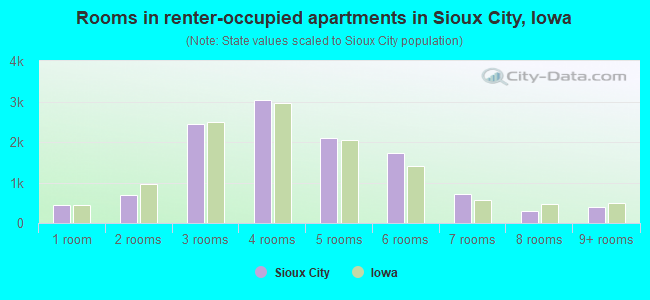
Rooms in renter-occupied apartments in Sioux City, Iowa
453 1 room 698 2 rooms 2,441 3 rooms 3,025 4 rooms 2,092 5 rooms 1,736 6 rooms 721 7 rooms 297 8 rooms 405 9+ rooms
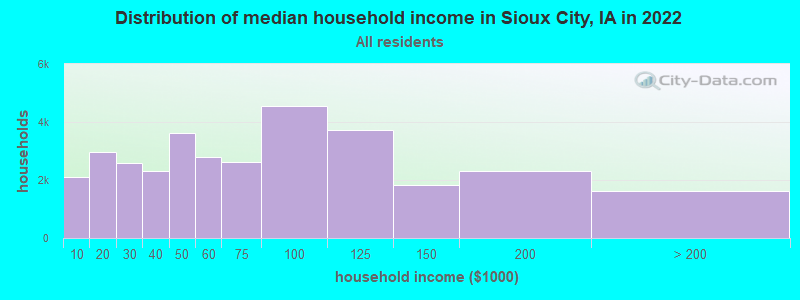
Sioux City, IA household income distribution 2,093 Less than $10,0002,973 $10,000 to $19,9992,583 $20,000 to $29,9992,322 $30,000 to $39,9993,633 $40,000 to $49,9992,794 $50,000 to $59,9992,630 $60,000 to $74,9994,541 $75,000 to $99,9993,734 $100,000 to $124,9991,811 $125,000 to $149,9992,307 $150,000 to $199,9991,632 $200,000 or more
Home value of owner - occupied houses in 2022 in Sioux City, IA 211 Less than $10,00069 $10,000 to $14,99925 $15,000 to $19,999166 $20,000 to $24,99941 $35,000 to $39,999109 $40,000 to $49,999424 $50,000 to $59,999627 $60,000 to $69,999898 $70,000 to $79,999673 $80,000 to $89,999347 $90,000 to $99,9992,975 $100,000 to $124,9992,280 $125,000 to $149,9992,387 $150,000 to $174,9992,835 $175,000 to $199,9992,964 $200,000 to $249,9991,637 $250,000 to $299,9991,349 $300,000 to $399,999142 $400,000 to $499,999977 $500,000 to $749,99949 $1,000,000 to $1,499,999Rent paid by renters in 2022 in Sioux City, IA 13 Less than $10071 $100 to $14967 $150 to $199316 $200 to $249238 $250 to $299225 $300 to $349225 $350 to $399113 $400 to $449562 $450 to $499479 $500 to $549731 $550 to $5991,315 $600 to $649129 $650 to $699420 $700 to $7491,044 $750 to $7991,875 $800 to $8991,066 $900 to $999707 $1,000 to $1,249667 $1,250 to $1,499319 $1,500 to $1,999424 $2,000 to $2,499208 $3,500 or more654 No cash rent
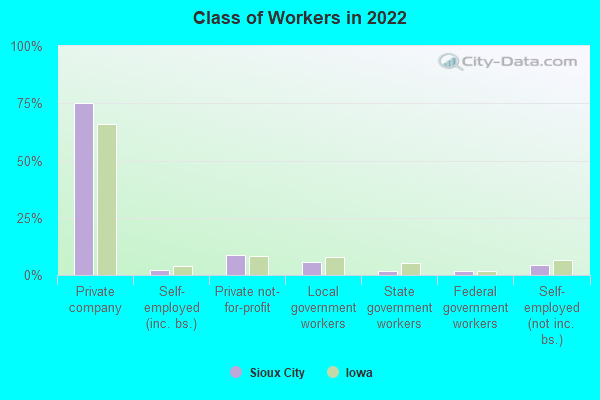
Percentage of workers working in this county: 71.5%Number of people working at home: 1,693 (4.1% of all workers )
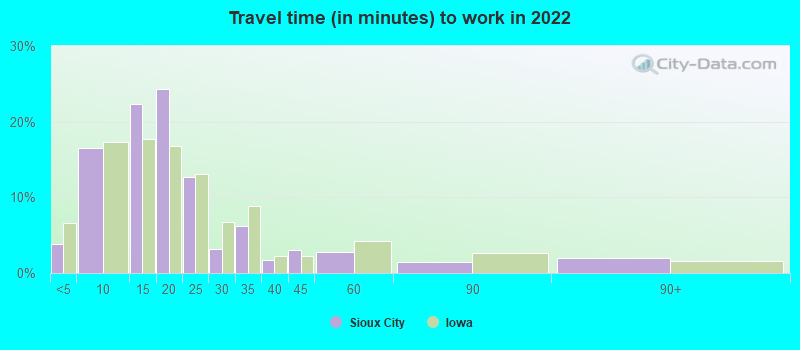
Travel time to work (commute)
Less than 5 minutes: 1,3415 to 9 minutes: 5,69210 to 14 minutes: 9,45815 to 19 minutes: 9,33620 to 24 minutes: 7,22225 to 29 minutes: 1,25230 to 34 minutes: 1,10235 to 39 minutes: 30540 to 44 minutes: 045 to 59 minutes: 51460 to 89 minutes: 41290 or more minutes: 586
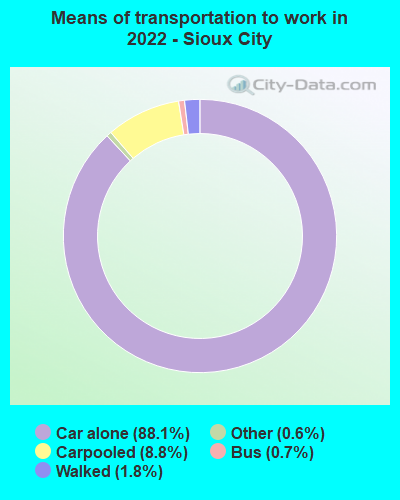
Means of transportation to work:
Drove a car alone: 36,533 (82.7%)Carpooled: 3,867 (8.8%)Bus : 275 (0.6%)Ferryboat: 8 (0.0%)Taxi: 237 (0.5%)Bicycle: 21 (0.0%)Walked: 728 (1.6%)Worked at home: 1,984 (4.5%)
Unemployment by race in 2022
Unemployment rate for White non-Hispanic residents 2.6% Males3.8% FemalesUnemployment rate for Black residents 10.9% Males3.3% FemalesUnemployment rate for American Indian and Alaska Native residents 26.7% Males7.0% FemalesUnemployment rate for Asian residents 0.2% MalesUnemployment rate for other race residents 2.1% Males4.0% FemalesUnemployment rate for two or more race residents 5.4% Males6.1% FemalesUnemployment rate for Hispanic or Latino residents 1.3% Males3.3% Females
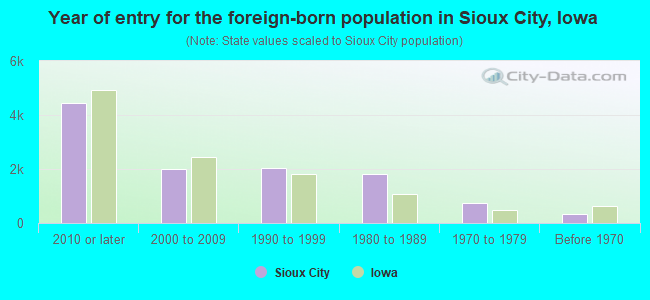
Year of entry for the foreign-born population in Sioux City, Iowa
4,426 2010 or later 2,006 2000 to 2009 2,019 1990 to 1999 1,813 1980 to 1989 750 1970 to 1979 322 Before 1970
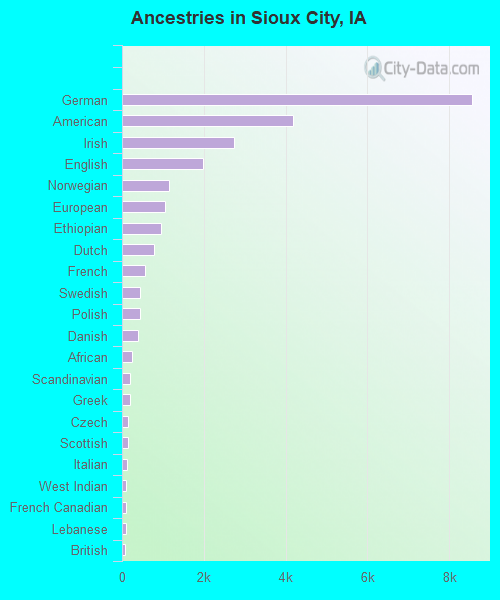
First ancestries reported:
German: 8,550 (18.0%)
American: 4,176 (8.8%)
Irish: 2,738 (5.8%)
English: 1,980 (4.2%)
Norwegian: 1,155 (2.4%)
European: 1,064 (2.2%)
Ethiopian: 949 (2.0%)
Dutch: 776 (1.6%)
French: 563 (1.2%)
Swedish: 448 (0.9%)
Polish: 439 (0.9%)
Danish: 381 (0.8%)
African: 236 (0.5%)
Scandinavian: 199 (0.4%)
Greek: 194 (0.4%)
Czech: 145 (0.3%)
Scottish: 140 (0.3%)
Italian: 133 (0.3%)
West Indian: 108 (0.2%)
French Canadian: 100 (0.2%)
Lebanese: 94 (0.2%)
British: 81 (0.2%)
Luxembourger: 67 (0.1%)
Eastern European: 63 (0.1%)
Somali: 59 (0.1%)
Russian: 52 (0.1%)
Senegalese: 43 (0.09%)
Sudanese: 42 (0.09%)
Scotch-Irish: 33 (0.07%)
Northern European: 30 (0.06%)
Welsh: 27 (0.06%)
Hungarian: 26 (0.05%)
Syrian: 25 (0.05%)
Romanian: 25 (0.05%)
Lithuanian: 21 (0.04%)
Jordanian: 18 (0.04%)
German Russian: 16 (0.03%)
Pennsylvania German: 14 (0.03%)
Egyptian: 11 (0.02%)
Cypriot: 11 (0.02%)
Iranian: 11 (0.02%)
Icelander: 11 (0.02%)
Czechoslovakian: 10 (0.02%)
Turkish: 8 (0.02%)
Ukrainian: 6 (0.01%)
Slovak: 6 (0.01%)
Arab: 5 (0.01%)
Cape Verdean: 4 (0.01%)
Most common places of birth for foreign-born residents (%): Mexico Sioux City:
37.5% (3,676)Iowa:
23.3% (41,625)
Guatemala Sioux City:
14.0% (1,370)Iowa:
3.2% (5,672)
Vietnam Sioux City:
8.5% (829)Iowa:
4.2% (7,428)
Eritrea Sioux City:
4.7% (463)Iowa:
0.5% (898)
El Salvador Sioux City:
4.2% (409)Iowa:
2.8% (4,967)
Ethiopia Sioux City:
3.7% (359)Iowa:
1.0% (1,858)
Congo Sioux City:
3.2% (309)Iowa:
0.8% (1,507)
Micronesia Sioux City:
2.2% (213)Iowa:
0.7% (1,305)
Korea Sioux City:
1.8% (181)Iowa:
2.9% (5,155)
Nicaragua Sioux City:
1.8% (174)Iowa:
0.2% (412)
Place of birth for U.S.-born residents:
This state: 53,119Other state: 21,681Northeast: 727Midwest: 12,031South: 3,306West: 5,617 91.5% of Sioux City residents lived in the same house 1 years ago.
Out of people who lived in different houses, 31.8% lived in this county.
Out of people who lived in different counties, 34.3% lived in Iowa.
Sioux City:
91.5%State average:
87.2%
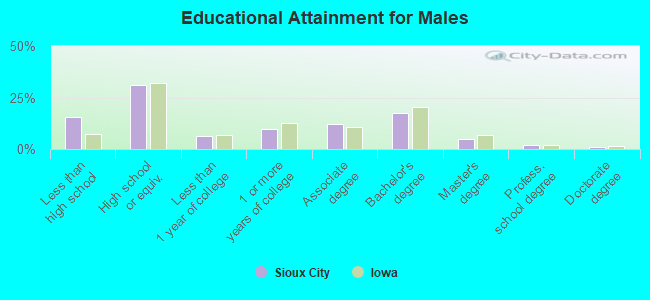
Education attainment for males 25 years and older:
No schooling: 976Nursery to 4th grade: 215th and 6th grade: 2847th and 8th grade: 5849th grade: 49210th grade: 86511th grade: 61712th grade, no diploma: 183High school graduate (or equivalency): 8,025Less than 1 year of college: 1,697Some college more than 1 year, no degree: 2,563Associate degree: 3,112Bachelor's degree: 4,532Master's degree: 1,228Professional school degree: 461Doctorate degree: 250
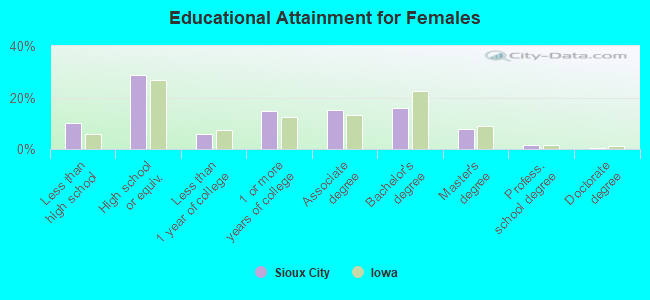
Education attainment for females 25 years and older:
No schooling: 977Nursery to 4th grade: 05th and 6th grade: 1227th and 8th grade: 489th grade: 27610th grade: 60611th grade: 49612th grade, no diploma: 297High school graduate (or equivalency): 8,195Less than 1 year of college: 1,642Some college more than 1 year, no degree: 4,189Associate degree: 4,353Bachelor's degree: 4,547Master's degree: 2,247Professional school degree: 431Doctorate degree: 56
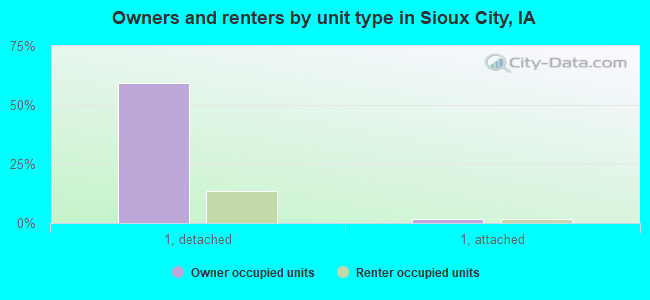
Housing units in structures:
One, detached: 25,069One, attached: 1,256Two: 8513 or 4: 1,6075 to 9: 1,40610 to 19: 1,11520 to 49: 1,50450 or more: 1,383Mobile homes: 901Median worth of mobile homes: $59,300
Housing units lacking complete kitchen facilities in 2022: 2.1%House/condo owner moved in on average 10 years ago
Renter moved in on average 3 years ago
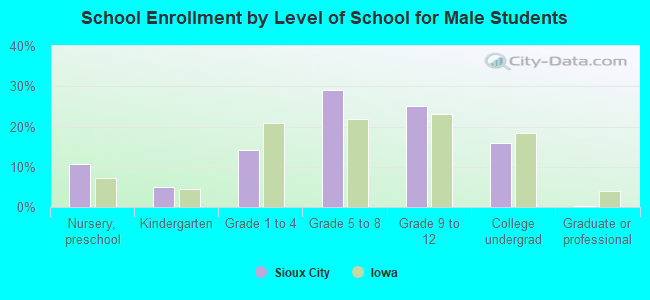
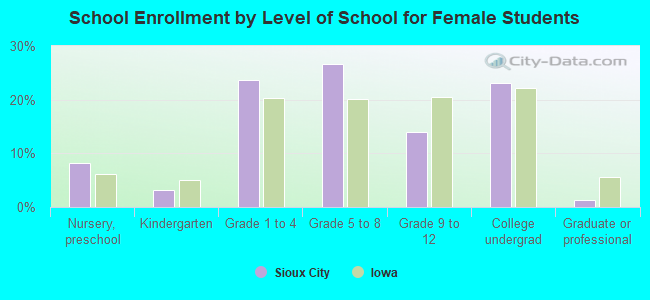
Private vs. public school enrollment:
Students in private schools in grades 1 to 8 (elementary and middle school): 694 Students in private schools in grades 9 to 12 (high school): 286 Students in private undergraduate colleges: 2,038