South Elgin, IL (Illinois) Houses and Residents
| South Elgin: | $300,814 |
| Illinois: | $251,600 |
Mean price in 2022:
Detached houses: $320,561
Here: $320,561 State: $310,164 Townhouses or other attached units: $205,546
Here: $205,546 State: $286,230 In 2-unit structures: $465,780
Here: $465,780 State: $299,638 In 3-to-4-unit structures: $230,950
Here: $230,950 State: $330,907 In 5-or-more-unit structures: $193,817
Here: $193,817 State: $318,887
Total population: 22,226 (Urban population: 15,673, Rural population: 0)
Houses: 8,480 (8,310 occupied: 6,696 owner occupied, 1,615 renter occupied)
| % of renters here: | 19% |
| State: | 33% |
Housing density: 1,349 houses/condos per square mile
Median price asked for vacant for-sale houses and condos in 2022: $241,400.
Median contract rent in 2022: $1,460 (lower quartile is $1,032, upper quartile is $1,803)
Median gross rent in South Elgin, IL in 2022: $1,557
Housing units in South Elgin with a mortgage: 5,160 (497 second mortgage, 13 home equity loan, 344 both second mortgage and home equity loan)
Houses without a mortgage: 13
Median household income for houses/condos with a mortgage: $129,713
Median household income for apartments without a mortgage: $107,587
Median monthly housing costs: $1,730
Compare current foreclosures in South Elgin, IL:
| Photo | Address | Area | Beds / Baths | Price | Details |
|---|---|---|---|---|---|

|
#1
S Pembroke Dr
South Elgin, IL 60177
|
1,491 sq. feet
|
2 baths 3 beds |
show details | |

|
#2
Nicole Dr Unit C
South Elgin, IL 60177
|
1,442 sq. feet
|
3 baths 3 beds |
show details | |

|
#3
Angeline Dr
South Elgin, IL 60177
|
1,734 sq. feet
|
3 baths 3 beds |
show details | |

|
#4
Wills St
South Elgin, IL 60177
|
1,536 sq. feet
|
4 baths 3 beds |
show details | |

|
#5
Bunkerhill Ave
South Elgin, IL 60177
|
1,008 sq. feet
|
1 baths 3 beds |
show details | |

|
#6
Sunbury Rd
South Elgin, IL 60177
|
1,173 sq. feet
|
2 baths 3 beds |
show details | |

|
#7
Fulton St
South Elgin, IL 60177
|
1,110 sq. feet
|
1 baths 2 beds |
show details | |

|
#8
N Camden Ln
South Elgin, IL 60177
|
1,377 sq. feet
|
2 baths 2 beds |
show details | |

|
#9
Crystal Ave
South Elgin, IL 60177
|
720 sq. feet
|
1 baths 2 beds |
show details | |

|
#10
Kenilworth Ave
South Elgin, IL 60177
|
960 sq. feet
|
1 baths 2 beds |
show details |
| Photo | Address | Area | Beds / Baths | Price | Details |
|---|---|---|---|---|---|

|
#11
Fairview Ln
South Elgin, IL 60177
|
1,604 sq. feet
|
2 baths 4 beds |
show details | |

|
#12
Riverview Ave
South Elgin, IL 60177
|
1,440 sq. feet
|
1 baths 4 beds |
show details | |

|
#13
W Harvard Cir
South Elgin, IL 60177
|
1,728 sq. feet
|
3 baths 3 beds |
show details | |

|
#14
Paine St
South Elgin, IL 60177
|
2,030 sq. feet
|
3 baths 4 beds |
show details | |

|
#15
Burke Ln
South Elgin, IL 60177
|
1,604 sq. feet
|
3 baths 4 beds |
show details | |

|
#16
Hobart Dr Unit B
South Elgin, IL 60177
|
1,152 sq. feet
|
2 baths 2 beds |
show details | |

|
#17
E Harvard Cir
South Elgin, IL 60177
|
1,703 sq. feet
|
3 baths 3 beds |
show details | |

|
#18
S Collins St
South Elgin, IL 60177
|
2,871 sq. feet
|
3 baths 4 beds |
show details | |

|
#19
Sandhurst Ln
South Elgin, IL 60177
|
1,220 sq. feet
|
2 baths 2 beds |
show details | |

|
#20
S Pembroke Dr
South Elgin, IL 60177
|
1,762 sq. feet
|
2 baths - beds |
show details |
| Photo | Address | Area | Beds / Baths | Price | Details |
|---|---|---|---|---|---|

|
#21
Gyorr Ave, Unit 402
South Elgin, IL 60177
|
- sq. feet
|
- baths - beds |
show details | |

|
#22
S Pointe Ave
South Elgin, IL 60177
|
- sq. feet
|
- baths - beds |
show details | |

|
#23
Gyorr Ave, Bldg 10
South Elgin, IL 60177
|
- sq. feet
|
- baths - beds |
show details | |

|
#24
Ione Dr Unit B
South Elgin, IL 60177
|
- sq. feet
|
- baths - beds |
show details | |

|
#25
Center Dr
South Elgin, IL 60177
|
- sq. feet
|
- baths - beds |
show details | |

|
#26
N Gilbert St Apt 213
South Elgin, IL 60177
|
- sq. feet
|
- baths - beds |
show details | |

|
#27
Woodridge Cir Unit C
South Elgin, IL 60177
|
- sq. feet
|
- baths - beds |
show details | |

|
#28
S Mclean Blvd
South Elgin, IL 60177
|
- sq. feet
|
- baths - beds |
show details | |

|
#29
Gyorr Ave, Unit 1217
South Elgin, IL 60177
|
- sq. feet
|
- baths - beds |
show details | |

|
#30
Deer Pointe Dr
South Elgin, IL 60177
|
- sq. feet
|
- baths - beds |
show details |
| Photo | Address | Area | Beds / Baths | Price | Details |
|---|---|---|---|---|---|

|
#31
Hobart Dr Unit B
South Elgin, IL 60177
|
- sq. feet
|
- baths - beds |
show details | |

|
#32
Moraine Dr
South Elgin, IL 60177
|
- sq. feet
|
- baths - beds |
show details | |

|
#33
S Collins St Apt D
South Elgin, IL 60177
|
- sq. feet
|
- baths - beds |
show details | |

|
#34
Gyorr Ave, Unit 1005
South Elgin, IL 60177
|
- sq. feet
|
- baths - beds |
show details | |

|
#35
Nicole Dr Unit E
South Elgin, IL 60177
|
- sq. feet
|
- baths - beds |
show details | |

|
#36
Holt Ln
South Elgin, IL 60177
|
- sq. feet
|
- baths - beds |
show details | |

|
#37
Medford Ave
South Elgin, IL 60177
|
- sq. feet
|
- baths - beds |
show details | |

|
#38
Kane St
South Elgin, IL 60177
|
- sq. feet
|
- baths - beds |
show details | |

|
#39
Hancock Ave
South Elgin, IL 60177
|
- sq. feet
|
- baths - beds |
show details | |

|
#40
Franklin Dr
South Elgin, IL 60177
|
- sq. feet
|
- baths - beds |
show details |
| Photo | Address | Area | Beds / Baths | Price | Details |
|---|---|---|---|---|---|

|
#41
Lor Ann Dr
South Elgin, IL 60177
|
- sq. feet
|
- baths - beds |
show details | |

|
#42
Burke Ln
South Elgin, IL 60177
|
- sq. feet
|
- baths - beds |
show details | |

|
#43
Village Ct
South Elgin, IL 60177
|
- sq. feet
|
- baths - beds |
show details | |

|
#44
E Middle St
South Elgin, IL 60177
|
- sq. feet
|
- baths - beds |
show details | |

|
#45
Sandhurst Ln # D
South Elgin, IL 60177
|
- sq. feet
|
- baths - beds |
show details | |

|
#46
Millicent Ct
South Elgin, IL 60177
|
- sq. feet
|
- baths - beds |
show details | |

|
#47
Timber Ln
South Elgin, IL 60177
|
- sq. feet
|
- baths - beds |
show details | |

|
#48
Marleigh Ln
South Elgin, IL 60177
|
- sq. feet
|
- baths - beds |
show details | |

|
#49
Linden Ct
South Elgin, IL 60177
|
- sq. feet
|
- baths - beds |
show details | |

|
Check over 1 million property listings on Foreclosure.com!
|
browse all offers | |||


 | River Side Apartments. South Elgin (1 reply) |
| Suburb thoughts? South Elgin/Fox River Grove/Crystal Lake or somewhere else? (10 replies) |
| Homesteading + supportive community (16 replies) |
| Moving to IL - is there any future? (212 replies) |
| Tiny Home as secondary home on property? (22 replies) |
| Suburbs of Suburbs (32 replies) |

Median year apartment built: 1995
Household type by relationship:
Households: 23,699- Male householders: 4,222 (683 living alone), Female householders: 3,953 (920 living alone)
5,060 spouses (5,060 opposite-sex spouses), 395 unmarried partners, (395 opposite-sex unmarried partners), 7,917 children (7,492 natural, 61 adopted, 363 stepchildren), 315 grandchildren, 243 brothers or sisters, 656 parents, 0 foster children, 291 other relatives, 379 non-relatives
- In group quarters: 263
Size of family households: 2,292 2-persons, 1,402 3-persons, 1,671 4-persons, 674 5-persons, 210 6-persons, 110 7-or-more-persons.
Size of nonfamily households: 1,619 1-person, 267 2-persons, 26 3-persons, 25 4-persons.
4,309 married couples with children.
864 single-parent households (343 men, 521 women).
74.7% of residents of South Elgin speak English at home.
13.7% of residents speak Spanish at home (67% speak English very well, 25% speak English well, 7% speak English not well, 1% don't speak English at all).
6.9% of residents speak other Indo-European language at home (82% speak English very well, 6% speak English well, 9% speak English not well, 2% don't speak English at all).
5.1% of residents speak Asian or Pacific Island language at home (53% speak English very well, 25% speak English well, 17% speak English not well, 5% don't speak English at all).
0.2% of residents speak other language at home (100% speak English very well).
Foreign born population: 3,431 (14.5%)
(75.3% of them are naturalized citizens)
| Here: | 7.1 |
| State: | 6.4 |
| Here: | 3.5 |
| State: | 4.1 |

- Bedrooms in owner-occupied houses and condos in South Elgin, Illinois
- 50no bedroom
- 811 bedroom
- 1,0952 bedrooms
- 2,6103 bedrooms
- 2,3494 bedrooms
- 5115+ bedrooms

- Bedrooms in renter-occupied apartments in South Elgin, Illinois
- 196no bedroom
- 3881 bedroom
- 5392 bedrooms
- 3713 bedrooms
- 1224 bedrooms
- 05+ bedrooms

- Cars and other vehicles available in South Elgin in owner-occupied houses/condos
- 120no vehicle
- 1,0721 vehicle
- 3,0542 vehicles
- 1,6233 vehicles
- 6934 vehicles
- 1335+ vehicles

- Cars and other vehicles available in South Elgin in renter-occupied apartments
- 431no vehicle
- 3691 vehicle
- 6112 vehicles
- 1953 vehicles
- 104 vehicles
- 05+ vehicles

- Rooms in owner-occupied houses in South Elgin, Illinois
- 501 room
- 02 rooms
- 2933 rooms
- 4934 rooms
- 7895 rooms
- 1,1046 rooms
- 8557 rooms
- 1,0118 rooms
- 2,1029+ rooms

- Rooms in renter-occupied apartments in South Elgin, Illinois
- 1961 room
- 2442 rooms
- 2803 rooms
- 4004 rooms
- 905 rooms
- 1536 rooms
- 877 rooms
- 1358 rooms
- 319+ rooms


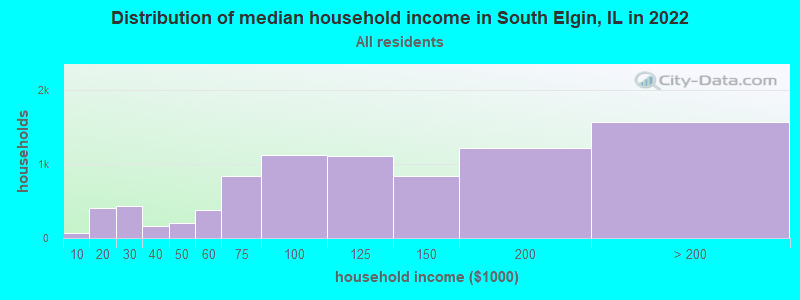
South Elgin, IL household income distribution

- 62Less than $10,000
- 398$10,000 to $19,999
- 427$20,000 to $29,999
- 167$30,000 to $39,999
- 208$40,000 to $49,999
- 381$50,000 to $59,999
- 831$60,000 to $74,999
- 1,118$75,000 to $99,999
- 1,110$100,000 to $124,999
- 832$125,000 to $149,999
- 1,212$150,000 to $199,999
- 1,563$200,000 or more
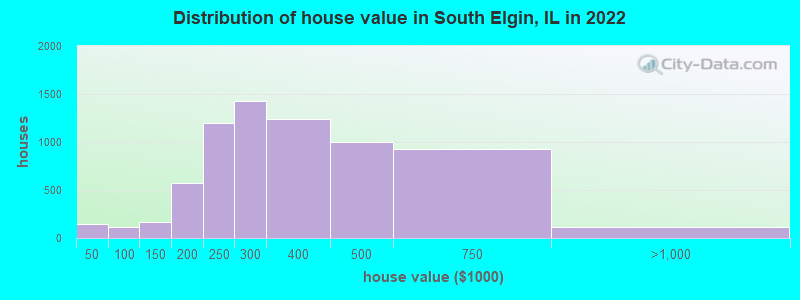
Home value of owner - occupied houses in 2022 in South Elgin, IL
-
- 122Less than $10,000
- 12$10,000 to $14,999
- 7$20,000 to $24,999
- 6$35,000 to $39,999
- 15$60,000 to $69,999
- 11$70,000 to $79,999
- 65$80,000 to $89,999
- 26$90,000 to $99,999
- 71$100,000 to $124,999
- 98$125,000 to $149,999
- 220$150,000 to $174,999
- 349$175,000 to $199,999
- 1,194$200,000 to $249,999
- 1,431$250,000 to $299,999
- 1,241$300,000 to $399,999
- 997$400,000 to $499,999
- 931$500,000 to $749,999
- 100$750,000 to $999,999
- 13$2,000,000 or more
Rent paid by renters in 2022 in South Elgin, IL
-
- 48$400 to $449
- 16$450 to $499
- 19$500 to $549
- 47$700 to $749
- 64$750 to $799
- 89$800 to $899
- 114$900 to $999
- 193$1,000 to $1,249
- 241$1,250 to $1,499
- 558$1,500 to $1,999
- 85$2,000 to $2,499
- 61$2,500 to $2,999
- 31$3,500 or more
- 9No cash rent


Percentage of workers working in this county: 60.4%
Number of people working at home: 1,677 (12.5% of all workers)
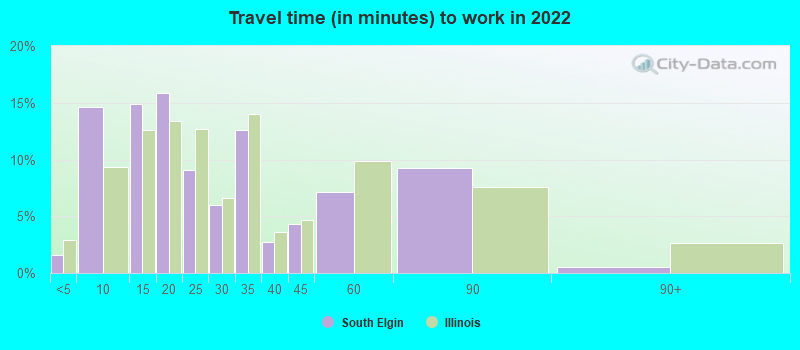
Travel time to work (commute)
- Less than 5 minutes: 75
- 5 to 9 minutes: 1,220
- 10 to 14 minutes: 1,182
- 15 to 19 minutes: 1,710
- 20 to 24 minutes: 1,379
- 25 to 29 minutes: 972
- 30 to 34 minutes: 1,103
- 35 to 39 minutes: 617
- 40 to 44 minutes: 725
- 45 to 59 minutes: 1,620
- 60 to 89 minutes: 875
- 90 or more minutes: 151
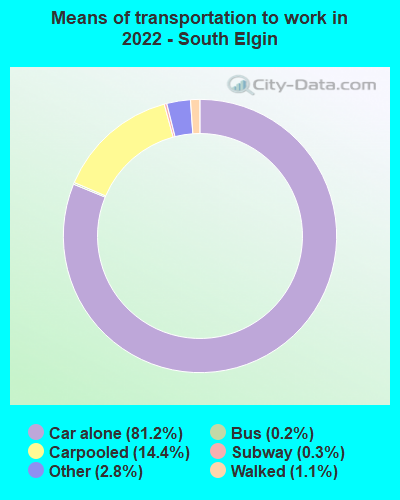
Means of transportation to work:
- Drove a car alone: 7,041 (67.4%)
- Carpooled: 1,333 (12.8%)
- Bus: 21 (0.2%)
- Long-distance train or commuter rail: 21 (0.2%)
- Taxi: 312 (3.0%)
- Walked: 83 (0.8%)
- Worked at home: 1,677 (16.0%)

- Unemployment by race in 2022
- Unemployment rate for White non-Hispanic residents
- 3.1%Males
- 1.1%Females
- Unemployment rate for Asian residents
- 3.2%Males
- Unemployment rate for other race residents
- 11.1%Males
- 1.8%Females
- Unemployment rate for two or more race residents
- 3.0%Males
- 4.1%Females
- Unemployment rate for Hispanic or Latino residents
- 7.7%Males
- 7.6%Females

- Year of entry for the foreign-born population in South Elgin, Illinois
- 3872010 or later
- 6962000 to 2009
- 1,1801990 to 1999
- 3251980 to 1989
- 3121970 to 1979
- 160Before 1970
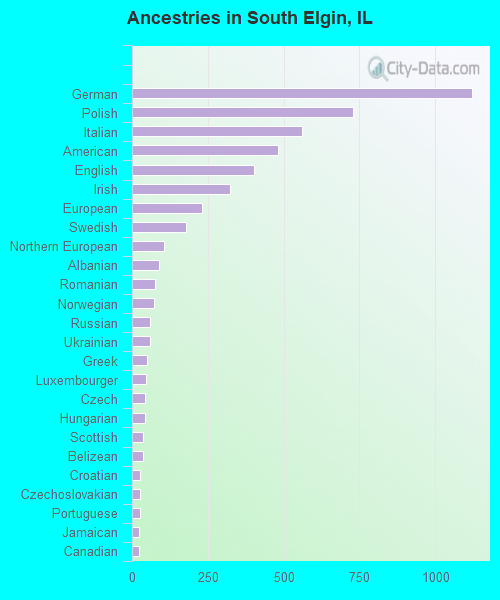
First ancestries reported:
- German: 1,121 (10.5%)
- Polish: 729 (6.8%)
- Italian: 559 (5.2%)
- American: 482 (4.5%)
- English: 403 (3.8%)
- Irish: 322 (3.0%)
- European: 232 (2.2%)
- Swedish: 177 (1.7%)
- Northern European: 104 (1.0%)
- Albanian: 89 (0.8%)
- Romanian: 76 (0.7%)
- Norwegian: 71 (0.7%)
- Russian: 60 (0.6%)
- Ukrainian: 59 (0.6%)
- Greek: 50 (0.5%)
- Luxembourger: 47 (0.4%)
- Czech: 44 (0.4%)
- Hungarian: 43 (0.4%)
- Scottish: 36 (0.3%)
- Belizean: 35 (0.3%)
- Croatian: 28 (0.3%)
- Czechoslovakian: 27 (0.3%)
- Portuguese: 26 (0.2%)
- Jamaican: 24 (0.2%)
- Canadian: 23 (0.2%)
- Eastern European: 21 (0.2%)
- French Canadian: 20 (0.2%)
- Moroccan: 18 (0.2%)
- Palestinian: 18 (0.2%)
- Danish: 18 (0.2%)
- French: 12 (0.1%)
- Arab: 11 (0.1%)
- British: 11 (0.1%)
- Swiss: 7 (0.07%)
- Jordanian: 6 (0.06%)
Most common places of birth for foreign-born residents (%):
| South Elgin: | 33.4% (1,112) |
| Illinois: | 34.7% (626,958) |
| South Elgin: | 17.7% (589) |
| Illinois: | 9.2% (166,409) |
| South Elgin: | 7.6% (252) |
| Illinois: | 5.2% (93,003) |
| South Elgin: | 6.1% (202) |
| Illinois: | 6.9% (124,474) |
| South Elgin: | 4.4% (147) |
| Illinois: | 2.2% (40,393) |
| South Elgin: | 3.9% (130) |
| Illinois: | 0.9% (16,553) |
| South Elgin: | 3.4% (112) |
| Illinois: | 4.1% (74,364) |
| South Elgin: | 3.3% (110) |
| Illinois: | 0.2% (3,512) |
| South Elgin: | 2.3% (76) |
| Illinois: | 0.1% (1,187) |
| South Elgin: | 2.2% (72) |
| Illinois: | 0.8% (14,736) |
| South Elgin: | 1.9% (63) |
| Illinois: | 1.6% (29,519) |
Place of birth for U.S.-born residents:
- This state: 16,907
- Other state: 3,135
- Northeast: 232
- Midwest: 1,334
- South: 1,085
- West: 378
92.1% of South Elgin residents lived in the same house 1 years ago.
Out of people who lived in different houses, 20.6% lived in this county.
Out of people who lived in different counties, 94.5% lived in Illinois.
| South Elgin: | 92.1% |
| State average: | 88.3% |
Education attainment for males 25 years and older:
- No schooling: 400
- Nursery to 4th grade: 14
- 5th and 6th grade: 113
- 7th and 8th grade: 77
- 9th grade: 8
- 10th grade: 63
- 11th grade: 89
- 12th grade, no diploma: 296
- High school graduate (or equivalency): 1,850
- Less than 1 year of college: 641
- Some college more than 1 year, no degree: 859
- Associate degree: 734
- Bachelor's degree: 2,029
- Master's degree: 496
- Professional school degree: 136
- Doctorate degree: 92

Education attainment for females 25 years and older:
- No schooling: 204
- Nursery to 4th grade: 27
- 5th and 6th grade: 63
- 7th and 8th grade: 0
- 9th grade: 104
- 10th grade: 37
- 11th grade: 14
- 12th grade, no diploma: 136
- High school graduate (or equivalency): 2,042
- Less than 1 year of college: 555
- Some college more than 1 year, no degree: 905
- Associate degree: 921
- Bachelor's degree: 1,936
- Master's degree: 1,008
- Professional school degree: 161
- Doctorate degree: 6


Housing units in structures:
- One, detached: 5,798
- One, attached: 1,199
- Two: 55
- 3 or 4: 362
- 5 to 9: 324
- 10 to 19: 125
- 20 to 49: 141
- 50 or more: 422
- Mobile homes: 50
Housing units lacking complete kitchen facilities in 2022: 3.6%
House/condo owner moved in on average 13 years ago
Renter moved in on average 1 years ago

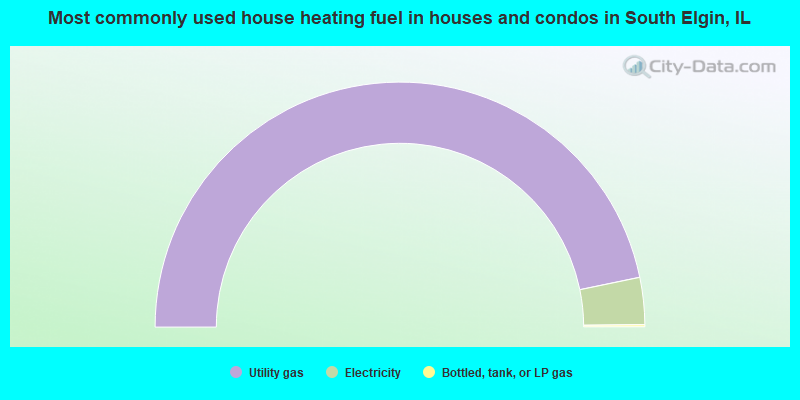
- 93.5%Utility gas
- 6.2%Electricity
- 0.3%Bottled, tank, or LP gas
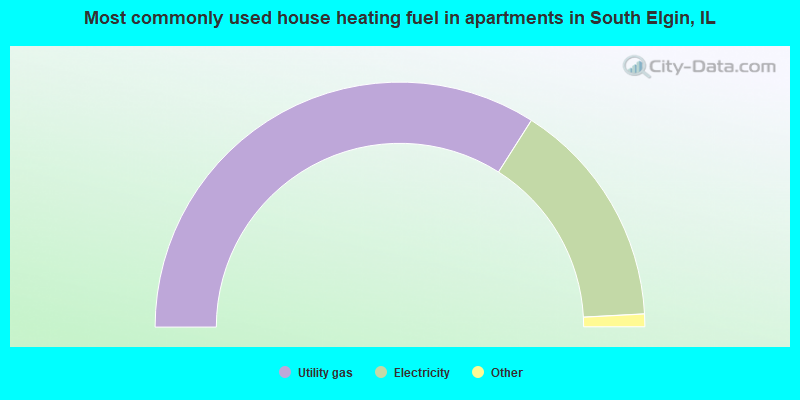
- 68.1%Utility gas
- 30.3%Electricity
- 1.3%Bottled, tank, or LP gas
- 0.4%Solar energy
Private vs. public school enrollment:
| Here: | 7.1% |
| Illinois: | 13.3% |
| Here: | 5.7% |
| Illinois: | 9.9% |
| Here: | 14.5% |
| Illinois: | 27.4% |


