South Gate, CA (California) Houses and Residents
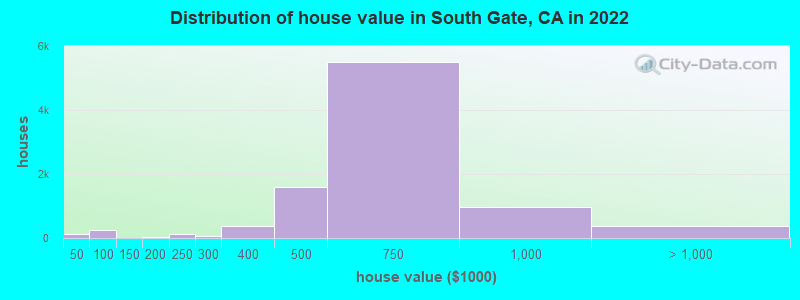
Estimated median house or condo value in 2022: $622,000 (it was $161,400 in 2000 )
South Gate:
$622,000California:
$715,900
Lower value quartile - upper value quartile: $523,800 - $720,200Mean price in 2022: Detached houses: $610,022 Here:
$610,022State:
$988,808
Townhouses or other attached units: $557,452 Here:
$557,452State:
$838,546
In 2-unit structures: $640,988 Here:
$640,988State:
$1,138,100
In 3-to-4-unit structures: $1,050,920 Here:
$1,050,920State:
$824,253
Mobile homes: $1,664,879 Here:
$1,664,879State:
$184,506
Total population: 96,312 (All urban)
Houses: 26,083 (25,199 occupied: 11,093 owner occupied, 14,106 renter occupied )
% of renters here:
56%State:
44%
Housing density: 3,541 houses/condos per square mile
Median price asked for vacant for-sale houses and condos in 2022: $631,104.
Median contract rent in 2022: $1,326 (lower quartile is $1,030, upper quartile is $1,780)
Median rent asked for vacant for-rent units in 2022: $4,989
Median gross rent in South Gate, CA in 2022: $1,442
Housing units in South Gate with a mortgage: 7,457 (504 second mortgage, 73 home equity loan, 323 both second mortgage and home equity loan )Houses without a mortgage: 151
Median household income for houses/condos with a mortgage: $106,559
Median household income for apartments without a mortgage: $74,093
Median monthly housing costs: $1,577
Data:
Median house or condo value ($)
Median house or condo value ($ change since 2000)
Median house or condo value ($) - White
Median house or condo value ($) - Black or African American
Median house or condo value ($) - Asian
Median house or condo value ($) - Hispanic or Latino
Median house or condo value ($) - American Indian and Alaska Native
Median house or condo value ($) - Multirace
Median house or condo value ($) - Other Race
Median price asked for mobile homes ($)
Household density (households per square mile)
Mean house or condo value by units in structure - 1, detached ($)
Mean house or condo value by units in structure - 1, attached ($)
Mean house or condo value by units in structure - 2 ($)
Mean house or condo value by units in structure by units in structure - 3 or 4 ($)
Mean house or condo value by units in structure - 5 or more ($)
Mean house or condo value by units in structure - Boat, RV, van, etc. ($)
Mean house or condo value by units in structure - Mobile home ($)
Median contract rent ($)
Median contract rent - Lower quartile ($)
Median contract rent - Upper quartile ($)
Median gross rent ($)
Urban houses (%)
Rural houses (%)
Houses occupied (%)
Houses occupied (% change since 2000)
Houses owner occupied (%)
Houses owner occupied (% change since 2000)
Houses renter occupied (%)
Houses renter occupied (% change since 2000)
Vacant housing units - For rent (%)
Vacant housing units - For rent (% change since 2000)
Vacant housing units - For sale only (%)
Vacant housing units - For sale only (% change since 2000)
Vacant housing units - Rented or sold, not occupied (%)
Vacant housing units - Rented or sold, not occupied (% change since 2000)
Vacant housing units - For seasonal, recreational, or occasional use (%)
Vacant housing units - For seasonal, recreational, or occasional use (% change since 2000)
Vacant housing units - For migrant workers (%)
Vacant housing units - For migrant workers (% change since 2000)
Vacant housing units - Other vacant (%)
Vacant housing units - Other vacant (% change since 2000)
Median monthly housing costs ($)
Median household income for houses/condos with a mortgage ($)
Median household income for houses/condos without a mortgage ($)
Median household income ($)
Median household income ($) - White
Median household income ($) - Black or African American
Median household income ($) - Asian
Median household income ($) - Hispanic or Latino
Median household income ($) - American Indian and Alaska Native
Median household income ($) - Multirace
Median household income ($) - Other Race
Mortgage status - with mortgage (%)
Mortgage status - with second mortgage (%)
Mortgage status - with home equity loan (%)
Mortgage status - with both second mortgage and home equity loan (%)
Mortgage status - without a mortgage (%)
Median year house/condo built
Median year apartment built
Household type by relationship - Male householder living alone (%)
Household type by relationship - Male householder not living alone (%)
Household type by relationship - Female householder living alone (%)
Household type by relationship - Female householder not living alone (%)
Household type by relationship - Opposite-Sex spouse (%)
Household type by relationship - Same-Sex spouse (%)
Household type by relationship - Opposite-Sex unmarried partner (%)
Household type by relationship - Same-Sex unmarried partner (%)
Household type by relationship - In group quarters (%)
Size of family households - 2-person household (%)
Size of family households - 3-person household (%)
Size of family households - 4-person household (%)
Size of family households - 5-person household (%)
Size of family households - 6-person household (%)
Size of family households - 7-or-more-person household (%)
Size of nonfamily households - 1-person household (%)
Size of nonfamily households - 2-person household (%)
Size of nonfamily households - 3-person household (%)
Size of nonfamily households - 4-person household (%)
Size of nonfamily households - 5-person household (%)
Size of nonfamily households - 6-person household (%)
Size of nonfamily households - 7-or-moreperson household (%)
Year house built - Built 2010 or later (%)
Year house built - Built 2000 to 2009 (%)
Year house built - Built 1990 to 1999 (%)
Year house built - Built 1980 to 1989 (%)
Year house built - Built 1970 to 1979 (%)
Year house built - Built 1960 to 1969 (%)
Year house built - Built 1950 to 1959 (%)
Year house built - Built 1940 to 1949 (%)
Year house built - Built 1939 or earlier (%)
Median number of rooms in houses and condos
Median number of rooms in apartments
Median number of bedrooms in owner occupied houses
Mean number of bedrooms in owner occupied houses
Median number of bedrooms in renter occupied houses
Mean number of bedrooms in renter occupied houses
Median number of vehichles in owner occupied houses
Mean number of vehichles in owner occupied houses
Median number of vehichles in renter occupied houses
Mean number of vehichles in renter occupied houses
Rooms in owner-occupied houses - 1 room (%)
Rooms in owner-occupied houses - 2 rooms (%)
Rooms in owner-occupied houses - 3 rooms (%)
Rooms in owner-occupied houses - 4 rooms (%)
Rooms in owner-occupied houses - 5 rooms (%)
Rooms in owner-occupied houses - 6 rooms (%)
Rooms in owner-occupied houses - 7 rooms (%)
Rooms in owner-occupied houses - 8 rooms (%)
Rooms in owner-occupied houses - 9+ rooms (%)
Rooms in renter-occupied houses - 1 room (%)
Rooms in renter-occupied houses - 2 rooms (%)
Rooms in renter-occupied houses - 3 rooms (%)
Rooms in renter-occupied houses - 4 rooms (%)
Rooms in renter-occupied houses - 5 rooms (%)
Rooms in renter-occupied houses - 6 rooms (%)
Rooms in renter-occupied houses - 7 rooms (%)
Rooms in renter-occupied houses - 8 rooms (%)
Rooms in renter-occupied houses - 9+ rooms (%)
Bedrooms in owner-occupied houses - no bedrooms (%)
Bedrooms in owner-occupied houses - 1 bedroom (%)
Bedrooms in owner-occupied houses - 2 bedrooms (%)
Bedrooms in owner-occupied houses - 3 bedrooms (%)
Bedrooms in owner-occupied houses - 4 bedrooms (%)
Bedrooms in owner-occupied houses - 5+ bedrooms (%)
Bedrooms in renter-occupied houses - no bedrooms (%)
Bedrooms in renter-occupied houses - 1 bedroom (%)
Bedrooms in renter-occupied houses - 2 bedrooms (%)
Bedrooms in renter-occupied houses - 3 bedrooms (%)
Bedrooms in renter-occupied houses - 4 bedrooms (%)
Bedrooms in renter-occupied houses - 5+ bedrooms (%)
Vehicles available in owner-occupied houses - no vehicle available (%)
Vehicles available in owner-occupied houses - 1 vehicle available(%)
Vehicles available in owner-occupied houses - 2 Vehicles available (%)
Vehicles available in owner-occupied houses - 3 Vehicles available (%)
Vehicles available in owner-occupied houses - 4 Vehicles available (%)
Vehicles available in owner-occupied houses - 5+ Vehicles available (%)
Vehicles available in renter-occupied houses - no vehicle available (%)
Vehicles available in renter-occupied houses - 1 vehicle available (%)
Vehicles available in renter-occupied houses - 2 Vehicles available (%)
Vehicles available in renter-occupied houses - 3 Vehicles available (%)
Vehicles available in renter-occupied houses - 4 Vehicles available (%)
Vehicles available in renter-occupied houses - 5+ Vehicles available (%)
Housing units in structures - 1, detached (%)
Housing units in structures - 1, attached (%)
Housing units in structures - 2 (%)
Housing units in structures - 3 or 4 (%)
Housing units in structures - 5 to 9 (%)
Housing units in structures - 10 to 19 (%)
Housing units in structures - 20 to 49 (%)
Housing units in structures - 50 or more (%)
Housing units in structures - Mobile home (%)
Housing units in structures - Boat, RV, van, etc. (%)
Housing units in structures - Owners - 1, detached (%)
Housing units in structures - Owners - 1, attached (%)
Housing units in structures - Owners - 2 (%)
Housing units in structures - Owners - 3 or 4 (%)
Housing units in structures - Owners - 5 to 9 (%)
Housing units in structures - Owners - 10 to 19 (%)
Housing units in structures - Owners - 20 to 49 (%)
Housing units in structures - Owners - 50 or more (%)
Housing units in structures - Owners - Mobile home (%)
Housing units in structures - Owners - Boat, RV, van, etc. (%)
Housing units in structures - Renters - 1, detached (%)
Housing units in structures - Renters - 1, attached (%)
Housing units in structures - Renters - 2 (%)
Housing units in structures - Renters - 3 or 4 (%)
Housing units in structures - Renters - 5 to 9 (%)
Housing units in structures - Renters - 10 to 19 (%)
Housing units in structures - Renters - 20 to 49 (%)
Housing units in structures - Renters - 50 or more (%)
Housing units in structures - Renters - Mobile home (%)
Housing units in structures - Renters - Boat, RV, van, etc. (%)
House/condo owner moved in on average (years ago)
Renter moved in on average (years ago)
Year householder moved into unit - Moved in 1999 to March 2000 (%)
Year householder moved into unit - Moved in 1999 to March 2000 (%) - White
Year householder moved into unit - Moved in 1999 to March 2000 (%) - Black or African American
Year householder moved into unit - Moved in 1999 to March 2000 (%) - Asian
Year householder moved into unit - Moved in 1999 to March 2000 (%) - Hispanic or Latino
Year householder moved into unit - Moved in 1999 to March 2000 (%) - American Indian and Alaska Native
Year householder moved into unit - Moved in 1999 to March 2000 (%) - Multirace
Year householder moved into unit - Moved in 1999 to March 2000 (%) - Other Race
Year householder moved into unit - Moved in 1995 to 1998 (%)
Year householder moved into unit - Moved in 1995 to 1998 (%) - White
Year householder moved into unit - Moved in 1995 to 1998 (%) - Black or African American
Year householder moved into unit - Moved in 1995 to 1998 (%) - Asian
Year householder moved into unit - Moved in 1995 to 1998 (%) - Hispanic or Latino
Year householder moved into unit - Moved in 1995 to 1998 (%) - American Indian and Alaska Native
Year householder moved into unit - Moved in 1995 to 1998 (%) - Multirace
Year householder moved into unit - Moved in 1995 to 1998 (%) - Other Race
Year householder moved into unit - Moved in 1990 to 1994 (%)
Year householder moved into unit - Moved in 1990 to 1994 (%) - White
Year householder moved into unit - Moved in 1990 to 1994 (%) - Black or African American
Year householder moved into unit - Moved in 1990 to 1994 (%) - Asian
Year householder moved into unit - Moved in 1990 to 1994 (%) - Hispanic or Latino
Year householder moved into unit - Moved in 1990 to 1994 (%) - American Indian and Alaska Native
Year householder moved into unit - Moved in 1990 to 1994 (%) - Multirace
Year householder moved into unit - Moved in 1990 to 1994 (%) - Other Race
Year householder moved into unit - Moved in 1980 to 1989 (%)
Year householder moved into unit - Moved in 1980 to 1989 (%) - White
Year householder moved into unit - Moved in 1980 to 1989 (%) - Black or African American
Year householder moved into unit - Moved in 1980 to 1989 (%) - Asian
Year householder moved into unit - Moved in 1980 to 1989 (%) - Hispanic or Latino
Year householder moved into unit - Moved in 1980 to 1989 (%) - American Indian and Alaska Native
Year householder moved into unit - Moved in 1980 to 1989 (%) - Multirace
Year householder moved into unit - Moved in 1980 to 1989 (%) - Other Race
Year householder moved into unit - Moved in 1970 to 1979 (%)
Year householder moved into unit - Moved in 1970 to 1979 (%) - White
Year householder moved into unit - Moved in 1970 to 1979 (%) - Black or African American
Year householder moved into unit - Moved in 1970 to 1979 (%) - Asian
Year householder moved into unit - Moved in 1970 to 1979 (%) - Hispanic or Latino
Year householder moved into unit - Moved in 1970 to 1979 (%) - American Indian and Alaska Native
Year householder moved into unit - Moved in 1970 to 1979 (%) - Multirace
Year householder moved into unit - Moved in 1970 to 1979 (%) - Other Race
Year householder moved into unit - Moved in 1969 or earlier (%)
Year householder moved into unit - Moved in 1969 or earlier (%) - White
Year householder moved into unit - Moved in 1969 or earlier (%) - Black or African American
Year householder moved into unit - Moved in 1969 or earlier (%) - Asian
Year householder moved into unit - Moved in 1969 or earlier (%) - Hispanic or Latino
Year householder moved into unit - Moved in 1969 or earlier (%) - American Indian and Alaska Native
Year householder moved into unit - Moved in 1969 or earlier (%) - Multirace
Year householder moved into unit - Moved in 1969 or earlier (%) - Other Race
Housing units lacking complete plumbing facilities (%)
Housing units lacking complete kitchen facilities (%)
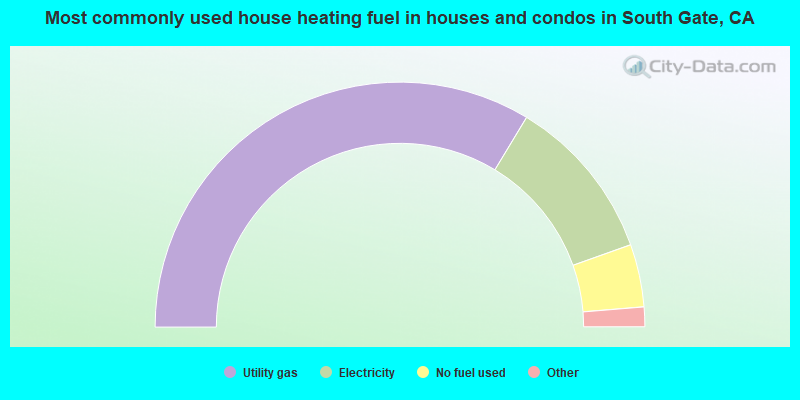
House heating fuel used in houses and condos - Utility gas (%)
House heating fuel used in houses and condos - Bottled, tank, or LP gas (%)
House heating fuel used in houses and condos - Electricity (%)
House heating fuel used in houses and condos - Fuel oil, kerosene, etc. (%)
House heating fuel used in houses and condos - Coal or coke (%)
House heating fuel used in houses and condos - Wood (%)
House heating fuel used in houses and condos - Solar energy (%)
House heating fuel used in houses and condos - Other fuel (%)
House heating fuel used in houses and condos - No fuel used (%)
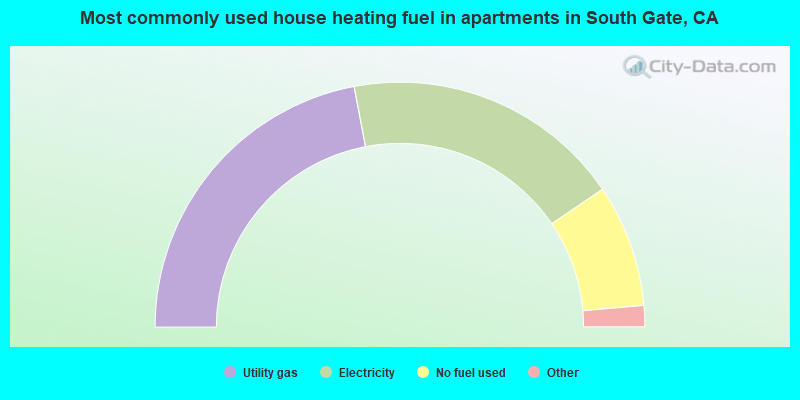
House heating fuel used in apartments - Utility gas (%)
House heating fuel used in apartments - Bottled, tank, or LP gas (%)
House heating fuel used in apartments - Electricity (%)
House heating fuel used in apartments - Fuel oil, kerosene, etc. (%)
House heating fuel used in apartments - Coal or coke (%)
House heating fuel used in apartments - Wood (%)
House heating fuel used in apartments - Solar energy (%)
House heating fuel used in apartments - Other fuel (%)
House heating fuel used in apartments - No fuel used (%)
Median year house/condo built: 1949Median year apartment built: 1962Household type by relationship:
Households: 90,935
Male householders: 13,529 (1,941 living alone ), Female householders: 11,670 (1,885 living alone )12,359 spouses (12,313 opposite-sex spouses ), 2,555 unmarried partners , (2,300 opposite-sex unmarried partners ), 31,878 children (31,031 natural , 184 adopted , 663 stepchildren ), 4,859 grandchildren , 3,512 brothers or sisters , 3,161 parents , 0 foster children , 5,281 other relatives , 2,015 non-relatives In group quarters: 116
Size of family households: 3,813 2-persons , 4,993 3-persons , 5,073 4-persons , 3,408 5-persons , 1,627 6-persons , 1,467 7-or-more-persons .
Size of nonfamily households: 3,826 1-person , 868 2-persons , 124 5-persons .
9,465 married couples with children. single-parent households (1,712 men , 4,245 women ).
14.7% of residents of South Gate speak English at home. of residents speak Spanish at home (55% speak English very well , 17% speak English well , 18% speak English not well , 10% don't speak English at all ).of residents speak other Indo-European language at home (67% speak English very well , 19% speak English well , 11% speak English not well , 3% don't speak English at all ).of residents speak Asian or Pacific Island language at home (22% speak English very well , 70% speak English well , 8% speak English not well ).of residents speak other language at home (70% speak English very well , 30% speak English well ).
Foreign born population: 36,173 (39.8%)of them are naturalized citizens )
Median number of rooms in houses and condos:
Median number of rooms in apartments
Owner-occupied Renter-occupied
Rooms in owner-occupied houses in South Gate, California
203 1 room 95 2 rooms 734 3 rooms 1,695 4 rooms 2,658 5 rooms 2,740 6 rooms 1,348 7 rooms 1,319 8 rooms 301 9+ rooms
Rooms in renter-occupied apartments in South Gate, California
1,541 1 room 744 2 rooms 4,434 3 rooms 4,563 4 rooms 1,346 5 rooms 1,060 6 rooms 185 7 rooms 97 8 rooms 136 9+ rooms
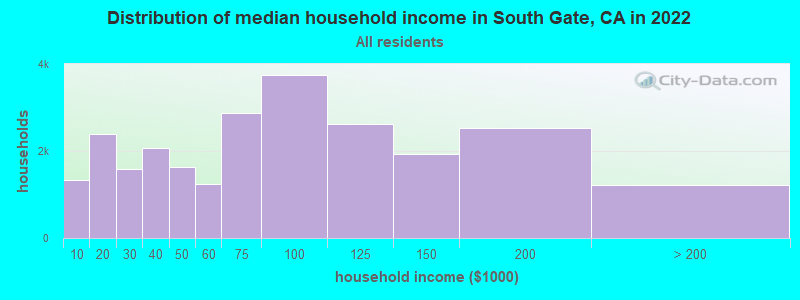
South Gate, CA household income distribution 1,337 Less than $10,0002,401 $10,000 to $19,9991,581 $20,000 to $29,9992,062 $30,000 to $39,9991,623 $40,000 to $49,9991,247 $50,000 to $59,9992,863 $60,000 to $74,9993,752 $75,000 to $99,9992,631 $100,000 to $124,9991,940 $125,000 to $149,9992,537 $150,000 to $199,9991,225 $200,000 or more
Home value of owner - occupied houses in 2022 in South Gate, CA 82 Less than $10,0004 $10,000 to $14,99911 $15,000 to $19,9992 $20,000 to $24,9994 $25,000 to $29,9994 $35,000 to $39,99928 $40,000 to $49,999135 $50,000 to $59,99910 $60,000 to $69,99916 $70,000 to $79,99945 $80,000 to $89,99911 $90,000 to $99,99936 $150,000 to $174,999126 $200,000 to $249,99948 $250,000 to $299,999377 $300,000 to $399,9991,587 $400,000 to $499,9995,512 $500,000 to $749,999972 $750,000 to $999,999194 $1,000,000 to $1,499,99913 $1,500,000 to $1,999,999152 $2,000,000 or moreRent paid by renters in 2022 in South Gate, CA 22 $100 to $14911 $150 to $199121 $200 to $249137 $250 to $29990 $300 to $34921 $350 to $39946 $400 to $44968 $450 to $49934 $500 to $54962 $550 to $599133 $600 to $649115 $650 to $699153 $700 to $749102 $750 to $799632 $800 to $899898 $900 to $9993,399 $1,000 to $1,2492,827 $1,250 to $1,4992,965 $1,500 to $1,999909 $2,000 to $2,499251 $2,500 to $2,99926 $3,000 to $3,49915 $3,500 or more387 No cash rent
Percentage of workers working in this county: 92.4%Number of people working at home: 3,460 (7.8% of all workers )
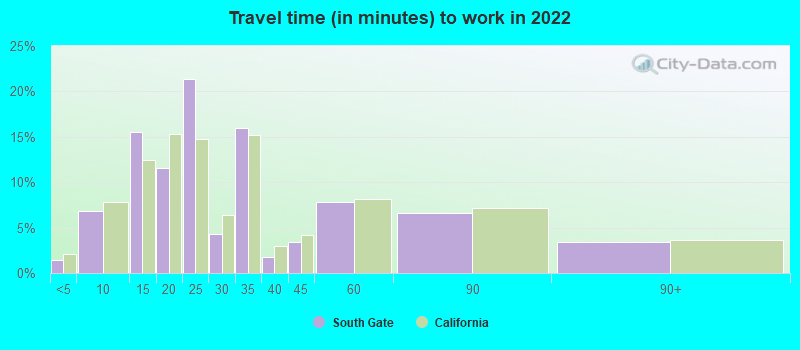
Travel time to work (commute)
Less than 5 minutes: 5045 to 9 minutes: 1,65710 to 14 minutes: 3,05615 to 19 minutes: 4,58520 to 24 minutes: 5,14725 to 29 minutes: 1,98030 to 34 minutes: 9,96035 to 39 minutes: 1,00140 to 44 minutes: 3,16045 to 59 minutes: 3,99860 to 89 minutes: 4,35190 or more minutes: 1,277
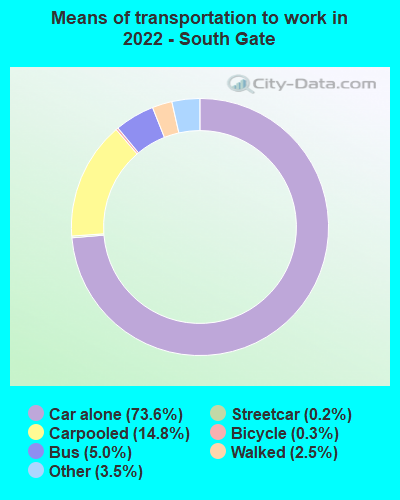
Means of transportation to work:
Drove a car alone: 13,602 (61.6%)Carpooled: 3,026 (13.7%)Bus : 838 (3.8%)Subway or elevated rail : 28 (0.1%)Ferryboat: 4 (0.0%)Taxi: 712 (3.2%)Bicycle: 50 (0.2%)Walked: 503 (2.3%)Worked at home: 3,371 (15.3%)
Unemployment by race in 2022
Unemployment rate for White non-Hispanic residents 3.2% Males1.9% FemalesUnemployment rate for Black residents 1.7% Males23.7% FemalesUnemployment rate for American Indian and Alaska Native residents 18.7% Males2.3% FemalesUnemployment rate for Asian residents 11.8% FemalesUnemployment rate for other race residents 6.2% Males3.8% FemalesUnemployment rate for two or more race residents 7.4% Males7.0% FemalesUnemployment rate for Hispanic or Latino residents 7.1% Males5.2% Females
Year of entry for the foreign-born population in South Gate, California
3,454 2010 or later 5,392 2000 to 2009 8,650 1990 to 1999 16,510 1980 to 1989 13,354 1970 to 1979 5,056 Before 1970
First ancestries reported:
American: 631 (0.9%)
English: 257 (0.4%)
German: 126 (0.2%)
Italian: 99 (0.1%)
Cajun: 88 (0.1%)
Ethiopian: 82 (0.1%)
Irish: 79 (0.1%)
Romanian: 79 (0.1%)
Haitian: 62 (0.09%)
Polish: 48 (0.07%)
African: 40 (0.06%)
Norwegian: 38 (0.06%)
Lebanese: 34 (0.05%)
European: 32 (0.05%)
Egyptian: 15 (0.02%)
Nigerian: 14 (0.02%)
Dutch: 13 (0.02%)
Croatian: 11 (0.02%)
Canadian: 10 (0.01%)
Danish: 9 (0.01%)
French: 9 (0.01%)
Ugandan: 8 (0.01%)
Brazilian: 7 (0.01%)
Eastern European: 5 (0.01%)
Arab: 4 (0.01%) Most common places of birth for foreign-born residents (%): Mexico South Gate:
76.8% (28,695)California:
37.2% (3,881,193)
El Salvador South Gate:
7.8% (2,921)California:
4.2% (440,287)
Guatemala South Gate:
4.9% (1,846)California:
2.8% (290,436)
Honduras South Gate:
2.6% (976)California:
0.6% (66,590)
Nicaragua South Gate:
1.7% (632)California:
0.6% (58,161)
Place of birth for U.S.-born residents:
This state: 50,961Other state: 2,729Northeast: 232Midwest: 286South: 1,844West: 367 94.7% of South Gate residents lived in the same house 1 years ago.
Out of people who lived in different houses, 43.8% lived in this county.
Out of people who lived in different counties, 74.8% lived in California.
South Gate:
94.7%State average:
88.9%
Education attainment for males 25 years and older:
No schooling: 2,816Nursery to 4th grade: 1,0805th and 6th grade: 2,4227th and 8th grade: 1,5009th grade: 80110th grade: 77411th grade: 66912th grade, no diploma: 1,563High school graduate (or equivalency): 7,559Less than 1 year of college: 1,377Some college more than 1 year, no degree: 3,595Associate degree: 1,615Bachelor's degree: 2,788Master's degree: 488Professional school degree: 44Doctorate degree: 174
Education attainment for females 25 years and older:
No schooling: 3,024Nursery to 4th grade: 1,9735th and 6th grade: 1,8287th and 8th grade: 1,2809th grade: 1,69210th grade: 89011th grade: 61312th grade, no diploma: 1,688High school graduate (or equivalency): 7,632Less than 1 year of college: 1,057Some college more than 1 year, no degree: 3,513Associate degree: 2,013Bachelor's degree: 3,268Master's degree: 615Professional school degree: 147Doctorate degree: 0
Housing units in structures:
One, detached: 14,012One, attached: 2,187Two: 1,2913 or 4: 2,8405 to 9: 1,86010 to 19: 1,24320 to 49: 73650 or more: 1,655Mobile homes: 154Boats, RVs, vans, etc.: 105Housing units lacking complete kitchen facilities in 2022: 3.0%House/condo owner moved in on average 20 years ago
Renter moved in on average 6 years ago
Private vs. public school enrollment:
Students in private schools in grades 1 to 8 (elementary and middle school): 379 Here:
3.9%California:
10.5%
Students in private schools in grades 9 to 12 (high school): 312 Students in private undergraduate colleges: 955 Here:
15.7%California:
15.9%