Housing density: 325 houses/condos per square mile
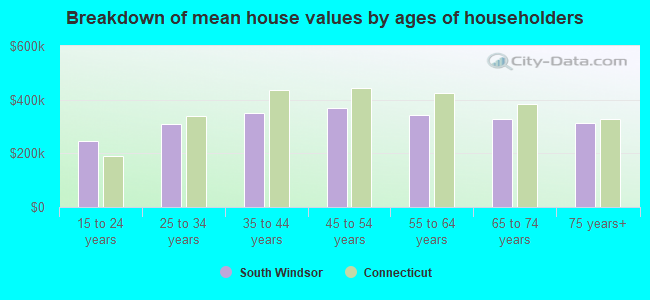
Median price asked for vacant for-sale houses and condos in 2022 in this county: $360,195.
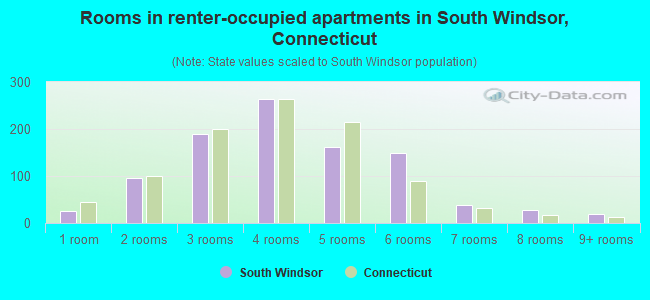
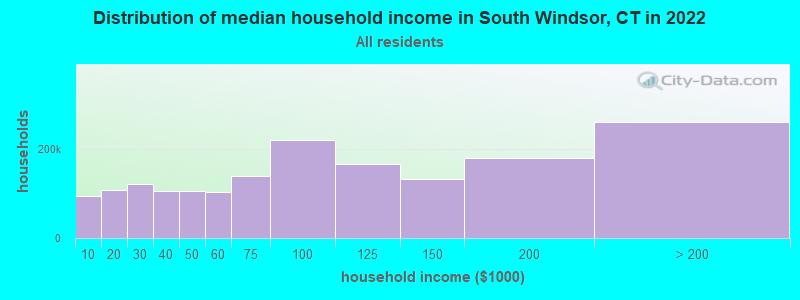
Median contract rent in 2022: $1,433 (lower quartile is $1,118, upper quartile is $1,974)
Median rent asked for vacant for-rent units in 2022: $1,104
Median gross rent in South Windsor, CT in 2022: $1,685
Housing units in South Windsor with a mortgage: 5,378 (506 second mortgage, 938 home equity loan, 24 both second mortgage and home equity loan) Houses without a mortgage: 1,664
Compare current foreclosures near South Windsor, CT:
In family households: 715,089 (143,179 male householders, 84,652 female householders)
161,327 spouses, 258,438 children (243,975 natural, 5,783 adopted, 8,680 stepchildren), 15,602 grandchildren, 8,779 brothers or sisters, 9,385 parents, foster children, 10,085 other relatives, 18,701 non-relatives
In nonfamily households: 150,698 (54,155 male householders (41,831 living alone)), 68,868 female householders (58,693 living alone)), 27,675 nonrelatives
In group quarters: 28,227 (15,383 institutionalized population)
135,700 married couples with children.
56,984 single-parent households (8,611 men, 48,373 women).
86.4% of residents of South Windsor speak English at home.
2.5% of residents speak Spanish at home (69% speak English very well, 21% speak English well, 10% speak English not well).
8.1% of residents speak other Indo-European language at home (74% speak English very well, 17% speak English well, 9% speak English not well).
2.5% of residents speak Asian or Pacific Island language at home (53% speak English very well, 24% speak English well, 20% speak English not well, 3% don't speak English at all).
0.5% of residents speak other language at home (85% speak English very well, 15% speak English well).
Foreign born population: 3,723 (14.4%)
(72.5% of them are naturalized citizens)
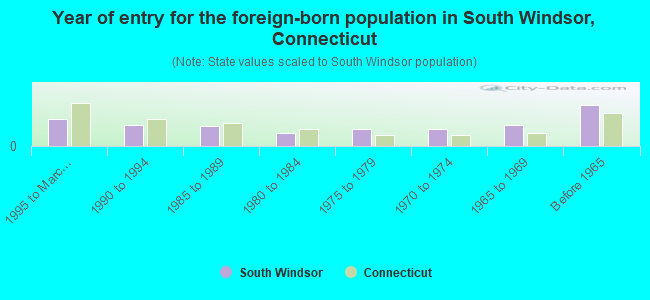
Year of entry for the foreign-born population in South Windsor, Connecticut
3701995 to March 2000
2851990 to 1994
2721985 to 1989
1801980 to 1984
2331975 to 1979
2351970 to 1974
2811965 to 1969
561Before 1965
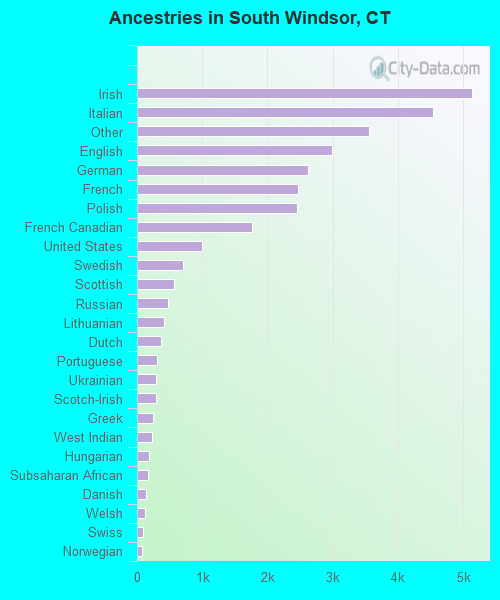
First ancestries reported:
Irish: 5,138 (16.4%)
Italian: 4,536 (14.5%)
Other: 3,563 (11.4%)
English: 2,992 (9.5%)
German: 2,620 (8.3%)
French: 2,464 (7.9%)
Polish: 2,445 (7.8%)
French Canadian: 1,768 (5.6%)
United States: 992 (3.2%)
Swedish: 705 (2.2%)
Scottish: 561 (1.8%)
Russian: 481 (1.5%)
Lithuanian: 413 (1.3%)
Dutch: 375 (1.2%)
Portuguese: 301 (1.0%)
Ukrainian: 295 (0.9%)
Scotch-Irish: 286 (0.9%)
Greek: 248 (0.8%)
West Indian: 234 (0.7%)
Hungarian: 189 (0.6%)
Subsaharan African: 167 (0.5%)
Danish: 138 (0.4%)
Welsh: 130 (0.4%)
Swiss: 99 (0.3%)
Norwegian: 77 (0.2%)
Czech: 59 (0.2%)
Arab: 54 (0.2%)
Slovak: 52 (0.2%)
Most common places of birth for foreign-born residents (%):
Canada
South Windsor:
16.3% (395)
Connecticut:
5.2% (19,083)
Poland
South Windsor:
7.2% (173)
Connecticut:
6.9% (25,507)
India
South Windsor:
6.5% (158)
Connecticut:
4.1% (15,108)
Italy
South Windsor:
6.3% (152)
Connecticut:
7.0% (26,023)
Jamaica
South Windsor:
4.8% (115)
Connecticut:
7.2% (26,819)
Korea
South Windsor:
4.7% (113)
Connecticut:
1.5% (5,508)
United Kingdom
South Windsor:
4.2% (102)
Connecticut:
4.4% (16,395)
Ireland
South Windsor:
3.6% (88)
Connecticut:
1.2% (4,344)
Vietnam
South Windsor:
3.5% (84)
Connecticut:
1.8% (6,680)
China, excluding Hong Kong and Taiwan
South Windsor:
3.4% (83)
Connecticut:
2.5% (9,358)
Colombia
South Windsor:
3.4% (81)
Connecticut:
3.2% (12,009)
Philippines
South Windsor:
3.3% (80)
Connecticut:
1.7% (6,247)
Germany
South Windsor:
3.2% (77)
Connecticut:
3.1% (11,432)
Peru
South Windsor:
2.8% (68)
Connecticut:
2.1% (7,612)
Portugal
South Windsor:
2.6% (63)
Connecticut:
3.6% (13,234)
South Africa
South Windsor:
2.2% (52)
Connecticut:
0.3% (1,269)
Greece
South Windsor:
2.1% (50)
Connecticut:
1.2% (4,622)
Other Caribbean
South Windsor:
1.9% (46)
Connecticut:
0.7% (2,569)
Hungary
South Windsor:
1.8% (43)
Connecticut:
0.7% (2,646)
Place of birth for U.S.-born residents:
This state: 15,364
Other state: 6,487
Northeast: 4,657
Midwest: 885
South: 721
West: 224
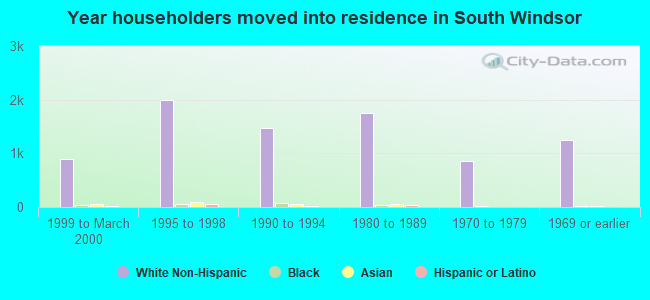
68% of South Windsor residents lived in the same house 5 years ago. Out of people who lived in different houses, 69% lived in this county. Out of people who lived in different counties, 47% lived in Connecticut.
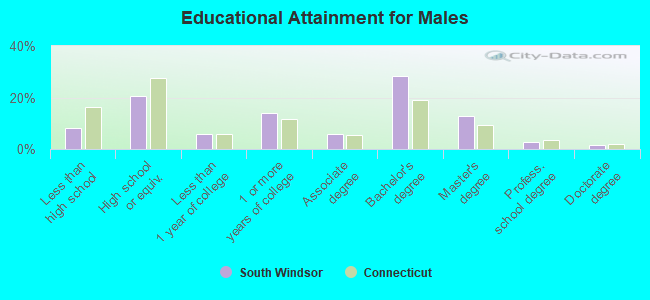
Education attainment for males 25 years and older:
No schooling: 26
Nursery to 4th grade: 21
5th and 6th grade: 44
7th and 8th grade: 197
9th grade: 36
10th grade: 94
11th grade: 54
12th grade, no diploma: 170
High school graduate (or equivalency): 1,601
Less than 1 year of college: 435
Some college more than 1 year, no degree: 1,076
Associate degree: 442
Bachelor's degree: 2,179
Master's degree: 988
Professional school degree: 215
Doctorate degree: 129
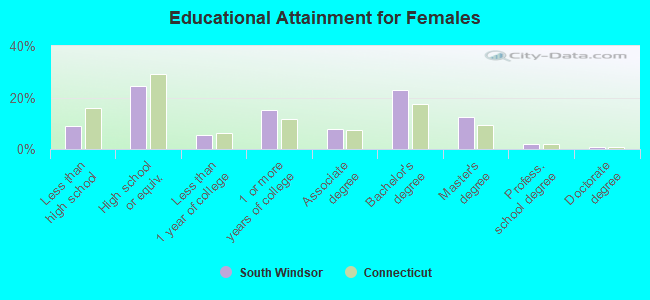
Education attainment for females 25 years and older:
No schooling: 35
Nursery to 4th grade: 12
5th and 6th grade: 80
7th and 8th grade: 194
9th grade: 102
10th grade: 140
11th grade: 65
12th grade, no diploma: 156
High school graduate (or equivalency): 2,175
Less than 1 year of college: 486
Some college more than 1 year, no degree: 1,326
Associate degree: 695
Bachelor's degree: 2,030
Master's degree: 1,081
Professional school degree: 183
Doctorate degree: 71
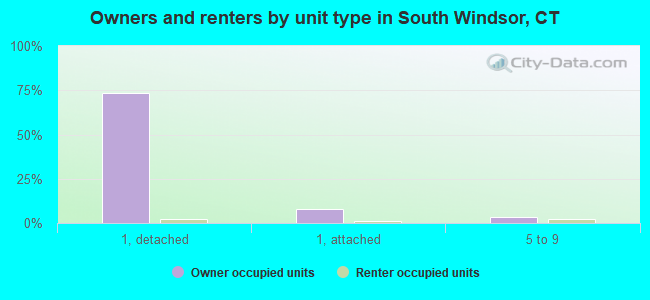
Housing units in structures:
One, detached: 6,874
One, attached: 802
Two: 145
3 or 4: 197
5 to 9: 541
10 to 19: 240
20 to 49: 34
50 or more: 117
Mobile homes: 130
Median worth of mobile homes: $45,631
Housing units lacking complete plumbing facilities: 0.3%
Housing units lacking complete kitchen facilities: 0.7%