St. Joseph, MO (Missouri) Houses and Residents
Estimated median house or condo value in 2022: $149,800 (it was $68,800 in 2000 )
St. Joseph:
$149,800Missouri:
$221,200
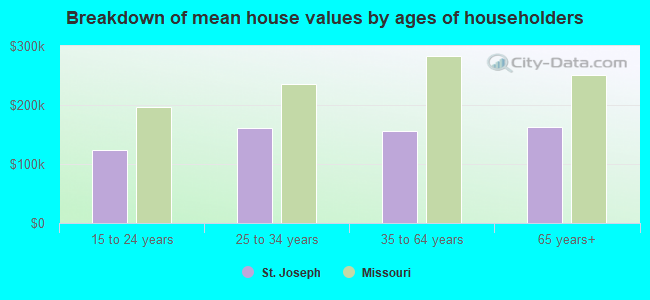
Lower value quartile - upper value quartile: $81,500 - $220,500Mean price in 2022: Detached houses: $219,550 Here:
$219,550State:
$278,068
Townhouses or other attached units: $229,304 Here:
$229,304State:
$260,773
In 2-unit structures: $233,353 Here:
$233,353State:
$172,667
In 3-to-4-unit structures: $442,283 Here:
$442,283State:
$181,162
In 5-or-more-unit structures: $47,969 Here:
$47,969State:
$263,082
Mobile homes: $46,385 Here:
$46,385State:
$95,912
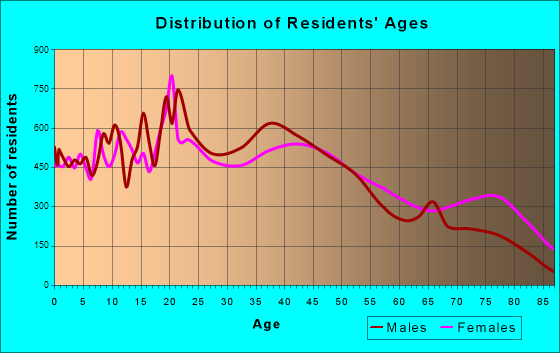
Total population: 76,967 (Urban population: 73,155, Rural population: 674 (26 farm, 648 nonfarm ))
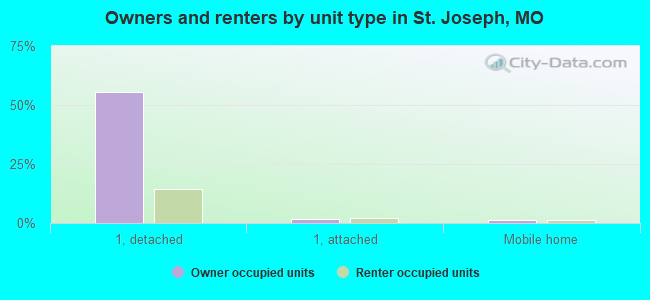
Houses: 33,092 (29,214 occupied: 17,830 owner occupied, 11,384 renter occupied )
% of renters here:
39%State:
32%
Housing density: 755 houses/condos per square mile
Median price asked for vacant for-sale houses and condos in 2022: $199,699.
Median contract rent in 2022: $622 (lower quartile is $482, upper quartile is $748)
Median rent asked for vacant for-rent units in 2022: $495
Median gross rent in St. Joseph, MO in 2022: $800
Housing units in St. Joseph with a mortgage: 10,256 (510 second mortgage, 0 home equity loan, 465 both second mortgage and home equity loan )Houses without a mortgage: 167
Median household income for houses/condos with a mortgage: $75,186
Median household income for apartments without a mortgage: $48,327
Median monthly housing costs: $805
Data:
Median house or condo value ($)
Median house or condo value ($ change since 2000)
Median house or condo value ($) - White
Median house or condo value ($) - Black or African American
Median house or condo value ($) - Asian
Median house or condo value ($) - Hispanic or Latino
Median house or condo value ($) - American Indian and Alaska Native
Median house or condo value ($) - Multirace
Median house or condo value ($) - Other Race
Median price asked for mobile homes ($)
Household density (households per square mile)
Mean house or condo value by units in structure - 1, detached ($)
Mean house or condo value by units in structure - 1, attached ($)
Mean house or condo value by units in structure - 2 ($)
Mean house or condo value by units in structure by units in structure - 3 or 4 ($)
Mean house or condo value by units in structure - 5 or more ($)
Mean house or condo value by units in structure - Boat, RV, van, etc. ($)
Mean house or condo value by units in structure - Mobile home ($)
Median contract rent ($)
Median contract rent - Lower quartile ($)
Median contract rent - Upper quartile ($)
Median gross rent ($)
Urban houses (%)
Rural houses (%)
Houses occupied (%)
Houses occupied (% change since 2000)
Houses owner occupied (%)
Houses owner occupied (% change since 2000)
Houses renter occupied (%)
Houses renter occupied (% change since 2000)
Vacant housing units - For rent (%)
Vacant housing units - For rent (% change since 2000)
Vacant housing units - For sale only (%)
Vacant housing units - For sale only (% change since 2000)
Vacant housing units - Rented or sold, not occupied (%)
Vacant housing units - Rented or sold, not occupied (% change since 2000)
Vacant housing units - For seasonal, recreational, or occasional use (%)
Vacant housing units - For seasonal, recreational, or occasional use (% change since 2000)
Vacant housing units - For migrant workers (%)
Vacant housing units - For migrant workers (% change since 2000)
Vacant housing units - Other vacant (%)
Vacant housing units - Other vacant (% change since 2000)
Median monthly housing costs ($)
Median household income for houses/condos with a mortgage ($)
Median household income for houses/condos without a mortgage ($)
Median household income ($)
Median household income ($) - White
Median household income ($) - Black or African American
Median household income ($) - Asian
Median household income ($) - Hispanic or Latino
Median household income ($) - American Indian and Alaska Native
Median household income ($) - Multirace
Median household income ($) - Other Race
Mortgage status - with mortgage (%)
Mortgage status - with second mortgage (%)
Mortgage status - with home equity loan (%)
Mortgage status - with both second mortgage and home equity loan (%)
Mortgage status - without a mortgage (%)
Median year house/condo built
Median year apartment built
Household type by relationship - Male householder living alone (%)
Household type by relationship - Male householder not living alone (%)
Household type by relationship - Female householder living alone (%)
Household type by relationship - Female householder not living alone (%)
Household type by relationship - Opposite-Sex spouse (%)
Household type by relationship - Same-Sex spouse (%)
Household type by relationship - Opposite-Sex unmarried partner (%)
Household type by relationship - Same-Sex unmarried partner (%)
Household type by relationship - In group quarters (%)
Size of family households - 2-person household (%)
Size of family households - 3-person household (%)
Size of family households - 4-person household (%)
Size of family households - 5-person household (%)
Size of family households - 6-person household (%)
Size of family households - 7-or-more-person household (%)
Size of nonfamily households - 1-person household (%)
Size of nonfamily households - 2-person household (%)
Size of nonfamily households - 3-person household (%)
Size of nonfamily households - 4-person household (%)
Size of nonfamily households - 5-person household (%)
Size of nonfamily households - 6-person household (%)
Size of nonfamily households - 7-or-moreperson household (%)
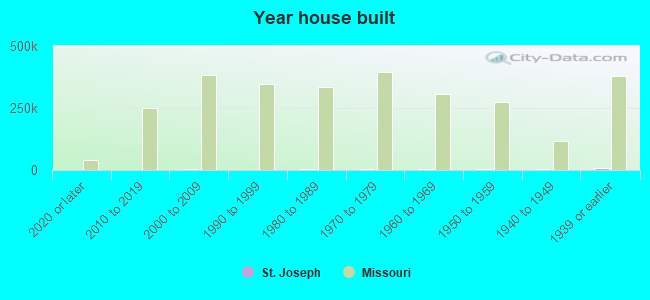
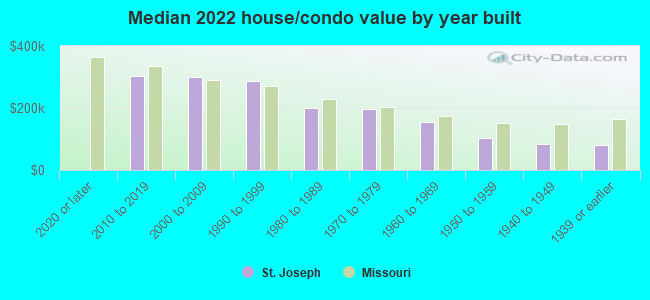
Year house built - Built 2010 or later (%)
Year house built - Built 2000 to 2009 (%)
Year house built - Built 1990 to 1999 (%)
Year house built - Built 1980 to 1989 (%)
Year house built - Built 1970 to 1979 (%)
Year house built - Built 1960 to 1969 (%)
Year house built - Built 1950 to 1959 (%)
Year house built - Built 1940 to 1949 (%)
Year house built - Built 1939 or earlier (%)
Median number of rooms in houses and condos
Median number of rooms in apartments
Median number of bedrooms in owner occupied houses
Mean number of bedrooms in owner occupied houses
Median number of bedrooms in renter occupied houses
Mean number of bedrooms in renter occupied houses
Median number of vehichles in owner occupied houses
Mean number of vehichles in owner occupied houses
Median number of vehichles in renter occupied houses
Mean number of vehichles in renter occupied houses
Rooms in owner-occupied houses - 1 room (%)
Rooms in owner-occupied houses - 2 rooms (%)
Rooms in owner-occupied houses - 3 rooms (%)
Rooms in owner-occupied houses - 4 rooms (%)
Rooms in owner-occupied houses - 5 rooms (%)
Rooms in owner-occupied houses - 6 rooms (%)
Rooms in owner-occupied houses - 7 rooms (%)
Rooms in owner-occupied houses - 8 rooms (%)
Rooms in owner-occupied houses - 9+ rooms (%)
Rooms in renter-occupied houses - 1 room (%)
Rooms in renter-occupied houses - 2 rooms (%)
Rooms in renter-occupied houses - 3 rooms (%)
Rooms in renter-occupied houses - 4 rooms (%)
Rooms in renter-occupied houses - 5 rooms (%)
Rooms in renter-occupied houses - 6 rooms (%)
Rooms in renter-occupied houses - 7 rooms (%)
Rooms in renter-occupied houses - 8 rooms (%)
Rooms in renter-occupied houses - 9+ rooms (%)
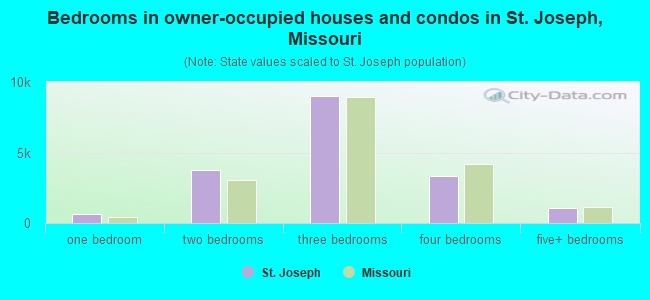
Bedrooms in owner-occupied houses - no bedrooms (%)
Bedrooms in owner-occupied houses - 1 bedroom (%)
Bedrooms in owner-occupied houses - 2 bedrooms (%)
Bedrooms in owner-occupied houses - 3 bedrooms (%)
Bedrooms in owner-occupied houses - 4 bedrooms (%)
Bedrooms in owner-occupied houses - 5+ bedrooms (%)
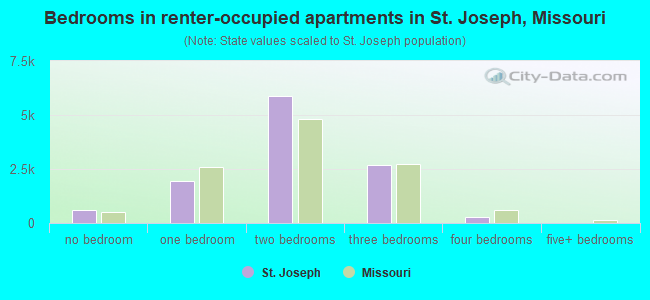
Bedrooms in renter-occupied houses - no bedrooms (%)
Bedrooms in renter-occupied houses - 1 bedroom (%)
Bedrooms in renter-occupied houses - 2 bedrooms (%)
Bedrooms in renter-occupied houses - 3 bedrooms (%)
Bedrooms in renter-occupied houses - 4 bedrooms (%)
Bedrooms in renter-occupied houses - 5+ bedrooms (%)
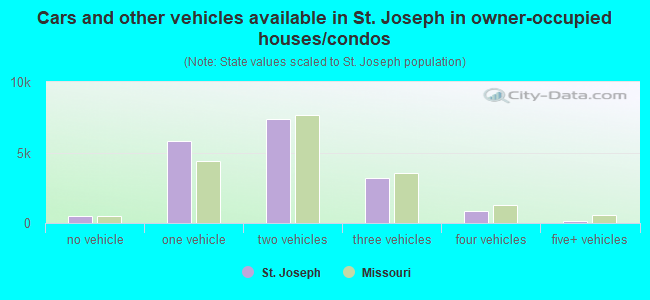
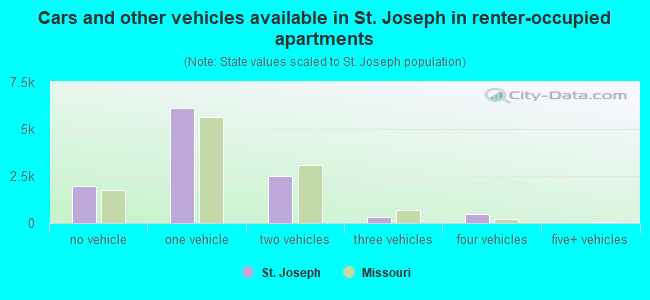
Vehicles available in owner-occupied houses - no vehicle available (%)
Vehicles available in owner-occupied houses - 1 vehicle available(%)
Vehicles available in owner-occupied houses - 2 Vehicles available (%)
Vehicles available in owner-occupied houses - 3 Vehicles available (%)
Vehicles available in owner-occupied houses - 4 Vehicles available (%)
Vehicles available in owner-occupied houses - 5+ Vehicles available (%)
Vehicles available in renter-occupied houses - no vehicle available (%)
Vehicles available in renter-occupied houses - 1 vehicle available (%)
Vehicles available in renter-occupied houses - 2 Vehicles available (%)
Vehicles available in renter-occupied houses - 3 Vehicles available (%)
Vehicles available in renter-occupied houses - 4 Vehicles available (%)
Vehicles available in renter-occupied houses - 5+ Vehicles available (%)
Housing units in structures - 1, detached (%)
Housing units in structures - 1, attached (%)
Housing units in structures - 2 (%)
Housing units in structures - 3 or 4 (%)
Housing units in structures - 5 to 9 (%)
Housing units in structures - 10 to 19 (%)
Housing units in structures - 20 to 49 (%)
Housing units in structures - 50 or more (%)
Housing units in structures - Mobile home (%)
Housing units in structures - Boat, RV, van, etc. (%)
Housing units in structures - Owners - 1, detached (%)
Housing units in structures - Owners - 1, attached (%)
Housing units in structures - Owners - 2 (%)
Housing units in structures - Owners - 3 or 4 (%)
Housing units in structures - Owners - 5 to 9 (%)
Housing units in structures - Owners - 10 to 19 (%)
Housing units in structures - Owners - 20 to 49 (%)
Housing units in structures - Owners - 50 or more (%)
Housing units in structures - Owners - Mobile home (%)
Housing units in structures - Owners - Boat, RV, van, etc. (%)
Housing units in structures - Renters - 1, detached (%)
Housing units in structures - Renters - 1, attached (%)
Housing units in structures - Renters - 2 (%)
Housing units in structures - Renters - 3 or 4 (%)
Housing units in structures - Renters - 5 to 9 (%)
Housing units in structures - Renters - 10 to 19 (%)
Housing units in structures - Renters - 20 to 49 (%)
Housing units in structures - Renters - 50 or more (%)
Housing units in structures - Renters - Mobile home (%)
Housing units in structures - Renters - Boat, RV, van, etc. (%)
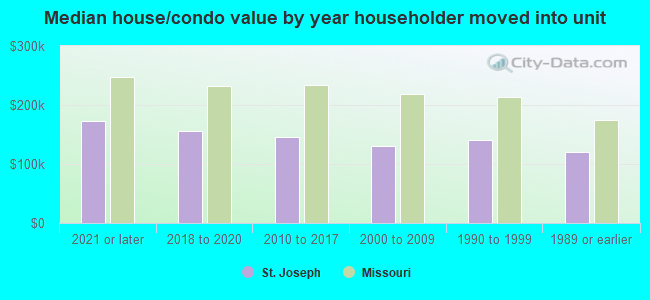
House/condo owner moved in on average (years ago)
Renter moved in on average (years ago)
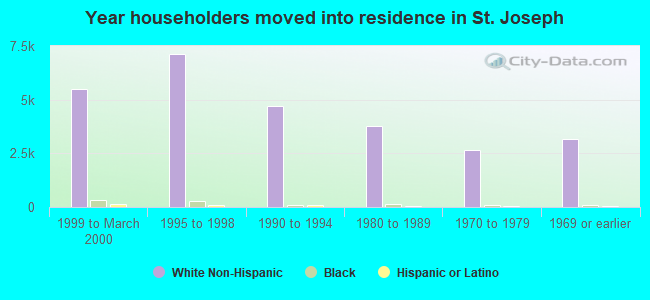
Year householder moved into unit - Moved in 1999 to March 2000 (%)
Year householder moved into unit - Moved in 1999 to March 2000 (%) - White
Year householder moved into unit - Moved in 1999 to March 2000 (%) - Black or African American
Year householder moved into unit - Moved in 1999 to March 2000 (%) - Asian
Year householder moved into unit - Moved in 1999 to March 2000 (%) - Hispanic or Latino
Year householder moved into unit - Moved in 1999 to March 2000 (%) - American Indian and Alaska Native
Year householder moved into unit - Moved in 1999 to March 2000 (%) - Multirace
Year householder moved into unit - Moved in 1999 to March 2000 (%) - Other Race
Year householder moved into unit - Moved in 1995 to 1998 (%)
Year householder moved into unit - Moved in 1995 to 1998 (%) - White
Year householder moved into unit - Moved in 1995 to 1998 (%) - Black or African American
Year householder moved into unit - Moved in 1995 to 1998 (%) - Asian
Year householder moved into unit - Moved in 1995 to 1998 (%) - Hispanic or Latino
Year householder moved into unit - Moved in 1995 to 1998 (%) - American Indian and Alaska Native
Year householder moved into unit - Moved in 1995 to 1998 (%) - Multirace
Year householder moved into unit - Moved in 1995 to 1998 (%) - Other Race
Year householder moved into unit - Moved in 1990 to 1994 (%)
Year householder moved into unit - Moved in 1990 to 1994 (%) - White
Year householder moved into unit - Moved in 1990 to 1994 (%) - Black or African American
Year householder moved into unit - Moved in 1990 to 1994 (%) - Asian
Year householder moved into unit - Moved in 1990 to 1994 (%) - Hispanic or Latino
Year householder moved into unit - Moved in 1990 to 1994 (%) - American Indian and Alaska Native
Year householder moved into unit - Moved in 1990 to 1994 (%) - Multirace
Year householder moved into unit - Moved in 1990 to 1994 (%) - Other Race
Year householder moved into unit - Moved in 1980 to 1989 (%)
Year householder moved into unit - Moved in 1980 to 1989 (%) - White
Year householder moved into unit - Moved in 1980 to 1989 (%) - Black or African American
Year householder moved into unit - Moved in 1980 to 1989 (%) - Asian
Year householder moved into unit - Moved in 1980 to 1989 (%) - Hispanic or Latino
Year householder moved into unit - Moved in 1980 to 1989 (%) - American Indian and Alaska Native
Year householder moved into unit - Moved in 1980 to 1989 (%) - Multirace
Year householder moved into unit - Moved in 1980 to 1989 (%) - Other Race
Year householder moved into unit - Moved in 1970 to 1979 (%)
Year householder moved into unit - Moved in 1970 to 1979 (%) - White
Year householder moved into unit - Moved in 1970 to 1979 (%) - Black or African American
Year householder moved into unit - Moved in 1970 to 1979 (%) - Asian
Year householder moved into unit - Moved in 1970 to 1979 (%) - Hispanic or Latino
Year householder moved into unit - Moved in 1970 to 1979 (%) - American Indian and Alaska Native
Year householder moved into unit - Moved in 1970 to 1979 (%) - Multirace
Year householder moved into unit - Moved in 1970 to 1979 (%) - Other Race
Year householder moved into unit - Moved in 1969 or earlier (%)
Year householder moved into unit - Moved in 1969 or earlier (%) - White
Year householder moved into unit - Moved in 1969 or earlier (%) - Black or African American
Year householder moved into unit - Moved in 1969 or earlier (%) - Asian
Year householder moved into unit - Moved in 1969 or earlier (%) - Hispanic or Latino
Year householder moved into unit - Moved in 1969 or earlier (%) - American Indian and Alaska Native
Year householder moved into unit - Moved in 1969 or earlier (%) - Multirace
Year householder moved into unit - Moved in 1969 or earlier (%) - Other Race
Housing units lacking complete plumbing facilities (%)
Housing units lacking complete kitchen facilities (%)
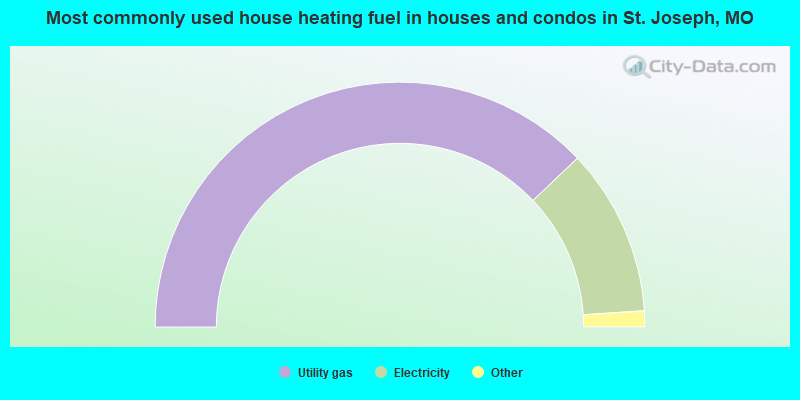
House heating fuel used in houses and condos - Utility gas (%)
House heating fuel used in houses and condos - Bottled, tank, or LP gas (%)
House heating fuel used in houses and condos - Electricity (%)
House heating fuel used in houses and condos - Fuel oil, kerosene, etc. (%)
House heating fuel used in houses and condos - Coal or coke (%)
House heating fuel used in houses and condos - Wood (%)
House heating fuel used in houses and condos - Solar energy (%)
House heating fuel used in houses and condos - Other fuel (%)
House heating fuel used in houses and condos - No fuel used (%)
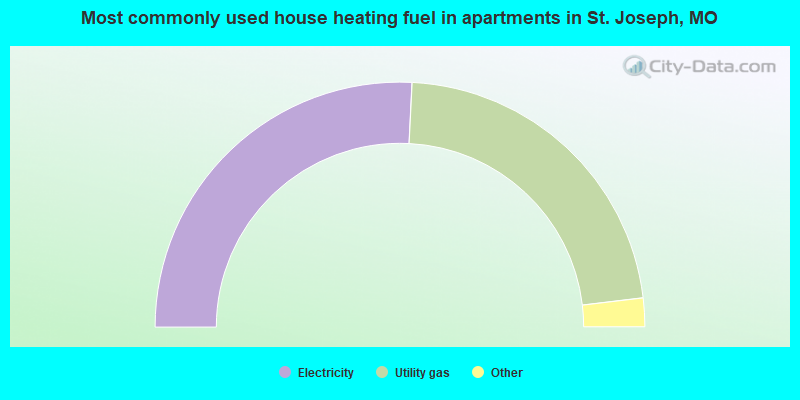
House heating fuel used in apartments - Utility gas (%)
House heating fuel used in apartments - Bottled, tank, or LP gas (%)
House heating fuel used in apartments - Electricity (%)
House heating fuel used in apartments - Fuel oil, kerosene, etc. (%)
House heating fuel used in apartments - Coal or coke (%)
House heating fuel used in apartments - Wood (%)
House heating fuel used in apartments - Solar energy (%)
House heating fuel used in apartments - Other fuel (%)
House heating fuel used in apartments - No fuel used (%)
Median year house/condo built: 1962Median year apartment built: 1970Household type by relationship:
Households: 70,682
Male householders: 13,739 (5,260 living alone ), Female householders: 15,475 (4,721 living alone )10,461 spouses (10,281 opposite-sex spouses ), 3,058 unmarried partners , (2,923 opposite-sex unmarried partners ), 17,670 children (16,406 natural , 248 adopted , 1,016 stepchildren ), 1,638 grandchildren , 443 brothers or sisters , 844 parents , 142 foster children , 952 other relatives , 3,260 non-relatives In group quarters: 3,000
Size of family households: 7,491 2-persons , 3,848 3-persons , 3,192 4-persons , 1,710 5-persons , 208 6-persons , 640 7-or-more-persons .
Size of nonfamily households: 9,981 1-person , 1,666 2-persons , 335 3-persons , 143 4-persons .
6,944 married couples with children. single-parent households (1,615 men , 4,888 women ).
92.5% of residents of St. Joseph speak English at home. of residents speak Spanish at home (50% speak English very well , 21% speak English well , 23% speak English not well , 6% don't speak English at all ).of residents speak other Indo-European language at home (80% speak English very well , 9% speak English well , 12% speak English not well ).of residents speak Asian or Pacific Island language at home (43% speak English very well , 30% speak English well , 16% speak English not well , 11% don't speak English at all ).of residents speak other language at home (68% speak English very well , 32% speak English well ).
Foreign born population: 3,898 (5.5%)of them are naturalized citizens )
Median number of rooms in houses and condos:
Median number of rooms in apartments
Owner-occupied Renter-occupied
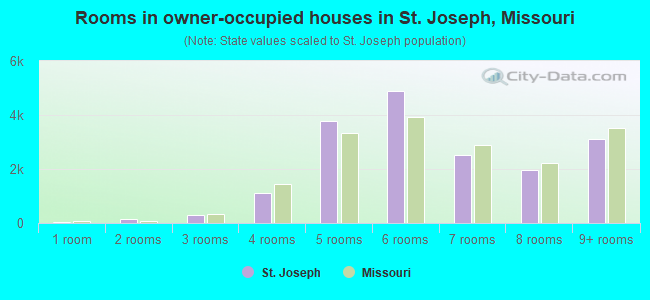
Rooms in owner-occupied houses in St. Joseph, Missouri
23 1 room 133 2 rooms 309 3 rooms 1,102 4 rooms 3,791 5 rooms 4,904 6 rooms 2,508 7 rooms 1,959 8 rooms 3,101 9+ rooms
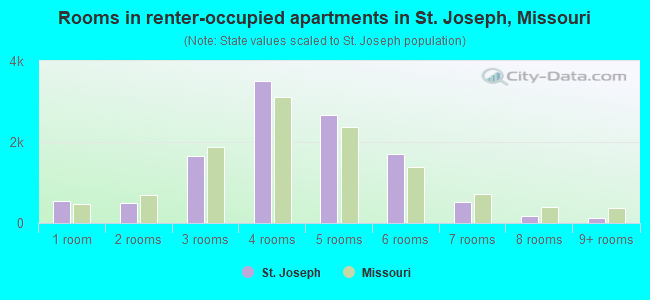
Rooms in renter-occupied apartments in St. Joseph, Missouri
545 1 room 496 2 rooms 1,658 3 rooms 3,503 4 rooms 2,657 5 rooms 1,706 6 rooms 522 7 rooms 165 8 rooms 132 9+ rooms
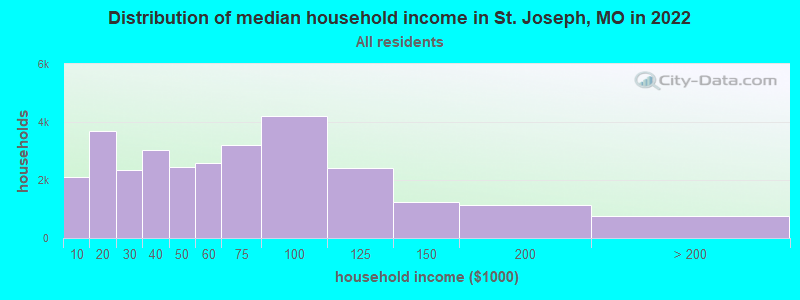
St. Joseph, MO household income distribution 2,105 Less than $10,0003,706 $10,000 to $19,9992,338 $20,000 to $29,9993,035 $30,000 to $39,9992,454 $40,000 to $49,9992,594 $50,000 to $59,9993,224 $60,000 to $74,9994,222 $75,000 to $99,9992,406 $100,000 to $124,9991,246 $125,000 to $149,9991,121 $150,000 to $199,999763 $200,000 or more
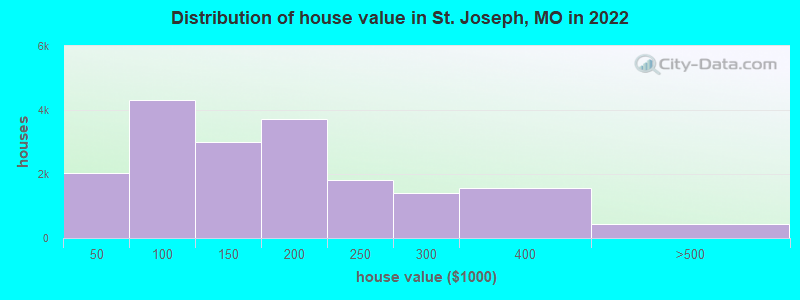
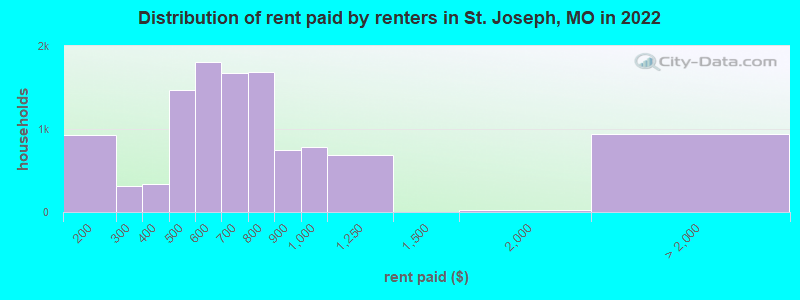
Home value of owner - occupied houses in 2022 in St. Joseph, MO 346 Less than $10,000183 $10,000 to $14,999193 $15,000 to $19,999201 $20,000 to $24,999472 $25,000 to $29,99925 $30,000 to $34,999171 $35,000 to $39,999439 $40,000 to $49,999454 $50,000 to $59,999923 $60,000 to $69,999856 $70,000 to $79,9991,256 $80,000 to $89,999392 $90,000 to $99,9991,536 $100,000 to $124,9991,477 $125,000 to $149,9992,297 $150,000 to $174,9991,407 $175,000 to $199,9991,815 $200,000 to $249,9991,416 $250,000 to $299,9991,548 $300,000 to $399,999347 $400,000 to $499,99955 $1,000,000 to $1,499,99921 $2,000,000 or moreRent paid by renters in 2022 in St. Joseph, MO 274 $100 to $149658 $150 to $199281 $200 to $24928 $250 to $299129 $300 to $349210 $350 to $399280 $400 to $4491,190 $450 to $4991,250 $500 to $549553 $550 to $599837 $600 to $649836 $650 to $6991,365 $700 to $749320 $750 to $799743 $800 to $899782 $900 to $999690 $1,000 to $1,24922 $1,500 to $1,999936 No cash rent
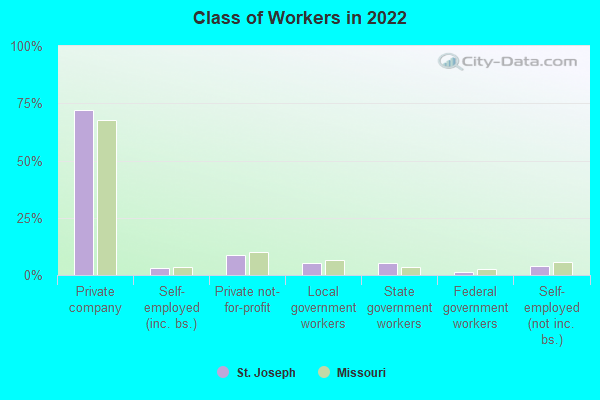
Percentage of workers working in this county: 89.6%Number of people working at home: 2,432 (7.5% of all workers )
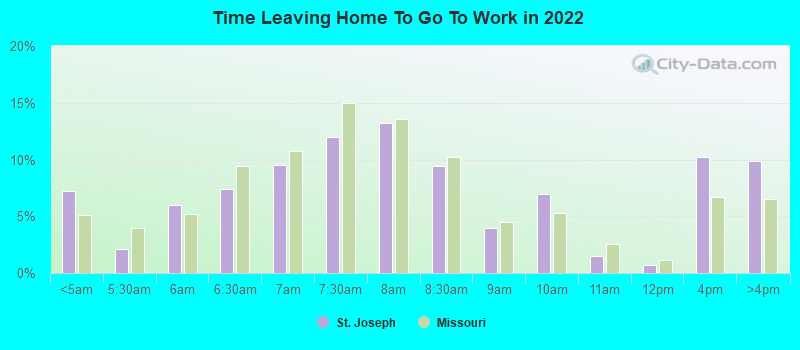
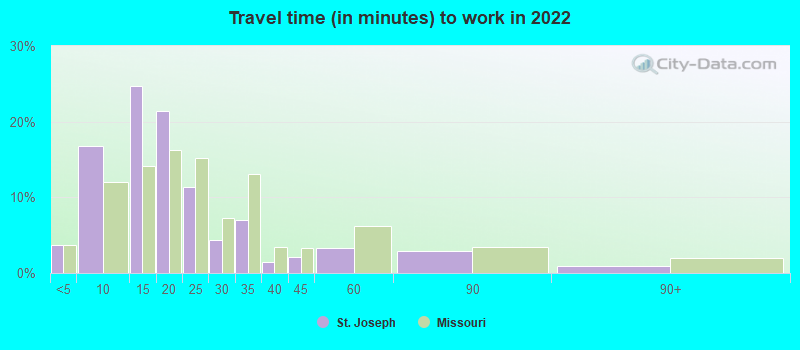
Travel time to work (commute)
Less than 5 minutes: 1,5215 to 9 minutes: 6,26110 to 14 minutes: 8,89015 to 19 minutes: 6,87520 to 24 minutes: 2,20425 to 29 minutes: 47930 to 34 minutes: 35835 to 39 minutes: 4940 to 44 minutes: 12745 to 59 minutes: 66260 to 89 minutes: 1,08990 or more minutes: 284
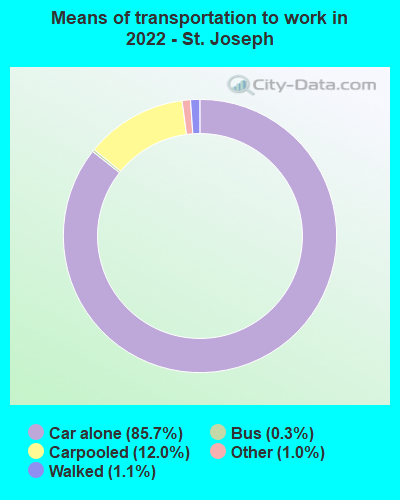
Means of transportation to work:
Drove a car alone: 35,614 (79.5%)Carpooled: 5,033 (11.2%)Bus : 101 (0.2%)Ferryboat: 2 (0.0%)Taxi: 410 (0.9%)Bicycle: 20 (0.0%)Walked: 428 (1.0%)Worked at home: 2,432 (5.4%)
Unemployment by race in 2022
Unemployment rate for White non-Hispanic residents 7.4% Males3.1% FemalesUnemployment rate for Black residents 10.8% Males5.0% FemalesUnemployment rate for American Indian and Alaska Native residents 2.7% MalesUnemployment rate for Asian residents 2.2% FemalesUnemployment rate for other race residents 1.4% Males13.0% FemalesUnemployment rate for two or more race residents 5.7% Males24.1% FemalesUnemployment rate for Hispanic or Latino residents 1.3% Males7.9% Females
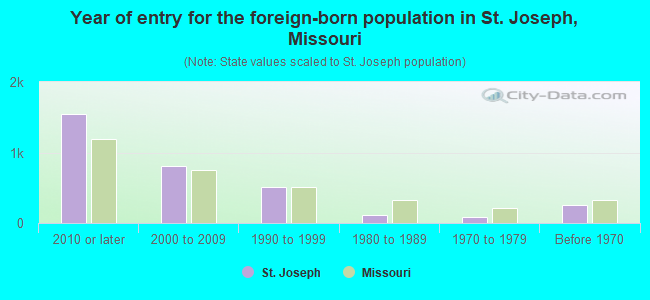
Year of entry for the foreign-born population in St. Joseph, Missouri
1,543 2010 or later 804 2000 to 2009 506 1990 to 1999 113 1980 to 1989 80 1970 to 1979 258 Before 1970
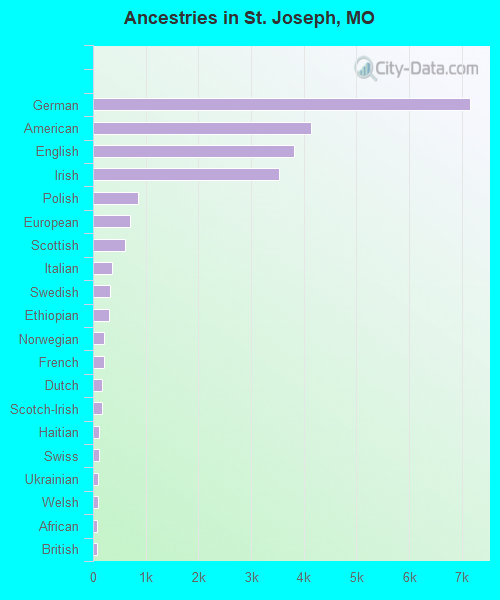
First ancestries reported:
German: 7,160 (20.6%)
American: 4,145 (11.9%)
English: 3,817 (11.0%)
Irish: 3,528 (10.1%)
Polish: 863 (2.5%)
European: 706 (2.0%)
Scottish: 604 (1.7%)
Italian: 352 (1.0%)
Swedish: 319 (0.9%)
Ethiopian: 299 (0.9%)
Norwegian: 214 (0.6%)
French: 205 (0.6%)
Dutch: 178 (0.5%)
Scotch-Irish: 176 (0.5%)
Haitian: 118 (0.3%)
Swiss: 106 (0.3%)
Ukrainian: 89 (0.3%)
Welsh: 87 (0.3%)
African: 82 (0.2%)
British: 75 (0.2%)
French Canadian: 63 (0.2%)
Belgian: 63 (0.2%)
Brazilian: 48 (0.1%)
Scandinavian: 43 (0.1%)
Lithuanian: 43 (0.1%)
Danish: 34 (0.10%)
Czech: 29 (0.08%)
Northern European: 28 (0.08%)
Sudanese: 25 (0.07%)
Slavic: 23 (0.07%)
Russian: 22 (0.06%)
Yugoslavian: 22 (0.06%)
Moroccan: 18 (0.05%)
Jamaican: 17 (0.05%)
Romanian: 13 (0.04%)
Hungarian: 13 (0.04%)
Syrian: 12 (0.03%)
Austrian: 12 (0.03%)
West Indian: 12 (0.03%)
Greek: 10 (0.03%)
Canadian: 10 (0.03%)
Armenian: 10 (0.03%)
South African: 10 (0.03%)
Lebanese: 9 (0.03%)
Croatian: 5 (0.01%)
Nigerian: 4 (0.01%)
Eastern European: 4 (0.01%)
Most common places of birth for foreign-born residents (%): Mexico St. Joseph:
25.3% (781)Missouri:
14.9% (38,568)
Cuba St. Joseph:
15.2% (468)Missouri:
1.1% (2,867)
El Salvador St. Joseph:
10.9% (336)Missouri:
1.5% (3,926)
Guatemala St. Joseph:
6.0% (184)Missouri:
2.8% (7,146)
India St. Joseph:
5.9% (183)Missouri:
8.9% (22,932)
Ethiopia St. Joseph:
4.9% (151)Missouri:
1.1% (2,751)
China, excluding Hong Kong and Taiwan St. Joseph:
4.4% (136)Missouri:
6.6% (17,002)
Philippines St. Joseph:
4.1% (127)Missouri:
4.2% (10,873)
Malaysia St. Joseph:
4.1% (126)Missouri:
0.2% (582)
Vietnam St. Joseph:
3.7% (113)Missouri:
4.1% (10,700)
Burma (Myanmar) St. Joseph:
3.5% (108)Missouri:
0.5% (1,247)
Eritrea St. Joseph:
1.9% (60)Missouri:
0.2% (498)
Congo St. Joseph:
1.8% (56)Missouri:
0.3% (657)
Sudan St. Joseph:
1.7% (54)Missouri:
0.3% (772)
Other Northern Africa St. Joseph:
1.7% (53)Missouri:
0.2% (476)
Hong Kong St. Joseph:
1.7% (51)Missouri:
0.3% (781)
Haiti St. Joseph:
1.6% (49)Missouri:
0.4% (1,107)
Place of birth for U.S.-born residents:
This state: 50,241Other state: 16,060Northeast: 608Midwest: 8,538South: 3,277West: 3,637 83.5% of St. Joseph residents lived in the same house 1 years ago.
Out of people who lived in different houses, 31.4% lived in this county.
Out of people who lived in different counties, 57.1% lived in Missouri.
St. Joseph:
83.5%State average:
87.1%
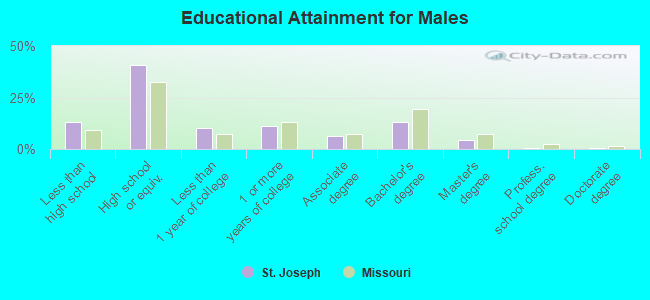
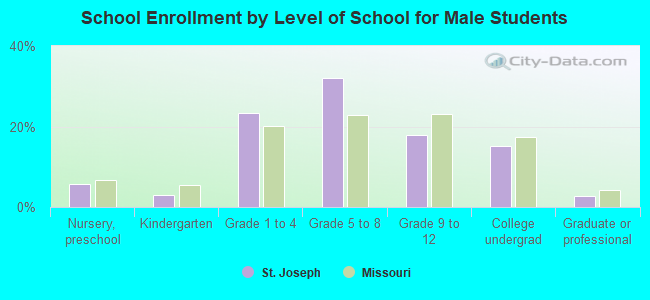
Education attainment for males 25 years and older:
No schooling: 353Nursery to 4th grade: 1225th and 6th grade: 1567th and 8th grade: 1469th grade: 45410th grade: 1,02611th grade: 33412th grade, no diploma: 463High school graduate (or equivalency): 9,405Less than 1 year of college: 2,315Some college more than 1 year, no degree: 2,642Associate degree: 1,429Bachelor's degree: 3,041Master's degree: 976Professional school degree: 154Doctorate degree: 153
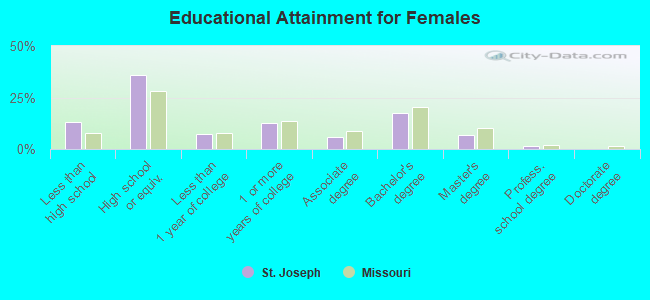
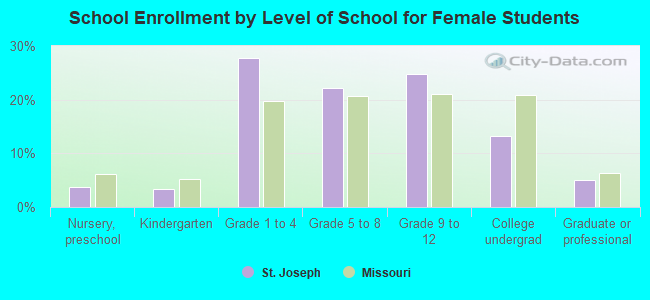
Education attainment for females 25 years and older:
No schooling: 251Nursery to 4th grade: 05th and 6th grade: 2227th and 8th grade: 6019th grade: 54210th grade: 55111th grade: 70512th grade, no diploma: 313High school graduate (or equivalency): 8,887Less than 1 year of college: 1,769Some college more than 1 year, no degree: 3,141Associate degree: 1,408Bachelor's degree: 4,249Master's degree: 1,629Professional school degree: 301Doctorate degree: 42
Housing units in structures:
One, detached: 23,315One, attached: 1,106Two: 8783 or 4: 9745 to 9: 2,43710 to 19: 1,06520 to 49: 1,66150 or more: 767Mobile homes: 799Boats, RVs, vans, etc.: 90Median worth of mobile homes: $18,701
Housing units lacking complete plumbing facilities in 2022: 3.5%Housing units lacking complete kitchen facilities in 2022: 7.0%House/condo owner moved in on average 11 years ago
Renter moved in on average 2 years ago
Private vs. public school enrollment:
Students in private schools in grades 1 to 8 (elementary and middle school): 1,722 Students in private schools in grades 9 to 12 (high school): 903 Students in private undergraduate colleges: 64