Stow, OH (Ohio) Houses and Residents
| Stow: | $243,723 |
| Ohio: | $204,100 |
Mean price in 2022:
Detached houses: $266,835
Here: $266,835 State: $254,366 Townhouses or other attached units: $201,708
Here: $201,708 State: $225,733 In 2-unit structures: $208,829
Here: $208,829 State: $144,384 In 3-to-4-unit structures: $190,774
Here: $190,774 State: $203,002 In 5-or-more-unit structures: $94,016
Here: $94,016 State: $211,593 Mobile homes: $129,741
Here: $129,741 State: $62,719
Total population: 34,773 (Urban population: 31,464, Rural population: 675 (all nonfarm))
Houses: 14,979 (13,886 occupied: 9,960 owner occupied, 4,007 renter occupied)
| % of renters here: | 29% |
| State: | 33% |
Housing density: 875 houses/condos per square mile
Median price asked for vacant for-sale houses and condos in 2022: $143,122.
Median contract rent in 2022: $968 (lower quartile is $835, upper quartile is $1,183)
Median rent asked for vacant for-rent units in 2022: $2,549
Median gross rent in Stow, OH in 2022: $1,127
Housing units in Stow with a mortgage: 6,850 (923 second mortgage, 0 home equity loan, 814 both second mortgage and home equity loan)
Houses without a mortgage: 606
Median household income for houses/condos with a mortgage: $113,281
Median household income for apartments without a mortgage: $74,379
Median monthly housing costs: $1,197
Compare current foreclosures in Stow, OH:
| Photo | Address | Area | Beds / Baths | Price | Details |
|---|---|---|---|---|---|

|
#1
Applewood Dr
Stow, OH 44224
|
1,120 sq. feet
|
2 baths 3 beds |
show details | |

|
#2
Englewood Dr
Stow, OH 44224
|
2,202 sq. feet
|
2 baths 3 beds |
show details | |

|
#3
Valley Forge Dr
Stow, OH 44224
|
1,818 sq. feet
|
3 baths 4 beds |
show details | |

|
#4
Wrens Dr S
Stow, OH 44224
|
1,024 sq. feet
|
2 baths 2 beds |
show details | |

|
#5
Kenneth Rd
Stow, OH 44224
|
1,014 sq. feet
|
1 baths 2 beds |
show details | |

|
#6
Margaret Ave
Stow, OH 44224
|
1,869 sq. feet
|
3 baths 3 beds |
show details | |

|
#7
N Gilwood Dr
Stow, OH 44224
|
1,175 sq. feet
|
2 baths 3 beds |
show details | |

|
#8
Hiwood Ave
Stow, OH 44224
|
912 sq. feet
|
1 baths 3 beds |
show details | |

|
#9
Genevieve Blvd
Stow, OH 44224
|
1,400 sq. feet
|
2 baths 2 beds |
show details | |

|
#10
Ritchie Rd
Stow, OH 44224
|
2,051 sq. feet
|
3 baths 4 beds |
show details |
| Photo | Address | Area | Beds / Baths | Price | Details |
|---|---|---|---|---|---|

|
#11
Willowdale Dr
Stow, OH 44224
|
1,521 sq. feet
|
2 baths 3 beds |
show details | |

|
#12
Hiwood Ave
Stow, OH 44224
|
1,092 sq. feet
|
1 baths 3 beds |
show details | |

|
#13
Baird Rd
Stow, OH 44224
|
1,608 sq. feet
|
2 baths 4 beds |
show details | |

|
#14
Silver Lake Blvd
Stow, OH 44224
|
3,745 sq. feet
|
4 baths 4 beds |
show details | |

|
#15
Mockingbird Trl
Stow, OH 44224
|
1,960 sq. feet
|
3 baths 4 beds |
show details | |

|
#16
Kauffman Rd
Stow, OH 44224
|
1,344 sq. feet
|
1 baths 3 beds |
show details | |

|
#17
Kauffman Rd
Stow, OH 44224
|
1,152 sq. feet
|
2 baths 3 beds |
show details | |

|
#18
Portland Cv
Stow, OH 44224
|
1,868 sq. feet
|
3 baths 4 beds |
show details | |

|
#19
Darrow Rd
Stow, OH 44224
|
1,512 sq. feet
|
1 baths 3 beds |
show details | |

|
#20
Hiwood Ave
Stow, OH 44224
|
1,092 sq. feet
|
1 baths 3 beds |
show details |
| Photo | Address | Area | Beds / Baths | Price | Details |
|---|---|---|---|---|---|

|
#21
Villas Dr
Stow, OH 44224
|
1,286 sq. feet
|
2 baths 2 beds |
show details | |

|
#22
Sanford Ave
Stow, OH 44224
|
1,002 sq. feet
|
1 baths 3 beds |
show details | |

|
#23
Englewood Dr
Stow, OH 44224
|
2,202 sq. feet
|
1 baths 3 beds |
show details | |

|
#24
Conwill Rd
Stow, OH 44224
|
1,118 sq. feet
|
1 baths 3 beds |
show details | |

|
#25
Bunker Ln
Stow, OH 44224
|
2,762 sq. feet
|
3 baths 5 beds |
show details | |

|
#26
Mohican Rd
Stow, OH 44224
|
1,432 sq. feet
|
1 baths 3 beds |
show details | |

|
#27
Fishcreek Rd
Stow, OH 44224
|
832 sq. feet
|
1 baths 2 beds |
show details | |

|
#28
Call Rd
Stow, OH 44224
|
1,030 sq. feet
|
1 baths 2 beds |
show details | |

|
#29
Garnet Cir
Stow, OH 44224
|
1,940 sq. feet
|
2 baths 4 beds |
show details | |

|
#30
Lorwood Dr
Stow, OH 44224
|
1,800 sq. feet
|
2 baths 4 beds |
show details |
| Photo | Address | Area | Beds / Baths | Price | Details |
|---|---|---|---|---|---|

|
#31
Charring Cross Dr
Stow, OH 44224
|
2,177 sq. feet
|
3 baths 3 beds |
show details | |

|
#32
Vira Rd
Stow, OH 44224
|
1,234 sq. feet
|
1 baths 3 beds |
show details | |

|
#33
Englewood Dr
Stow, OH 44224
|
1,880 sq. feet
|
1 baths 4 beds |
show details | |

|
#34
Baird Rd
Stow, OH 44224
|
1,700 sq. feet
|
1 baths 4 beds |
show details | |

|
#35
Osage St
Stow, OH 44224
|
1,014 sq. feet
|
1 baths 3 beds |
show details | |

|
#36
Wyoga Lake Blvd
Stow, OH 44224
|
1,722 sq. feet
|
2 baths 3 beds |
show details | |

|
#37
Higby Dr
Stow, OH 44224
|
1,276 sq. feet
|
1 baths 2 beds |
show details | |

|
#38
Kauffman Rd
Stow, OH 44224
|
1,152 sq. feet
|
1 baths 3 beds |
show details | |

|
#39
Berkeley Pl
Stow, OH 44224
|
2,344 sq. feet
|
2 baths 4 beds |
show details | |

|
#40
Hudson Dr # 171
Stow, OH 44224
|
2,828 sq. feet
|
1 baths 2 beds |
show details |
| Photo | Address | Area | Beds / Baths | Price | Details |
|---|---|---|---|---|---|

|
#41
Hastings Rd
Stow, OH 44224
|
2,214 sq. feet
|
2 baths 4 beds |
show details | |

|
#42
Wrens Dr S
Stow, OH 44224
|
1,024 sq. feet
|
1 baths 2 beds |
show details | |

|
#43
Cox Dr # B
Stow, OH 44224
|
1,218 sq. feet
|
1 baths 2 beds |
show details | |

|
#44
Falconswalk Ct
Stow, OH 44224
|
2,528 sq. feet
|
2 baths 3 beds |
show details | |

|
#45
Conwill Rd
Stow, OH 44224
|
1,334 sq. feet
|
1 baths 3 beds |
show details | |

|
#46
Springdale Rd
Stow, OH 44224
|
1,776 sq. feet
|
2 baths 4 beds |
show details | |

|
#47
Pemberton Dr
Stow, OH 44224
|
1,520 sq. feet
|
1 baths 3 beds |
show details | |

|
#48
Sanford Ave
Stow, OH 44224
|
990 sq. feet
|
2 baths 3 beds |
show details | |

|
#49
Higby Dr
Stow, OH 44224
|
- sq. feet
|
1 baths 3 beds |
show details | |

|
Check over 1 million property listings on Foreclosure.com!
|
browse all offers | |||

Latest news about housing in Stow, OH collected exclusively by city-data.com from local newspapers, TV, and radio stations

 | Nice townhomes or apartments around Stow, Ohio? (13 replies) |
| Stow, Ohio (14 replies) |
| possible move to Akron Ohio (5 replies) |
| Stow Hudson or another place for same sex household (13 replies) |
| Most New England-like communities b/t Akron and Cleveland (9 replies) |
| Looking for neighbourhood to rent apartment near Akron? (1 reply) |

Median year apartment built: 1983
Household type by relationship:
Households: 34,236- Male householders: 7,194 (1,382 living alone), Female householders: 6,573 (2,452 living alone)
7,542 spouses (7,515 opposite-sex spouses), 1,060 unmarried partners, (1,026 opposite-sex unmarried partners), 9,533 children (8,732 natural, 202 adopted, 598 stepchildren), 422 grandchildren, 188 brothers or sisters, 272 parents, 102 foster children, 144 other relatives, 762 non-relatives
- In group quarters: 442
Size of family households: 3,903 2-persons, 2,590 3-persons, 1,714 4-persons, 714 5-persons, 160 6-persons, 117 7-or-more-persons.
Size of nonfamily households: 3,882 1-person, 831 2-persons, 83 3-persons, 9 7-or-more-persons.
5,341 married couples with children.
1,200 single-parent households (398 men, 802 women).
94.1% of residents of Stow speak English at home.
0.6% of residents speak Spanish at home (92% speak English very well, 8% speak English well).
1.3% of residents speak other Indo-European language at home (66% speak English very well, 23% speak English well, 5% speak English not well, 6% don't speak English at all).
1.9% of residents speak Asian or Pacific Island language at home (56% speak English very well, 34% speak English well, 8% speak English not well, 3% don't speak English at all).
1.8% of residents speak other language at home (70% speak English very well, 30% speak English well).
Foreign born population: 1,671 (4.9%)
(58.0% of them are naturalized citizens)
| Here: | 7.5 |
| State: | 6.7 |
| Here: | 4.2 |
| State: | 4.4 |

- Bedrooms in owner-occupied houses and condos in Stow, Ohio
- 0no bedroom
- 581 bedroom
- 1,1502 bedrooms
- 4,6783 bedrooms
- 3,5174 bedrooms
- 5565+ bedrooms

- Bedrooms in renter-occupied apartments in Stow, Ohio
- 112no bedroom
- 7301 bedroom
- 2,6092 bedrooms
- 4283 bedrooms
- 1144 bedrooms
- 155+ bedrooms

- Cars and other vehicles available in Stow in owner-occupied houses/condos
- 230no vehicle
- 2,1651 vehicle
- 4,6832 vehicles
- 2,1873 vehicles
- 4734 vehicles
- 2225+ vehicles

- Cars and other vehicles available in Stow in renter-occupied apartments
- 366no vehicle
- 2,1271 vehicle
- 1,1832 vehicles
- 2253 vehicles
- 1074 vehicles
- 05+ vehicles

- Rooms in owner-occupied houses in Stow, Ohio
- 01 room
- 02 rooms
- 543 rooms
- 5034 rooms
- 1,2465 rooms
- 1,7196 rooms
- 1,4767 rooms
- 1,9178 rooms
- 3,0459+ rooms

- Rooms in renter-occupied apartments in Stow, Ohio
- 1121 room
- 1572 rooms
- 8753 rooms
- 1,3704 rooms
- 7345 rooms
- 3626 rooms
- 2057 rooms
- 1328 rooms
- 619+ rooms


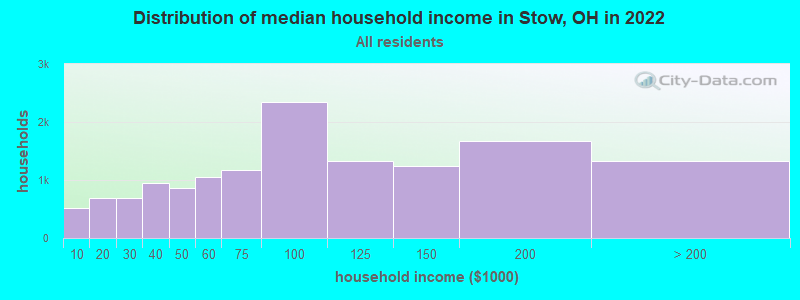
Stow, OH household income distribution

- 516Less than $10,000
- 689$10,000 to $19,999
- 696$20,000 to $29,999
- 954$30,000 to $39,999
- 865$40,000 to $49,999
- 1,051$50,000 to $59,999
- 1,176$60,000 to $74,999
- 2,353$75,000 to $99,999
- 1,334$100,000 to $124,999
- 1,240$125,000 to $149,999
- 1,681$150,000 to $199,999
- 1,328$200,000 or more
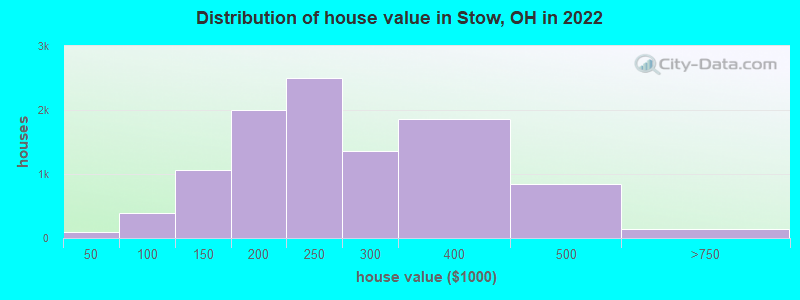
Home value of owner - occupied houses in 2022 in Stow, OH
-
- 24$10,000 to $14,999
- 5$15,000 to $19,999
- 28$20,000 to $24,999
- 13$25,000 to $29,999
- 12$30,000 to $34,999
- 15$40,000 to $49,999
- 78$50,000 to $59,999
- 45$60,000 to $69,999
- 75$70,000 to $79,999
- 87$80,000 to $89,999
- 83$90,000 to $99,999
- 550$100,000 to $124,999
- 516$125,000 to $149,999
- 962$150,000 to $174,999
- 1,036$175,000 to $199,999
- 2,504$200,000 to $249,999
- 1,360$250,000 to $299,999
- 1,853$300,000 to $399,999
- 844$400,000 to $499,999
- 115$500,000 to $749,999
- 27$750,000 to $999,999
Rent paid by renters in 2022 in Stow, OH
-
- 15$150 to $199
- 19$200 to $249
- 68$250 to $299
- 6$300 to $349
- 90$350 to $399
- 11$400 to $449
- 10$450 to $499
- 22$500 to $549
- 8$550 to $599
- 64$600 to $649
- 31$650 to $699
- 188$700 to $749
- 186$750 to $799
- 543$800 to $899
- 460$900 to $999
- 1,327$1,000 to $1,249
- 409$1,250 to $1,499
- 81$1,500 to $1,999
- 37$2,000 to $2,499
- 7$2,500 to $2,999
- 16$3,500 or more
- 267No cash rent

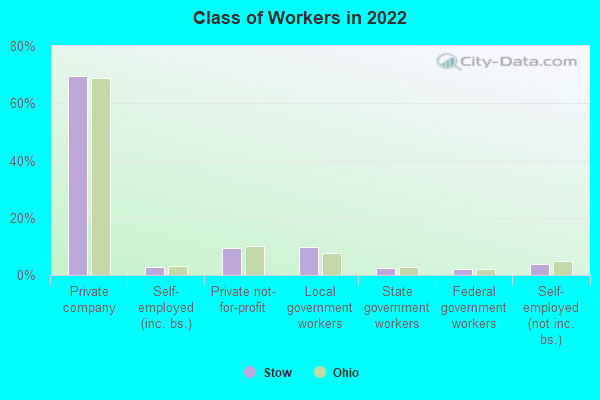
Percentage of workers working in this county: 71.3%
Number of people working at home: 3,389 (19.0% of all workers)

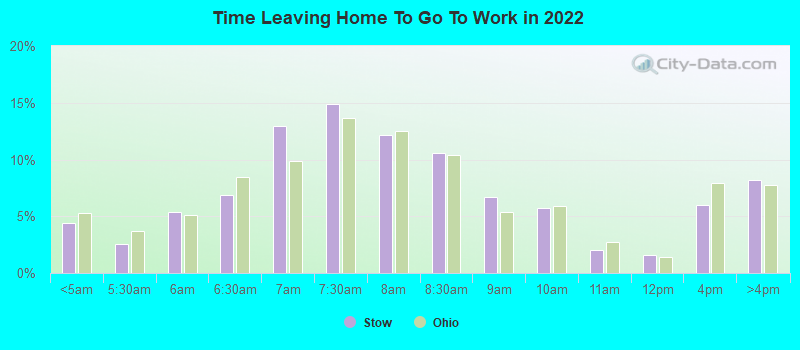
Travel time to work (commute)
- Less than 5 minutes: 368
- 5 to 9 minutes: 1,396
- 10 to 14 minutes: 1,869
- 15 to 19 minutes: 2,342
- 20 to 24 minutes: 2,104
- 25 to 29 minutes: 1,365
- 30 to 34 minutes: 1,738
- 35 to 39 minutes: 650
- 40 to 44 minutes: 876
- 45 to 59 minutes: 1,410
- 60 to 89 minutes: 262
- 90 or more minutes: 304
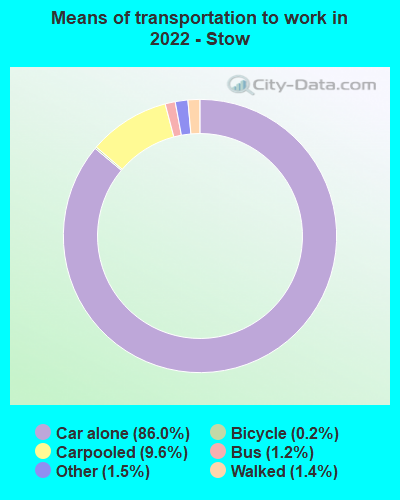
Means of transportation to work:
- Drove a car alone: 9,378 (67.3%)
- Carpooled: 1,169 (8.4%)
- Bus: 97 (0.7%)
- Taxi: 226 (1.6%)
- Bicycle: 30 (0.2%)
- Walked: 132 (0.9%)
- Worked at home: 3,389 (24.3%)
- Unemployment by race in 2022
- Unemployment rate for White non-Hispanic residents
- 1.5%Males
- 3.7%Females
- Unemployment rate for Black residents
- 8.9%Males
- 2.3%Females
- Unemployment rate for two or more race residents
- 38.0%Males
- 0.3%Females
- Unemployment rate for Hispanic or Latino residents
- 11.6%Females

- Year of entry for the foreign-born population in Stow, Ohio
- 7922010 or later
- 5042000 to 2009
- 1331990 to 1999
- 2391980 to 1989
- 1451970 to 1979
- 304Before 1970

First ancestries reported:
- German: 2,416 (17.7%)
- English: 1,552 (11.4%)
- Italian: 1,355 (9.9%)
- American: 1,044 (7.6%)
- Irish: 880 (6.4%)
- European: 824 (6.0%)
- Polish: 415 (3.0%)
- Slovak: 152 (1.1%)
- Lebanese: 151 (1.1%)
- Hungarian: 142 (1.0%)
- Serbian: 126 (0.9%)
- Croatian: 125 (0.9%)
- Scotch-Irish: 116 (0.8%)
- Scottish: 110 (0.8%)
- Arab: 103 (0.8%)
- Slovene: 95 (0.7%)
- British: 84 (0.6%)
- Eastern European: 79 (0.6%)
- Dutch: 77 (0.6%)
- African: 76 (0.6%)
- Iraqi: 71 (0.5%)
- Russian: 67 (0.5%)
- Nigerian: 66 (0.5%)
- Welsh: 44 (0.3%)
- Turkish: 42 (0.3%)
- Czech: 40 (0.3%)
- Austrian: 38 (0.3%)
- Swedish: 35 (0.3%)
- Ukrainian: 35 (0.3%)
- Finnish: 33 (0.2%)
- Swiss: 27 (0.2%)
- Portuguese: 24 (0.2%)
- Canadian: 23 (0.2%)
- Bahamian: 20 (0.1%)
- French: 19 (0.1%)
- Danish: 16 (0.1%)
- Yugoslavian: 16 (0.1%)
- Lithuanian: 15 (0.1%)
- Belgian: 13 (0.10%)
- Pennsylvania German: 13 (0.10%)
- Czechoslovakian: 12 (0.09%)
- French Canadian: 11 (0.08%)
- Romanian: 9 (0.07%)
- Greek: 7 (0.05%)
- Armenian: 6 (0.04%)
- Iranian: 4 (0.03%)
Most common places of birth for foreign-born residents (%):
| Stow: | 21.3% (358) |
| Ohio: | 0.6% (3,669) |
| Stow: | 18.7% (314) |
| Ohio: | 0.7% (3,864) |
| Stow: | 6.6% (110) |
| Ohio: | 0.4% (2,094) |
| Stow: | 6.6% (110) |
| Ohio: | 1.9% (10,960) |
| Stow: | 4.6% (78) |
| Ohio: | 11.6% (66,525) |
| Stow: | 4.2% (71) |
| Ohio: | 1.9% (10,777) |
| Stow: | 3.5% (58) |
| Ohio: | 0.6% (3,414) |
| Stow: | 3.4% (57) |
| Ohio: | 1.2% (7,029) |
| Stow: | 3.3% (56) |
| Ohio: | 2.2% (12,846) |
| Stow: | 3.3% (55) |
| Ohio: | 2.4% (13,773) |
| Stow: | 3.2% (53) |
| Ohio: | 1.0% (5,979) |
| Stow: | 3.1% (52) |
| Ohio: | 0.6% (3,269) |
| Stow: | 2.4% (40) |
| Ohio: | 0.7% (3,862) |
| Stow: | 1.8% (30) |
| Ohio: | 0.3% (1,875) |
| Stow: | 1.8% (30) |
| Ohio: | 7.8% (44,796) |
| Stow: | 1.7% (28) |
| Ohio: | 0.2% (1,360) |
| Stow: | 1.6% (27) |
| Ohio: | 2.0% (11,398) |
Place of birth for U.S.-born residents:
- This state: 25,586
- Other state: 6,909
- Northeast: 2,606
- Midwest: 1,314
- South: 2,047
- West: 926
87.8% of Stow residents lived in the same house 1 years ago.
Out of people who lived in different houses, 37.3% lived in this county.
Out of people who lived in different counties, 55.7% lived in Ohio.
| Stow: | 87.8% |
| State average: | 87.8% |
Education attainment for males 25 years and older:
- No schooling: 116
- Nursery to 4th grade: 0
- 5th and 6th grade: 5
- 7th and 8th grade: 42
- 9th grade: 43
- 10th grade: 52
- 11th grade: 49
- 12th grade, no diploma: 151
- High school graduate (or equivalency): 2,497
- Less than 1 year of college: 576
- Some college more than 1 year, no degree: 1,100
- Associate degree: 1,007
- Bachelor's degree: 3,848
- Master's degree: 1,396
- Professional school degree: 284
- Doctorate degree: 194

Education attainment for females 25 years and older:
- No schooling: 94
- Nursery to 4th grade: 0
- 5th and 6th grade: 11
- 7th and 8th grade: 16
- 9th grade: 29
- 10th grade: 0
- 11th grade: 68
- 12th grade, no diploma: 61
- High school graduate (or equivalency): 2,837
- Less than 1 year of college: 601
- Some college more than 1 year, no degree: 1,302
- Associate degree: 896
- Bachelor's degree: 4,450
- Master's degree: 1,821
- Professional school degree: 133
- Doctorate degree: 139


Housing units in structures:
- One, detached: 9,492
- One, attached: 2,022
- Two: 396
- 3 or 4: 447
- 5 to 9: 746
- 10 to 19: 924
- 20 to 49: 369
- 50 or more: 511
- Mobile homes: 67
Housing units lacking complete kitchen facilities in 2022: 2.6%
House/condo owner moved in on average 12 years ago
Renter moved in on average 2 years ago

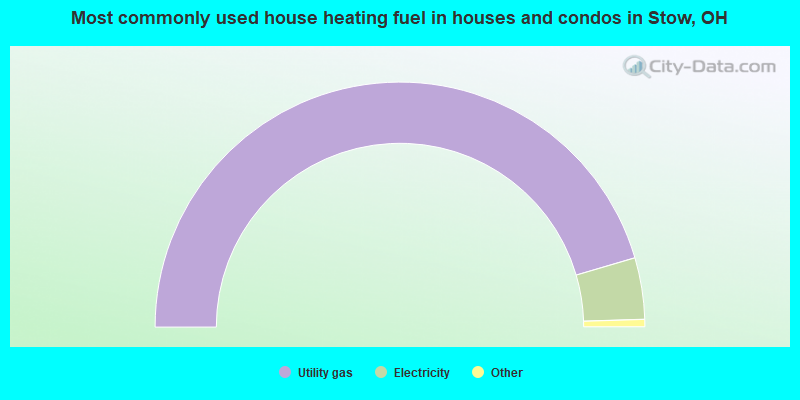
- 90.9%Utility gas
- 8.1%Electricity
- 0.5%Fuel oil, kerosene, etc.
- 0.3%Bottled, tank, or LP gas
- 0.2%Wood
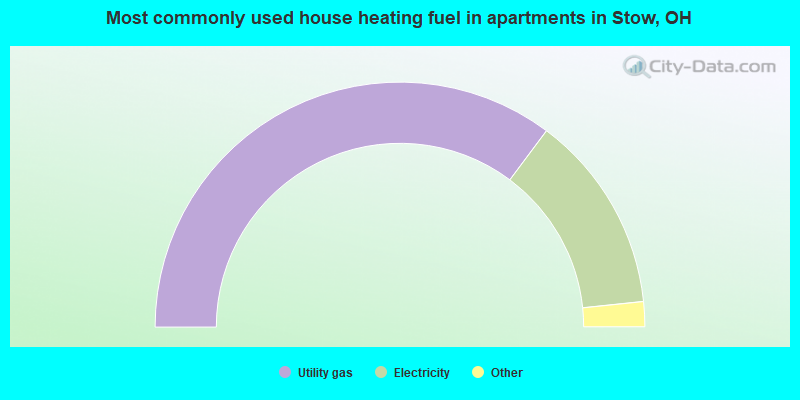
- 70.5%Utility gas
- 26.3%Electricity
- 1.8%Bottled, tank, or LP gas
- 0.8%No fuel used
- 0.6%Other fuel
Private vs. public school enrollment:
| Here: | 10.8% |
| Ohio: | 16.0% |
| Here: | 15.1% |
| Ohio: | 13.1% |
| Here: | 6.7% |
| Ohio: | 22.3% |


