Swampscott, MA (Massachusetts) Houses and Residents
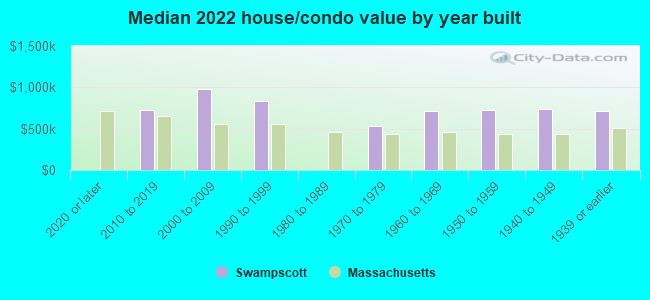
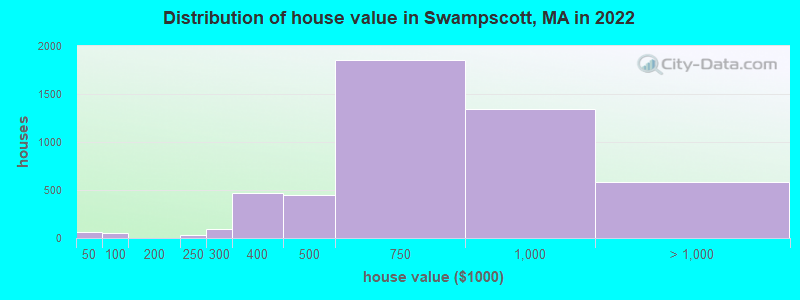
Estimated median house or condo value in 2022: $700,584 (it was $266,000 in 2000 )
Swampscott:
$700,584Massachusetts:
$534,700
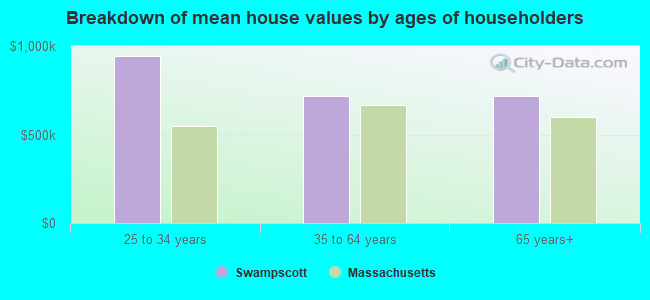
Lower value quartile - upper value quartile: $488,099 - $897,358Mean price in 2022: Detached houses: $881,421 Here:
$881,421State:
$651,570
Townhouses or other attached units: $586,082 Here:
$586,082State:
$617,749
In 2-unit structures: $539,157 Here:
$539,157State:
$594,808
In 3-to-4-unit structures: $399,230 Here:
$399,230State:
$601,912
In 5-or-more-unit structures: $336,487 Here:
$336,487State:
$555,768
Total population: 13,787 (All urban)
Houses: 6,479 (6,339 occupied: 4,649 owner occupied, 1,708 renter occupied )
% of renters here:
27%State:
38%
Housing density: 2,125 houses/condos per square mile
Median price asked for vacant for-sale houses and condos in 2022 in this county: $495,592.
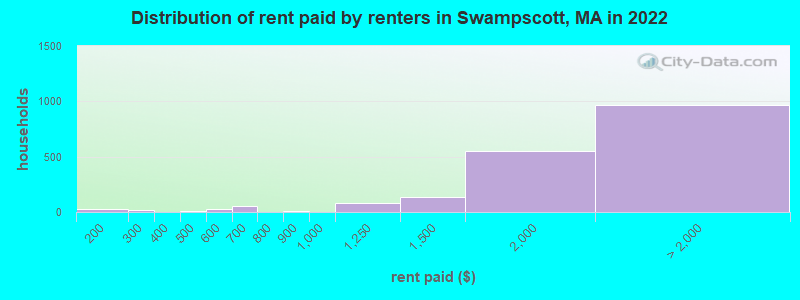
Median contract rent in 2022: over $2,000 (lower quartile is $1,646, upper quartile is over $2,000)
Median rent asked for vacant for-rent units in 2022: $4,318
Median gross rent in Swampscott, MA in 2022: over $2,000
Housing units in Swampscott with a mortgage: 3,586 (568 second mortgage, 0 home equity loan, 537 both second mortgage and home equity loan )Houses without a mortgage: 151
Median household income for houses/condos with a mortgage: $156,282
Median household income for apartments without a mortgage: $86,522
Median monthly housing costs: $2,577
Data:
Median house or condo value ($)
Median house or condo value ($ change since 2000)
Median house or condo value ($) - White
Median house or condo value ($) - Black or African American
Median house or condo value ($) - Asian
Median house or condo value ($) - Hispanic or Latino
Median house or condo value ($) - American Indian and Alaska Native
Median house or condo value ($) - Multirace
Median house or condo value ($) - Other Race
Median price asked for mobile homes ($)
Household density (households per square mile)
Mean house or condo value by units in structure - 1, detached ($)
Mean house or condo value by units in structure - 1, attached ($)
Mean house or condo value by units in structure - 2 ($)
Mean house or condo value by units in structure by units in structure - 3 or 4 ($)
Mean house or condo value by units in structure - 5 or more ($)
Mean house or condo value by units in structure - Boat, RV, van, etc. ($)
Mean house or condo value by units in structure - Mobile home ($)
Median contract rent ($)
Median contract rent - Lower quartile ($)
Median contract rent - Upper quartile ($)
Median gross rent ($)
Urban houses (%)
Rural houses (%)
Houses occupied (%)
Houses occupied (% change since 2000)
Houses owner occupied (%)
Houses owner occupied (% change since 2000)
Houses renter occupied (%)
Houses renter occupied (% change since 2000)
Vacant housing units - For rent (%)
Vacant housing units - For rent (% change since 2000)
Vacant housing units - For sale only (%)
Vacant housing units - For sale only (% change since 2000)
Vacant housing units - Rented or sold, not occupied (%)
Vacant housing units - Rented or sold, not occupied (% change since 2000)
Vacant housing units - For seasonal, recreational, or occasional use (%)
Vacant housing units - For seasonal, recreational, or occasional use (% change since 2000)
Vacant housing units - For migrant workers (%)
Vacant housing units - For migrant workers (% change since 2000)
Vacant housing units - Other vacant (%)
Vacant housing units - Other vacant (% change since 2000)
Median monthly housing costs ($)
Median household income for houses/condos with a mortgage ($)
Median household income for houses/condos without a mortgage ($)
Median household income ($)
Median household income ($) - White
Median household income ($) - Black or African American
Median household income ($) - Asian
Median household income ($) - Hispanic or Latino
Median household income ($) - American Indian and Alaska Native
Median household income ($) - Multirace
Median household income ($) - Other Race
Mortgage status - with mortgage (%)
Mortgage status - with second mortgage (%)
Mortgage status - with home equity loan (%)
Mortgage status - with both second mortgage and home equity loan (%)
Mortgage status - without a mortgage (%)
Median year house/condo built
Median year apartment built
Household type by relationship - Male householder living alone (%)
Household type by relationship - Male householder not living alone (%)
Household type by relationship - Female householder living alone (%)
Household type by relationship - Female householder not living alone (%)
Household type by relationship - Opposite-Sex spouse (%)
Household type by relationship - Same-Sex spouse (%)
Household type by relationship - Opposite-Sex unmarried partner (%)
Household type by relationship - Same-Sex unmarried partner (%)
Household type by relationship - In group quarters (%)
Size of family households - 2-person household (%)
Size of family households - 3-person household (%)
Size of family households - 4-person household (%)
Size of family households - 5-person household (%)
Size of family households - 6-person household (%)
Size of family households - 7-or-more-person household (%)
Size of nonfamily households - 1-person household (%)
Size of nonfamily households - 2-person household (%)
Size of nonfamily households - 3-person household (%)
Size of nonfamily households - 4-person household (%)
Size of nonfamily households - 5-person household (%)
Size of nonfamily households - 6-person household (%)
Size of nonfamily households - 7-or-moreperson household (%)
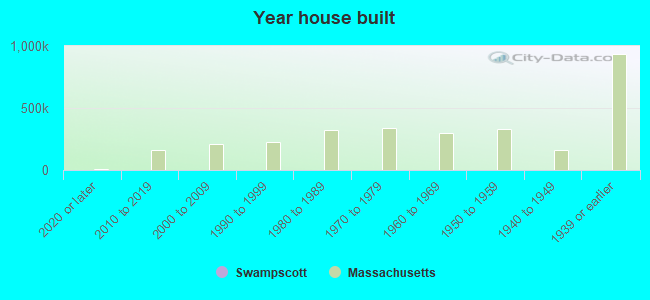
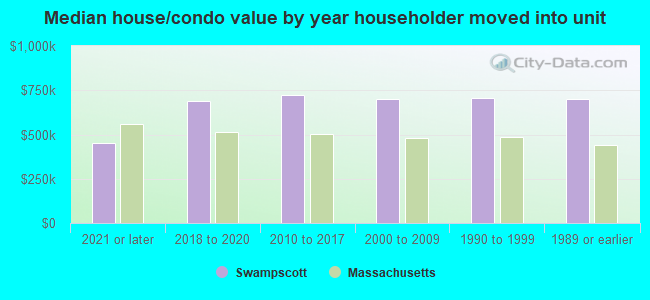
Year house built - Built 2010 or later (%)
Year house built - Built 2000 to 2009 (%)
Year house built - Built 1990 to 1999 (%)
Year house built - Built 1980 to 1989 (%)
Year house built - Built 1970 to 1979 (%)
Year house built - Built 1960 to 1969 (%)
Year house built - Built 1950 to 1959 (%)
Year house built - Built 1940 to 1949 (%)
Year house built - Built 1939 or earlier (%)
Median number of rooms in houses and condos
Median number of rooms in apartments
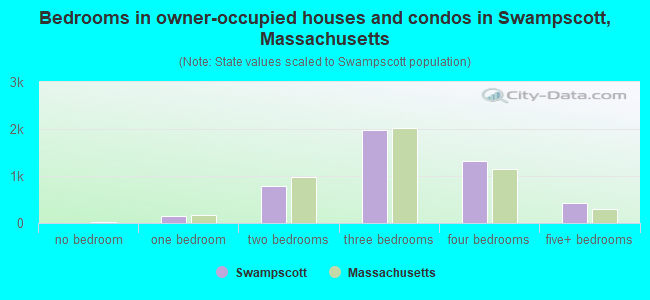
Median number of bedrooms in owner occupied houses
Mean number of bedrooms in owner occupied houses
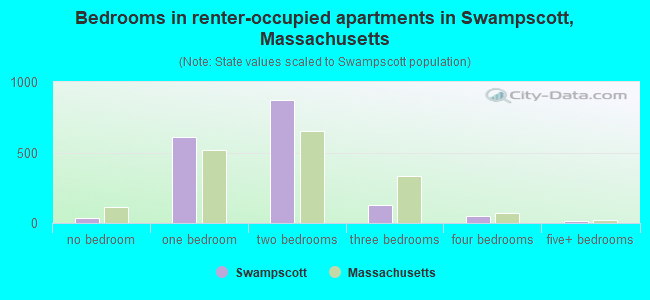
Median number of bedrooms in renter occupied houses
Mean number of bedrooms in renter occupied houses
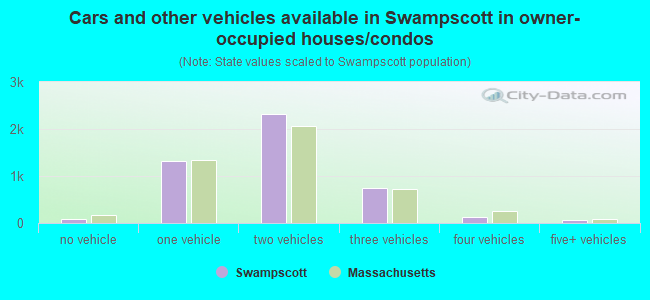
Median number of vehichles in owner occupied houses
Mean number of vehichles in owner occupied houses
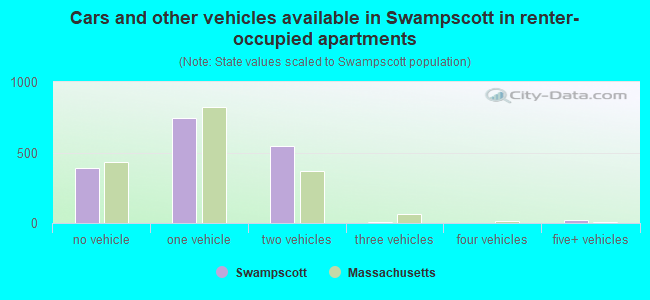
Median number of vehichles in renter occupied houses
Mean number of vehichles in renter occupied houses
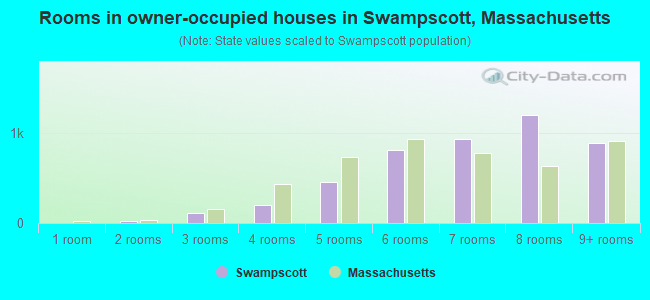
Rooms in owner-occupied houses - 1 room (%)
Rooms in owner-occupied houses - 2 rooms (%)
Rooms in owner-occupied houses - 3 rooms (%)
Rooms in owner-occupied houses - 4 rooms (%)
Rooms in owner-occupied houses - 5 rooms (%)
Rooms in owner-occupied houses - 6 rooms (%)
Rooms in owner-occupied houses - 7 rooms (%)
Rooms in owner-occupied houses - 8 rooms (%)
Rooms in owner-occupied houses - 9+ rooms (%)
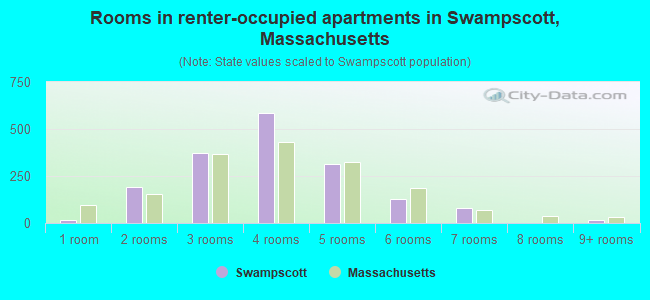
Rooms in renter-occupied houses - 1 room (%)
Rooms in renter-occupied houses - 2 rooms (%)
Rooms in renter-occupied houses - 3 rooms (%)
Rooms in renter-occupied houses - 4 rooms (%)
Rooms in renter-occupied houses - 5 rooms (%)
Rooms in renter-occupied houses - 6 rooms (%)
Rooms in renter-occupied houses - 7 rooms (%)
Rooms in renter-occupied houses - 8 rooms (%)
Rooms in renter-occupied houses - 9+ rooms (%)
Bedrooms in owner-occupied houses - no bedrooms (%)
Bedrooms in owner-occupied houses - 1 bedroom (%)
Bedrooms in owner-occupied houses - 2 bedrooms (%)
Bedrooms in owner-occupied houses - 3 bedrooms (%)
Bedrooms in owner-occupied houses - 4 bedrooms (%)
Bedrooms in owner-occupied houses - 5+ bedrooms (%)
Bedrooms in renter-occupied houses - no bedrooms (%)
Bedrooms in renter-occupied houses - 1 bedroom (%)
Bedrooms in renter-occupied houses - 2 bedrooms (%)
Bedrooms in renter-occupied houses - 3 bedrooms (%)
Bedrooms in renter-occupied houses - 4 bedrooms (%)
Bedrooms in renter-occupied houses - 5+ bedrooms (%)
Vehicles available in owner-occupied houses - no vehicle available (%)
Vehicles available in owner-occupied houses - 1 vehicle available(%)
Vehicles available in owner-occupied houses - 2 Vehicles available (%)
Vehicles available in owner-occupied houses - 3 Vehicles available (%)
Vehicles available in owner-occupied houses - 4 Vehicles available (%)
Vehicles available in owner-occupied houses - 5+ Vehicles available (%)
Vehicles available in renter-occupied houses - no vehicle available (%)
Vehicles available in renter-occupied houses - 1 vehicle available (%)
Vehicles available in renter-occupied houses - 2 Vehicles available (%)
Vehicles available in renter-occupied houses - 3 Vehicles available (%)
Vehicles available in renter-occupied houses - 4 Vehicles available (%)
Vehicles available in renter-occupied houses - 5+ Vehicles available (%)
Housing units in structures - 1, detached (%)
Housing units in structures - 1, attached (%)
Housing units in structures - 2 (%)
Housing units in structures - 3 or 4 (%)
Housing units in structures - 5 to 9 (%)
Housing units in structures - 10 to 19 (%)
Housing units in structures - 20 to 49 (%)
Housing units in structures - 50 or more (%)
Housing units in structures - Mobile home (%)
Housing units in structures - Boat, RV, van, etc. (%)
Housing units in structures - Owners - 1, detached (%)
Housing units in structures - Owners - 1, attached (%)
Housing units in structures - Owners - 2 (%)
Housing units in structures - Owners - 3 or 4 (%)
Housing units in structures - Owners - 5 to 9 (%)
Housing units in structures - Owners - 10 to 19 (%)
Housing units in structures - Owners - 20 to 49 (%)
Housing units in structures - Owners - 50 or more (%)
Housing units in structures - Owners - Mobile home (%)
Housing units in structures - Owners - Boat, RV, van, etc. (%)
Housing units in structures - Renters - 1, detached (%)
Housing units in structures - Renters - 1, attached (%)
Housing units in structures - Renters - 2 (%)
Housing units in structures - Renters - 3 or 4 (%)
Housing units in structures - Renters - 5 to 9 (%)
Housing units in structures - Renters - 10 to 19 (%)
Housing units in structures - Renters - 20 to 49 (%)
Housing units in structures - Renters - 50 or more (%)
Housing units in structures - Renters - Mobile home (%)
Housing units in structures - Renters - Boat, RV, van, etc. (%)
House/condo owner moved in on average (years ago)
Renter moved in on average (years ago)
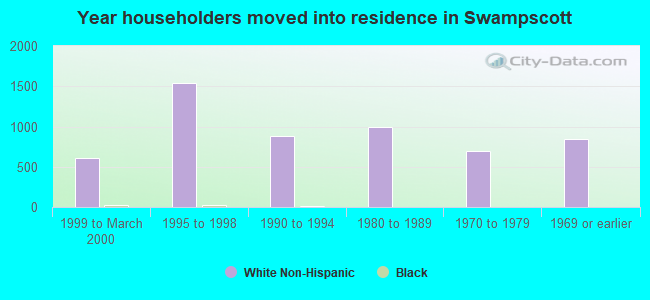
Year householder moved into unit - Moved in 1999 to March 2000 (%)
Year householder moved into unit - Moved in 1999 to March 2000 (%) - White
Year householder moved into unit - Moved in 1999 to March 2000 (%) - Black or African American
Year householder moved into unit - Moved in 1999 to March 2000 (%) - Asian
Year householder moved into unit - Moved in 1999 to March 2000 (%) - Hispanic or Latino
Year householder moved into unit - Moved in 1999 to March 2000 (%) - American Indian and Alaska Native
Year householder moved into unit - Moved in 1999 to March 2000 (%) - Multirace
Year householder moved into unit - Moved in 1999 to March 2000 (%) - Other Race
Year householder moved into unit - Moved in 1995 to 1998 (%)
Year householder moved into unit - Moved in 1995 to 1998 (%) - White
Year householder moved into unit - Moved in 1995 to 1998 (%) - Black or African American
Year householder moved into unit - Moved in 1995 to 1998 (%) - Asian
Year householder moved into unit - Moved in 1995 to 1998 (%) - Hispanic or Latino
Year householder moved into unit - Moved in 1995 to 1998 (%) - American Indian and Alaska Native
Year householder moved into unit - Moved in 1995 to 1998 (%) - Multirace
Year householder moved into unit - Moved in 1995 to 1998 (%) - Other Race
Year householder moved into unit - Moved in 1990 to 1994 (%)
Year householder moved into unit - Moved in 1990 to 1994 (%) - White
Year householder moved into unit - Moved in 1990 to 1994 (%) - Black or African American
Year householder moved into unit - Moved in 1990 to 1994 (%) - Asian
Year householder moved into unit - Moved in 1990 to 1994 (%) - Hispanic or Latino
Year householder moved into unit - Moved in 1990 to 1994 (%) - American Indian and Alaska Native
Year householder moved into unit - Moved in 1990 to 1994 (%) - Multirace
Year householder moved into unit - Moved in 1990 to 1994 (%) - Other Race
Year householder moved into unit - Moved in 1980 to 1989 (%)
Year householder moved into unit - Moved in 1980 to 1989 (%) - White
Year householder moved into unit - Moved in 1980 to 1989 (%) - Black or African American
Year householder moved into unit - Moved in 1980 to 1989 (%) - Asian
Year householder moved into unit - Moved in 1980 to 1989 (%) - Hispanic or Latino
Year householder moved into unit - Moved in 1980 to 1989 (%) - American Indian and Alaska Native
Year householder moved into unit - Moved in 1980 to 1989 (%) - Multirace
Year householder moved into unit - Moved in 1980 to 1989 (%) - Other Race
Year householder moved into unit - Moved in 1970 to 1979 (%)
Year householder moved into unit - Moved in 1970 to 1979 (%) - White
Year householder moved into unit - Moved in 1970 to 1979 (%) - Black or African American
Year householder moved into unit - Moved in 1970 to 1979 (%) - Asian
Year householder moved into unit - Moved in 1970 to 1979 (%) - Hispanic or Latino
Year householder moved into unit - Moved in 1970 to 1979 (%) - American Indian and Alaska Native
Year householder moved into unit - Moved in 1970 to 1979 (%) - Multirace
Year householder moved into unit - Moved in 1970 to 1979 (%) - Other Race
Year householder moved into unit - Moved in 1969 or earlier (%)
Year householder moved into unit - Moved in 1969 or earlier (%) - White
Year householder moved into unit - Moved in 1969 or earlier (%) - Black or African American
Year householder moved into unit - Moved in 1969 or earlier (%) - Asian
Year householder moved into unit - Moved in 1969 or earlier (%) - Hispanic or Latino
Year householder moved into unit - Moved in 1969 or earlier (%) - American Indian and Alaska Native
Year householder moved into unit - Moved in 1969 or earlier (%) - Multirace
Year householder moved into unit - Moved in 1969 or earlier (%) - Other Race
Housing units lacking complete plumbing facilities (%)
Housing units lacking complete kitchen facilities (%)
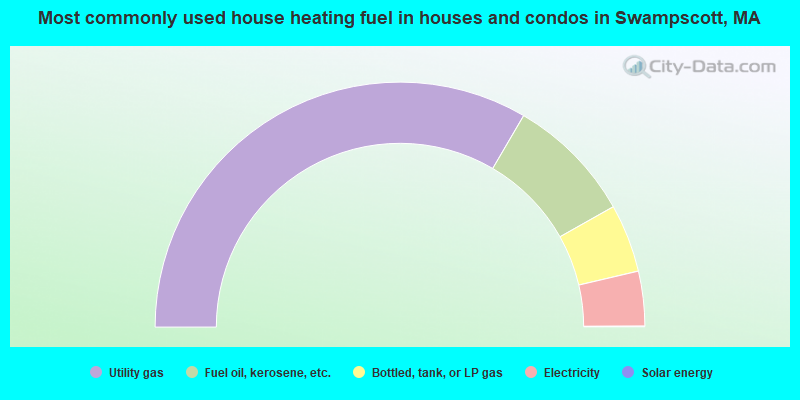
House heating fuel used in houses and condos - Utility gas (%)
House heating fuel used in houses and condos - Bottled, tank, or LP gas (%)
House heating fuel used in houses and condos - Electricity (%)
House heating fuel used in houses and condos - Fuel oil, kerosene, etc. (%)
House heating fuel used in houses and condos - Coal or coke (%)
House heating fuel used in houses and condos - Wood (%)
House heating fuel used in houses and condos - Solar energy (%)
House heating fuel used in houses and condos - Other fuel (%)
House heating fuel used in houses and condos - No fuel used (%)
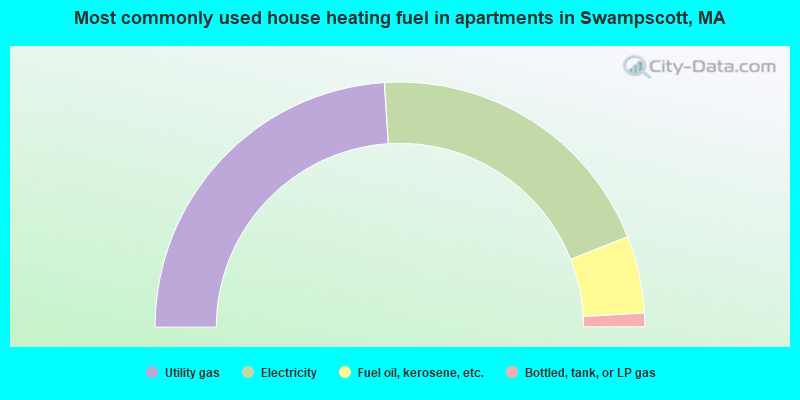
House heating fuel used in apartments - Utility gas (%)
House heating fuel used in apartments - Bottled, tank, or LP gas (%)
House heating fuel used in apartments - Electricity (%)
House heating fuel used in apartments - Fuel oil, kerosene, etc. (%)
House heating fuel used in apartments - Coal or coke (%)
House heating fuel used in apartments - Wood (%)
House heating fuel used in apartments - Solar energy (%)
House heating fuel used in apartments - Other fuel (%)
House heating fuel used in apartments - No fuel used (%)
Latest news about housing in Swampscott, MA collected exclusively by city-data.com from local newspapers, TV, and radio stations
Median year house/condo built: 1950Median year apartment built: 1972Household type by relationship:
Households: 15,137
Male householders: 2,852 (537 living alone ), Female householders: 3,430 (1,155 living alone )3,543 spouses (3,486 opposite-sex spouses ), 358 unmarried partners , (321 opposite-sex unmarried partners ), 4,102 children (3,928 natural , 110 adopted , 64 stepchildren ), 127 grandchildren , 133 brothers or sisters , 172 parents , 5 foster children , 113 other relatives , 168 non-relatives In group quarters: 131
Size of family households: 1,852 2-persons , 1,080 3-persons , 887 4-persons , 307 5-persons , 43 6-persons , 18 7-or-more-persons .
Size of nonfamily households: 1,824 1-person , 322 2-persons , 7 4-persons .
2,475 married couples with children. single-parent households (48 men , 239 women ).
75.0% of residents of Swampscott speak English at home. of residents speak Spanish at home (64% speak English very well , 33% speak English well , 3% speak English not well ).of residents speak other Indo-European language at home (56% speak English very well , 41% speak English well , 2% speak English not well , 1% don't speak English at all ).of residents speak Asian or Pacific Island language at home (72% speak English very well , 28% speak English well ).of residents speak other language at home (41% speak English very well , 27% speak English well , 32% speak English not well ).
Foreign born population: 3,196 (21.1%)of them are naturalized citizens )
Median number of rooms in houses and condos:
Median number of rooms in apartments
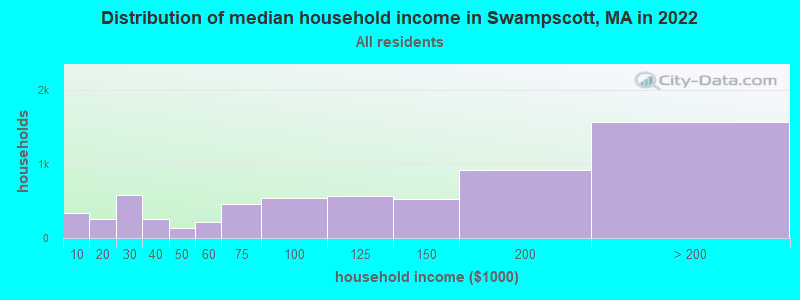
Swampscott, MA household income distribution 335 Less than $10,000258 $10,000 to $19,999582 $20,000 to $29,999252 $30,000 to $39,999134 $40,000 to $49,999219 $50,000 to $59,999460 $60,000 to $74,999541 $75,000 to $99,999575 $100,000 to $124,999525 $125,000 to $149,999920 $150,000 to $199,9991,570 $200,000 or more
Home value of owner - occupied houses in 2022 in Swampscott, MA 21 Less than $10,00015 $15,000 to $19,99927 $25,000 to $29,99920 $60,000 to $69,99927 $80,000 to $89,99931 $200,000 to $249,99997 $250,000 to $299,999469 $300,000 to $399,999453 $400,000 to $499,9991,851 $500,000 to $749,9991,340 $750,000 to $999,999284 $1,000,000 to $1,499,999144 $1,500,000 to $1,999,999157 $2,000,000 or moreRent paid by renters in 2022 in Swampscott, MA 30 $150 to $19919 $250 to $2996 $450 to $49917 $500 to $5496 $550 to $59952 $600 to $64913 $800 to $89982 $1,000 to $1,249140 $1,250 to $1,499551 $1,500 to $1,999447 $2,000 to $2,499416 $2,500 to $2,99911 $3,000 to $3,49926 $3,500 or more65 No cash rent
Percentage of workers working in this county: 63.0%Number of people working at home: 2,172 (26.3% of all workers )
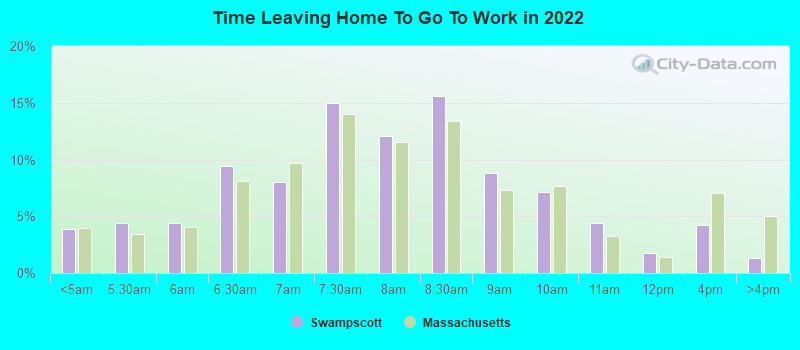
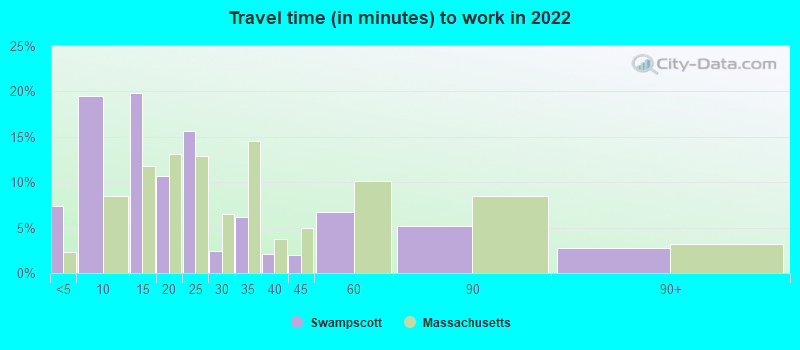
Travel time to work (commute)
Less than 5 minutes: 2075 to 9 minutes: 32410 to 14 minutes: 56515 to 19 minutes: 67220 to 24 minutes: 66525 to 29 minutes: 39230 to 34 minutes: 57235 to 39 minutes: 27540 to 44 minutes: 37045 to 59 minutes: 62760 to 89 minutes: 1,29190 or more minutes: 193
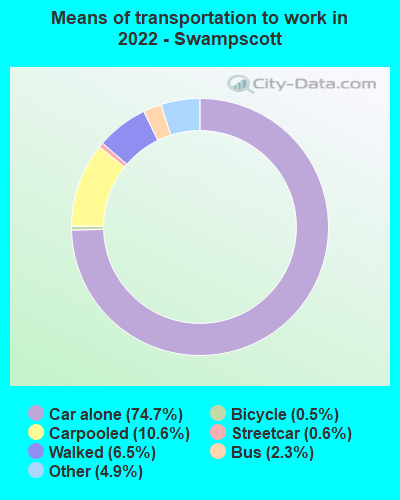
Means of transportation to work:
Drove a car alone: 2,326 (47.2%)Carpooled: 250 (5.1%)Bus : 58 (1.2%)Subway or elevated rail : 15 (0.3%)Taxi: 229 (4.6%)Bicycle: 23 (0.5%)Walked: 179 (3.6%)Worked at home: 2,172 (44.0%)
Unemployment by race in 2022
Unemployment rate for White non-Hispanic residents 6.0% Males1.1% FemalesUnemployment rate for other race residents 100.0% FemalesUnemployment rate for Hispanic or Latino residents 7.5% Females
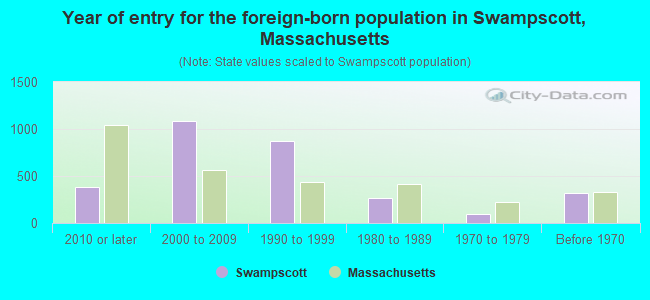
Year of entry for the foreign-born population in Swampscott, Massachusetts
380 2010 or later 1,090 2000 to 2009 874 1990 to 1999 268 1980 to 1989 97 1970 to 1979 314 Before 1970
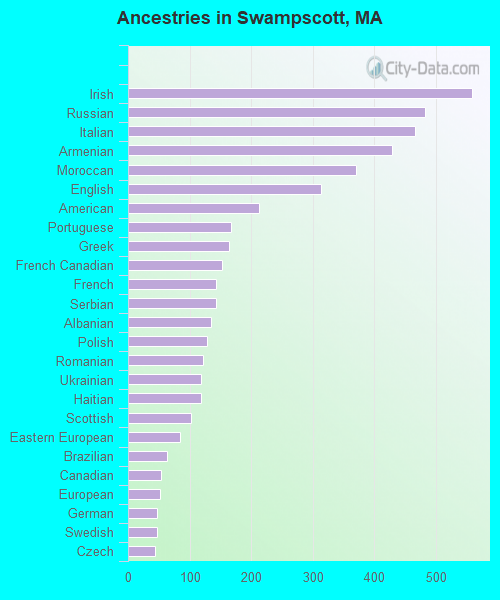
First ancestries reported:
Irish: 558 (8.8%)
Russian: 482 (7.6%)
Italian: 465 (7.4%)
Armenian: 428 (6.8%)
Moroccan: 370 (5.9%)
English: 314 (5.0%)
American: 213 (3.4%)
Portuguese: 167 (2.6%)
Greek: 164 (2.6%)
French Canadian: 153 (2.4%)
French: 143 (2.3%)
Serbian: 143 (2.3%)
Albanian: 135 (2.1%)
Polish: 128 (2.0%)
Romanian: 122 (1.9%)
Ukrainian: 119 (1.9%)
Haitian: 119 (1.9%)
Scottish: 102 (1.6%)
Eastern European: 85 (1.3%)
Brazilian: 63 (1.0%)
Canadian: 53 (0.8%)
European: 52 (0.8%)
German: 47 (0.7%)
Swedish: 47 (0.7%)
Czech: 44 (0.7%)
Lithuanian: 31 (0.5%)
African: 29 (0.5%)
Iranian: 25 (0.4%)
Palestinian: 15 (0.2%)
Dutch: 12 (0.2%)
Yugoslavian: 11 (0.2%)
Lebanese: 11 (0.2%)
Turkish: 6 (0.10%)
Hungarian: 4 (0.06%)
British: 2 (0.03%)
Cape Verdean: 1 (0.02%) Most common places of birth for foreign-born residents (%): Russia Swampscott:
16.2% (501)Massachusetts:
1.5% (18,278)
Armenia Swampscott:
15.3% (474)Massachusetts:
0.2% (2,307)
Brazil Swampscott:
7.5% (232)Massachusetts:
7.6% (92,959)
Albania Swampscott:
4.7% (146)Massachusetts:
1.1% (13,076)
Morocco Swampscott:
4.4% (135)Massachusetts:
0.7% (8,562)
Ukraine Swampscott:
4.1% (127)Massachusetts:
0.9% (10,808)
Greece Swampscott:
3.7% (114)Massachusetts:
0.8% (10,043)
Other Eastern Europe Swampscott:
3.7% (113)Massachusetts:
0.3% (4,128)
Serbia Swampscott:
3.2% (98)Massachusetts:
0.1% (1,277)
Bangladesh Swampscott:
3.1% (97)Massachusetts:
0.4% (4,660)
El Salvador Swampscott:
2.8% (85)Massachusetts:
3.7% (45,667)
Canada Swampscott:
2.7% (82)Massachusetts:
2.3% (28,158)
Guatemala Swampscott:
2.5% (76)Massachusetts:
2.7% (32,733)
Moldova Swampscott:
2.2% (68)Massachusetts:
0.2% (2,537)
Haiti Swampscott:
2.1% (64)Massachusetts:
4.9% (60,432)
Latvia Swampscott:
2.0% (62)Massachusetts:
0.1% (1,002)
Israel Swampscott:
1.9% (58)Massachusetts:
0.5% (6,073)
Japan Swampscott:
1.6% (48)Massachusetts:
0.6% (7,301)
Place of birth for U.S.-born residents:
This state: 8,139Other state: 3,649Northeast: 2,190Midwest: 559South: 484West: 418 89.9% of Swampscott residents lived in the same house 1 years ago.
Out of people who lived in different houses, 36.9% lived in this county.
Out of people who lived in different counties, 83.2% lived in Massachusetts.
Swampscott:
89.9%State average:
87.7%
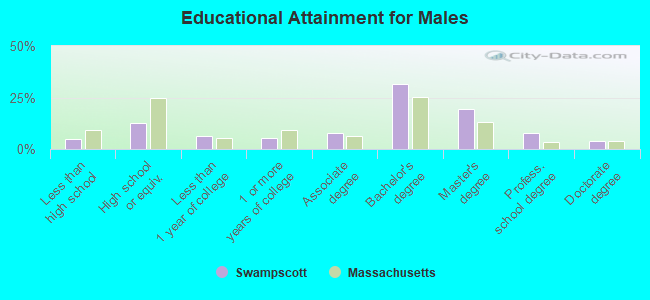
Education attainment for males 25 years and older:
No schooling: 36Nursery to 4th grade: 05th and 6th grade: 167th and 8th grade: 09th grade: 11910th grade: 2611th grade: 012th grade, no diploma: 43High school graduate (or equivalency): 660Less than 1 year of college: 317Some college more than 1 year, no degree: 287Associate degree: 406Bachelor's degree: 1,631Master's degree: 1,004Professional school degree: 406Doctorate degree: 207
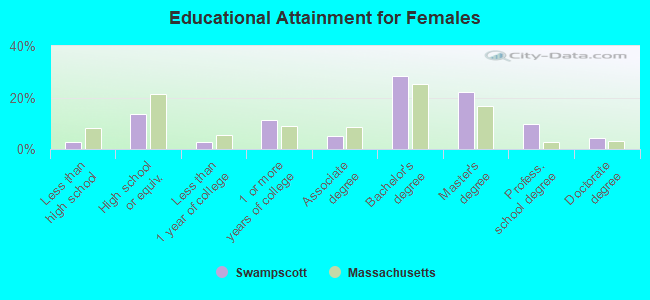
Education attainment for females 25 years and older:
No schooling: 40Nursery to 4th grade: 445th and 6th grade: 07th and 8th grade: 129th grade: 1910th grade: 611th grade: 012th grade, no diploma: 41High school graduate (or equivalency): 811Less than 1 year of college: 164Some college more than 1 year, no degree: 668Associate degree: 308Bachelor's degree: 1,697Master's degree: 1,323Professional school degree: 583Doctorate degree: 247
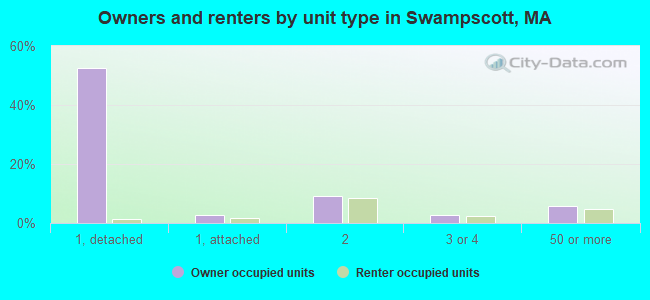
Housing units in structures:
One, detached: 3,553One, attached: 310Two: 1,0753 or 4: 3095 to 9: 19810 to 19: 8520 to 49: 36250 or more: 583Housing units lacking complete kitchen facilities in 2022: 0.4%House/condo owner moved in on average 12 years ago
Renter moved in on average 1 years ago
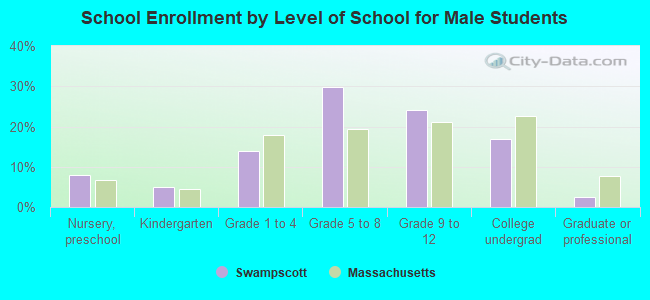
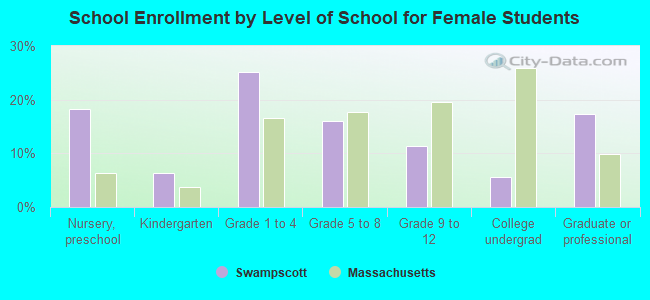
Private vs. public school enrollment:
Students in private schools in grades 1 to 8 (elementary and middle school): 221 Here:
15.9%Massachusetts:
10.3%
Students in private schools in grades 9 to 12 (high school): 77 Here:
13.3%Massachusetts:
12.3%
Students in private undergraduate colleges: 195 Here:
52.6%Massachusetts:
51.2%