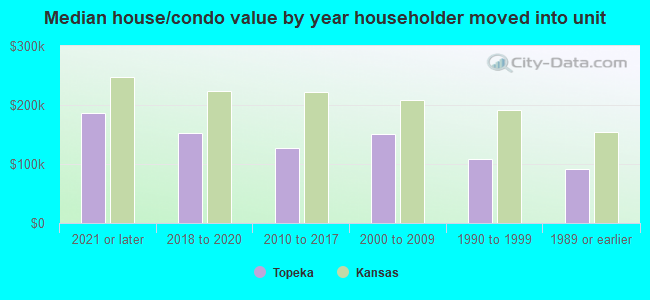
Topeka, KS (Kansas) Houses and Residents
| Topeka: | $138,900 |
| Kansas: | $206,600 |
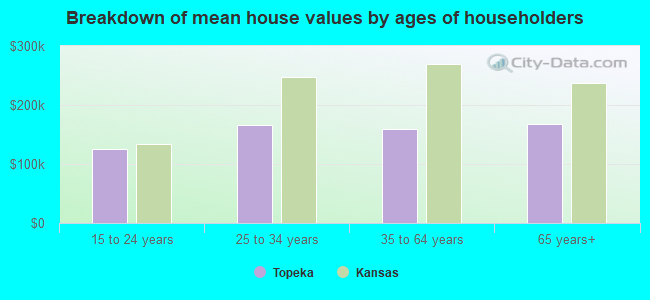
Mean price in 2022:
Detached houses: $165,213
Here: $165,213 State: $264,181 Townhouses or other attached units: $160,277
Here: $160,277 State: $219,178 In 3-to-4-unit structures: $125,871
Here: $125,871 State: $161,859 In 5-or-more-unit structures: $62,314
Here: $62,314 State: $267,030 Mobile homes: $25,728
Here: $25,728 State: $74,712
Total population: 127,215 (Urban population: 121,252, Rural population: 793 (all nonfarm))
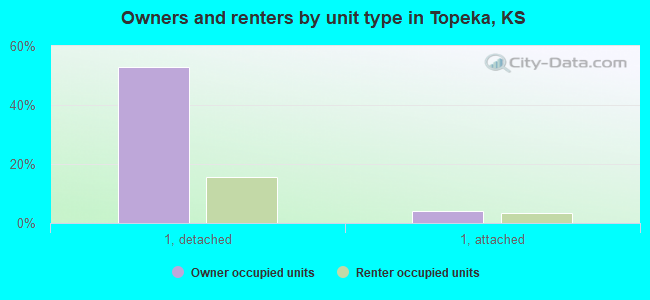
Houses: 60,554 (55,870 occupied: 32,473 owner occupied, 23,397 renter occupied)
| % of renters here: | 42% |
| State: | 32% |
Housing density: 1,081 houses/condos per square mile
Median price asked for vacant for-sale houses and condos in 2022: $281,680.
Median contract rent in 2022: $670 (lower quartile is $511, upper quartile is $939)
Median rent asked for vacant for-rent units in 2022: $474
Median gross rent in Topeka, KS in 2022: $893
Housing units in Topeka with a mortgage: 17,837 (868 second mortgage, 0 home equity loan, 705 both second mortgage and home equity loan)
Houses without a mortgage: 553
Median household income for houses/condos with a mortgage: $82,399
Median household income for apartments without a mortgage: $47,827
Median monthly housing costs: $903
Compare current foreclosures in Topeka, KS:
| Photo | Address | Area | Beds / Baths | Price | Details |
|---|---|---|---|---|---|

|
#1
SW Webster Ave
Topeka, KS 66606
|
1,086 sq. feet
|
1 baths 2 beds |
$159,000
|
show details |

|
#2
SE Maryland Ave
Topeka, KS 66605
|
1,348 sq. feet
|
1 baths 3 beds |
$162,500
|
show details |

|
#3
NE Sardou Ave
Topeka, KS 66608
|
916 sq. feet
|
1 baths 2 beds |
$57,900
|
show details |

|
#4
NW Topeka Blvd
Topeka, KS 66617
|
1,608 sq. feet
|
1 baths 4 beds |
$49,900
|
show details |

|
#5
SW Washburn Ave
Topeka, KS 66604
|
1,178 sq. feet
|
1 baths 2 beds |
show details | |

|
#6
SW Central Park Ave
Topeka, KS 66604
|
- sq. feet
|
- baths - beds |
$11,900
|
show details |

|
#7
SW Plass Ave
Topeka, KS 66611
|
1,370 sq. feet
|
1 baths 4 beds |
show details | |

|
#8
SE Kentucky Ave
Topeka, KS 66605
|
890 sq. feet
|
1 baths 2 beds |
show details | |

|
#9
SE Brookside Dr
Topeka, KS 66607
|
825 sq. feet
|
1 baths 3 beds |
show details | |

|
#10
NW Pueblo Ct
Topeka, KS 66618
|
1,374 sq. feet
|
1 baths 3 beds |
show details |
| Photo | Address | Area | Beds / Baths | Price | Details |
|---|---|---|---|---|---|

|
#11
NW 35th St
Topeka, KS 66618
|
1,880 sq. feet
|
2 baths 3 beds |
show details | |

|
#12
SE 29th Ter
Topeka, KS 66605
|
960 sq. feet
|
1 baths 3 beds |
show details | |

|
#13
SW Greenwood Ave
Topeka, KS 66606
|
2,472 sq. feet
|
1 baths 4 beds |
show details | |

|
#14
NW Rochester Rd
Topeka, KS 66617
|
1,370 sq. feet
|
1 baths 3 beds |
show details | |

|
#15
SW 34th Ter
Topeka, KS 66614
|
1,072 sq. feet
|
2 baths 3 beds |
show details | |

|
#16
SE Lawrence St
Topeka, KS 66607
|
1,064 sq. feet
|
1 baths 3 beds |
show details | |

|
#17
SW 32nd Ter
Topeka, KS 66611
|
2,017 sq. feet
|
2 baths 4 beds |
show details | |

|
#18
SW 32nd St
Topeka, KS 66611
|
1,128 sq. feet
|
2 baths 3 beds |
show details | |

|
#19
S Kansas Ave
Topeka, KS 66611
|
640 sq. feet
|
1 baths 2 beds |
show details | |

|
#20
SE Hancock St
Topeka, KS 66607
|
1,004 sq. feet
|
1 baths 2 beds |
show details |
| Photo | Address | Area | Beds / Baths | Price | Details |
|---|---|---|---|---|---|

|
#21
SW Westwood Ct
Topeka, KS 66614
|
1,244 sq. feet
|
2 baths 3 beds |
show details | |

|
#22
NE Winfield Ave
Topeka, KS 66616
|
1,013 sq. feet
|
1 baths 2 beds |
show details | |

|
#23
SW Lincoln St
Topeka, KS 66604
|
1,345 sq. feet
|
1 baths 4 beds |
show details | |

|
#24
SW 22nd St
Topeka, KS 66611
|
1,272 sq. feet
|
1 baths 2 beds |
show details | |

|
#25
SE 29th Ter
Topeka, KS 66605
|
960 sq. feet
|
1 baths 3 beds |
show details | |

|
#26
SE Granger St
Topeka, KS 66605
|
1,410 sq. feet
|
2 baths 3 beds |
show details | |

|
#27
SE Adams St
Topeka, KS 66605
|
932 sq. feet
|
1 baths 3 beds |
show details | |

|
#28
N Kansas Ave
Topeka, KS 66608
|
816 sq. feet
|
1 baths 2 beds |
show details | |

|
#29
SW 29th Ter
Topeka, KS 66614
|
1,681 sq. feet
|
2 baths 3 beds |
show details | |

|
#30
NE 39th St
Topeka, KS 66617
|
1,598 sq. feet
|
1 baths 2 beds |
show details |
| Photo | Address | Area | Beds / Baths | Price | Details |
|---|---|---|---|---|---|

|
#31
SE Pennsylvania Ave
Topeka, KS 66605
|
768 sq. feet
|
1 baths 2 beds |
show details | |

|
#32
NW Central Ave
Topeka, KS 66608
|
1,518 sq. feet
|
1 baths 2 beds |
show details | |

|
#33
SW Lewelling Rd
Topeka, KS 66619
|
1,200 sq. feet
|
2 baths 3 beds |
show details | |

|
#34
SW Village Dr
Topeka, KS 66604
|
1,671 sq. feet
|
3 baths 3 beds |
show details | |

|
#35
SE Indiana Ave
Topeka, KS 66605
|
1,413 sq. feet
|
1 baths 3 beds |
show details | |

|
#36
SE 36th Ter
Topeka, KS 66605
|
775 sq. feet
|
1 baths 3 beds |
show details | |

|
#37
SE Ohio Ave
Topeka, KS 66605
|
928 sq. feet
|
1 baths 3 beds |
show details | |

|
#38
SW Munson Ave
Topeka, KS 66604
|
1,732 sq. feet
|
2 baths 3 beds |
show details | |

|
#39
SW Lincoln St
Topeka, KS 66604
|
888 sq. feet
|
1 baths 2 beds |
show details | |

|
#40
SW Montara Northway
Topeka, KS 66619
|
1,136 sq. feet
|
1 baths 3 beds |
show details |
| Photo | Address | Area | Beds / Baths | Price | Details |
|---|---|---|---|---|---|

|
#41
SE 13th St
Topeka, KS 66607
|
864 sq. feet
|
1 baths 2 beds |
show details | |

|
#42
SW Watson Ave
Topeka, KS 66604
|
774 sq. feet
|
1 baths 2 beds |
show details | |

|
#43
SW Buchanan St
Topeka, KS 66611
|
960 sq. feet
|
1 baths 2 beds |
show details | |

|
#44
NE Freeman Ave
Topeka, KS 66616
|
668 sq. feet
|
1 baths 1 beds |
show details | |

|
#45
SW 23rd St
Topeka, KS 66611
|
1,020 sq. feet
|
1 baths 3 beds |
show details | |

|
#46
NE Freeman Ave
Topeka, KS 66616
|
955 sq. feet
|
1 baths 2 beds |
show details | |

|
#47
SW 17th St
Topeka, KS 66604
|
1,008 sq. feet
|
1 baths 3 beds |
show details | |

|
#48
SW 6th Ave
Topeka, KS 66606
|
1,808 sq. feet
|
1 baths 5 beds |
show details | |

|
#49
SW Tara Ave
Topeka, KS 66611
|
952 sq. feet
|
1 baths 3 beds |
show details | |

|
Check over 1 million property listings on Foreclosure.com!
|
browse all offers | |||

Latest news about housing in Topeka, KS collected exclusively by city-data.com from local newspapers, TV, and radio stations

 | What are some good towns near Topeka where I could rent an apartment? (6 replies) |
| Transient Housing Topeka (2 replies) |
| Why do people hate Topeka? (41 replies) |
| Month to Month Apartments in Topeka (1 reply) |
| Topeka, Kansas Rentals (1 reply) |
| Topeka - how different is this gonna be - possible relocation (9 replies) |

Median year apartment built: 1967
Household type by relationship:
Households: 125,464- Male householders: 26,084 (9,990 living alone), Female householders: 29,786 (11,805 living alone)
20,166 spouses (19,942 opposite-sex spouses), 3,793 unmarried partners, (3,394 opposite-sex unmarried partners), 32,357 children (29,706 natural, 998 adopted, 1,653 stepchildren), 2,471 grandchildren, 1,479 brothers or sisters, 758 parents, 61 foster children, 634 other relatives, 3,070 non-relatives
- In group quarters: 4,805
Size of family households: 16,319 2-persons, 4,871 3-persons, 4,517 4-persons, 2,618 5-persons, 1,297 6-persons, 236 7-or-more-persons.
Size of nonfamily households: 21,795 1-person, 3,692 2-persons, 365 3-persons, 160 4-persons.
15,155 married couples with children.
9,397 single-parent households (3,509 men, 5,888 women).
90.5% of residents of Topeka speak English at home.
7.8% of residents speak Spanish at home (56% speak English very well, 18% speak English well, 19% speak English not well, 7% don't speak English at all).
0.8% of residents speak other Indo-European language at home (64% speak English very well, 13% speak English well, 23% speak English not well).
1.0% of residents speak Asian or Pacific Island language at home (58% speak English very well, 28% speak English well, 13% speak English not well, 1% don't speak English at all).
0.2% of residents speak other language at home (91% speak English very well, 3% speak English well, 7% don't speak English at all).
Foreign born population: 7,886 (6.3%)
(41.1% of them are naturalized citizens)
| Here: | 6.4 |
| State: | 6.9 |
| Here: | 4.1 |
| State: | 4.4 |
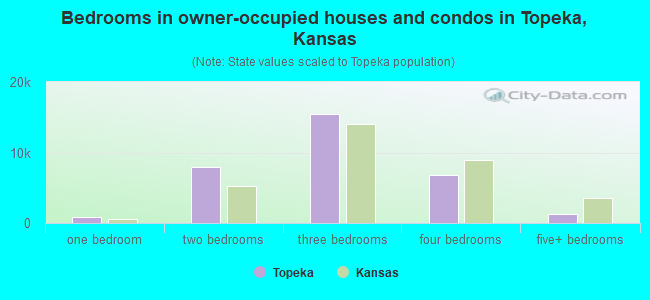
- Bedrooms in owner-occupied houses and condos in Topeka, Kansas
- 48no bedroom
- 8741 bedroom
- 7,9752 bedrooms
- 15,4233 bedrooms
- 6,8084 bedrooms
- 1,3455+ bedrooms
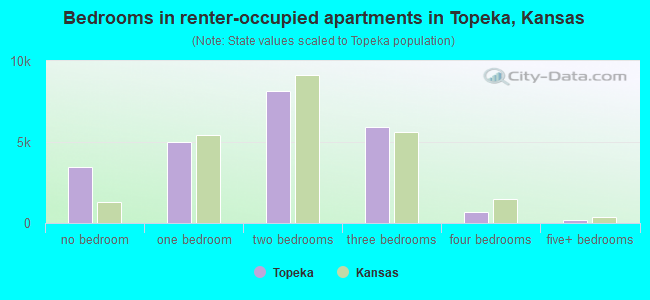
- Bedrooms in renter-occupied apartments in Topeka, Kansas
- 3,485no bedroom
- 4,9931 bedroom
- 8,1322 bedrooms
- 5,9073 bedrooms
- 6674 bedrooms
- 2135+ bedrooms
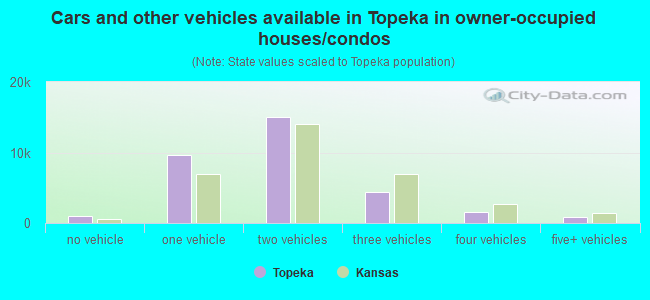
- Cars and other vehicles available in Topeka in owner-occupied houses/condos
- 1,038no vehicle
- 9,6951 vehicle
- 14,9752 vehicles
- 4,4083 vehicles
- 1,5654 vehicles
- 7925+ vehicles
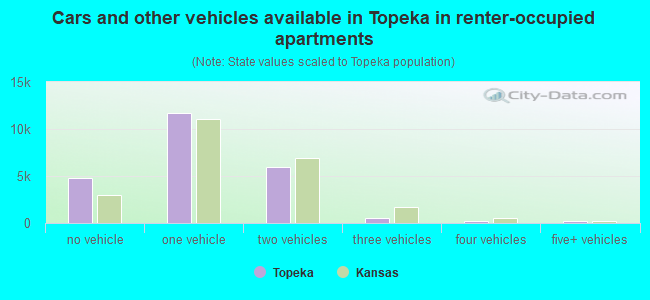
- Cars and other vehicles available in Topeka in renter-occupied apartments
- 4,807no vehicle
- 11,7291 vehicle
- 5,9392 vehicles
- 5573 vehicles
- 1904 vehicles
- 1755+ vehicles
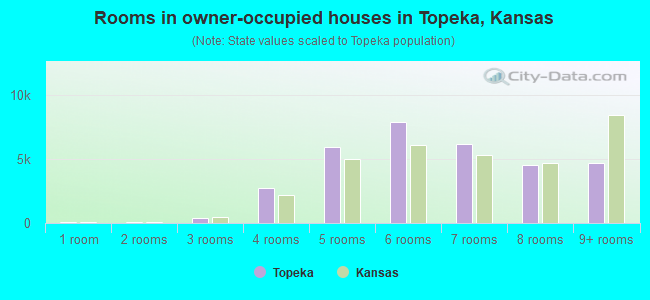
- Rooms in owner-occupied houses in Topeka, Kansas
- 481 room
- 702 rooms
- 4113 rooms
- 2,7014 rooms
- 5,9445 rooms
- 7,9356 rooms
- 6,1647 rooms
- 4,5108 rooms
- 4,6909+ rooms
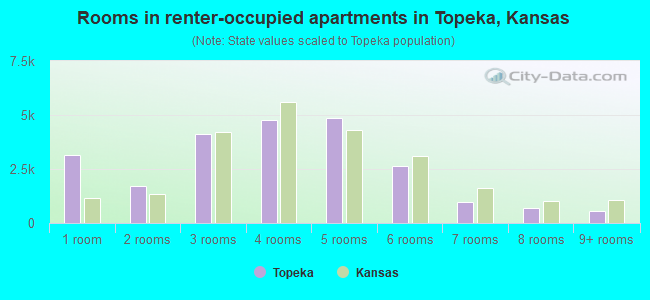
- Rooms in renter-occupied apartments in Topeka, Kansas
- 3,1491 room
- 1,6902 rooms
- 4,1023 rooms
- 4,7694 rooms
- 4,8535 rooms
- 2,6176 rooms
- 9687 rooms
- 7088 rooms
- 5419+ rooms
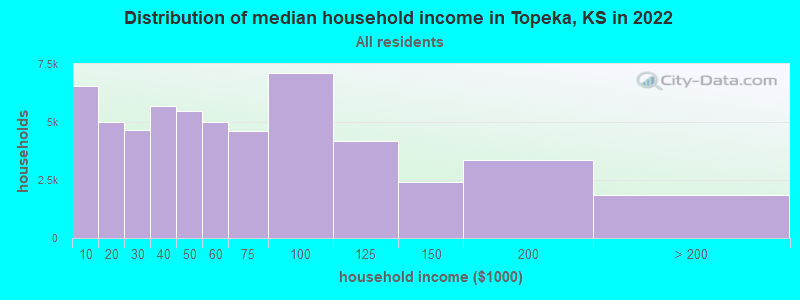
Topeka, KS household income distribution

- 6,542Less than $10,000
- 4,995$10,000 to $19,999
- 4,643$20,000 to $29,999
- 5,689$30,000 to $39,999
- 5,489$40,000 to $49,999
- 5,018$50,000 to $59,999
- 4,608$60,000 to $74,999
- 7,098$75,000 to $99,999
- 4,182$100,000 to $124,999
- 2,402$125,000 to $149,999
- 3,363$150,000 to $199,999
- 1,841$200,000 or more
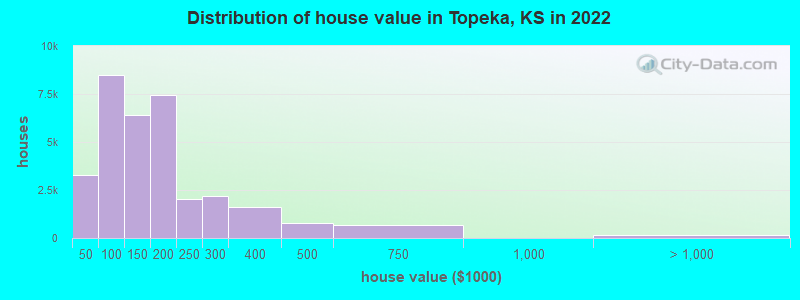
Home value of owner - occupied houses in 2022 in Topeka, KS
-
- 946Less than $10,000
- 172$10,000 to $14,999
- 169$15,000 to $19,999
- 251$20,000 to $24,999
- 553$25,000 to $29,999
- 313$30,000 to $34,999
- 281$35,000 to $39,999
- 618$40,000 to $49,999
- 1,421$50,000 to $59,999
- 941$60,000 to $69,999
- 1,311$70,000 to $79,999
- 1,936$80,000 to $89,999
- 2,278$90,000 to $99,999
- 3,365$100,000 to $124,999
- 3,018$125,000 to $149,999
- 4,424$150,000 to $174,999
- 3,020$175,000 to $199,999
- 2,038$200,000 to $249,999
- 2,165$250,000 to $299,999
- 1,618$300,000 to $399,999
- 795$400,000 to $499,999
- 659$500,000 to $749,999
- 130$1,000,000 to $1,499,999
- 51$2,000,000 or more
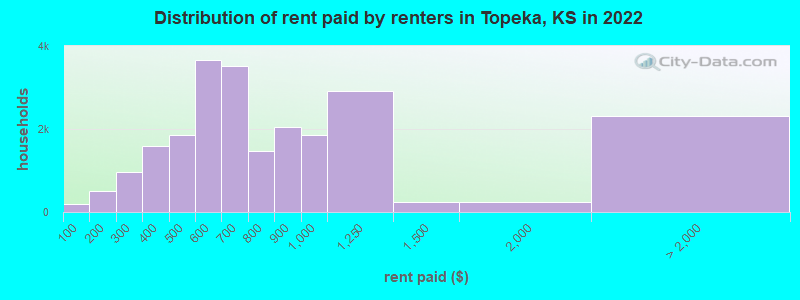
Rent paid by renters in 2022 in Topeka, KS
-
- 181Less than $100
- 434$100 to $149
- 82$150 to $199
- 595$200 to $249
- 367$250 to $299
- 1,095$300 to $349
- 502$350 to $399
- 642$400 to $449
- 1,212$450 to $499
- 1,846$500 to $549
- 1,818$550 to $599
- 1,405$600 to $649
- 2,109$650 to $699
- 655$700 to $749
- 819$750 to $799
- 2,055$800 to $899
- 1,847$900 to $999
- 2,927$1,000 to $1,249
- 245$1,250 to $1,499
- 249$1,500 to $1,999
- 598$2,000 to $2,499
- 96$2,500 to $2,999
- 210$3,000 to $3,499
- 57$3,500 or more
- 1,351No cash rent
Percentage of workers working in this county: 92.7%
Number of people working at home: 6,921 (12.5% of all workers)
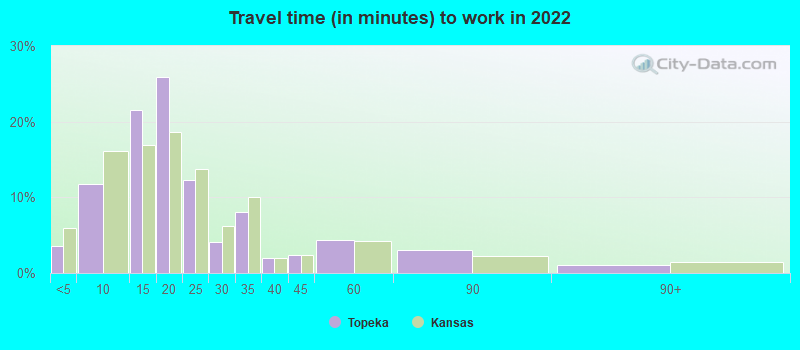
Travel time to work (commute)
- Less than 5 minutes: 2,446
- 5 to 9 minutes: 6,869
- 10 to 14 minutes: 11,979
- 15 to 19 minutes: 13,211
- 20 to 24 minutes: 7,056
- 25 to 29 minutes: 917
- 30 to 34 minutes: 2,111
- 35 to 39 minutes: 271
- 40 to 44 minutes: 469
- 45 to 59 minutes: 362
- 60 to 89 minutes: 1,392
- 90 or more minutes: 506
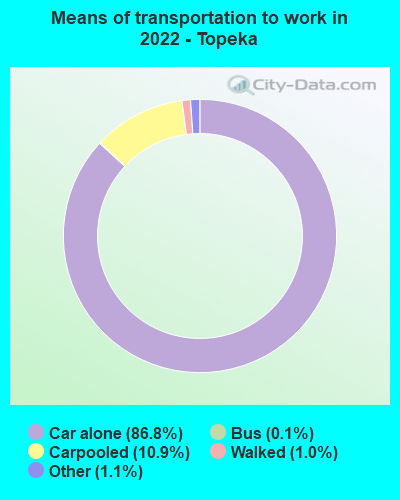
Means of transportation to work:
- Drove a car alone: 56,689 (77.9%)
- Carpooled: 7,128 (9.8%)
- Bus: 72 (0.1%)
- Taxi: 735 (1.0%)
- Walked: 678 (0.9%)
- Worked at home: 7,435 (10.2%)
- Unemployment by race in 2022
- Unemployment rate for White non-Hispanic residents
- 5.1%Males
- 4.3%Females
- Unemployment rate for Black residents
- 11.1%Males
- 10.5%Females
- Unemployment rate for American Indian and Alaska Native residents
- 8.2%Males
- Unemployment rate for Asian residents
- 2.1%Males
- 9.2%Females
- Unemployment rate for other race residents
- 3.5%Males
- 2.3%Females
- Unemployment rate for two or more race residents
- 8.0%Males
- 2.2%Females
- Unemployment rate for Hispanic or Latino residents
- 3.6%Males
- 2.9%Females
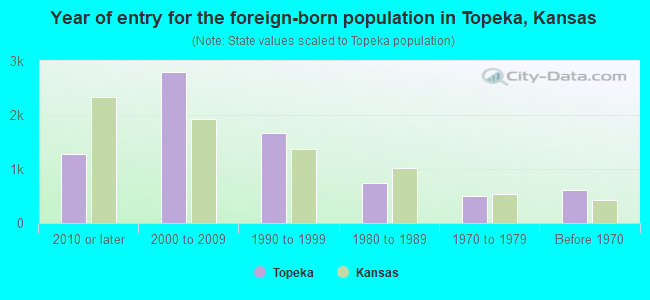
- Year of entry for the foreign-born population in Topeka, Kansas
- 1,2762010 or later
- 2,8002000 to 2009
- 1,6681990 to 1999
- 7341980 to 1989
- 5091970 to 1979
- 620Before 1970
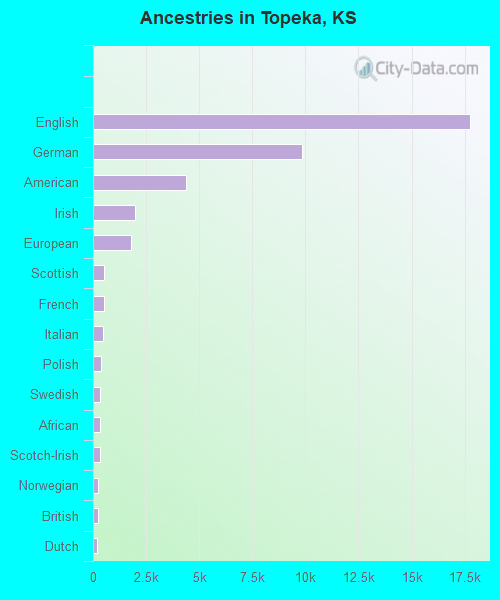
First ancestries reported:
- English: 17,757 (28.0%)
- German: 9,823 (15.5%)
- American: 4,356 (6.9%)
- Irish: 1,988 (3.1%)
- European: 1,777 (2.8%)
- Scottish: 507 (0.8%)
- French: 504 (0.8%)
- Italian: 470 (0.7%)
- Polish: 373 (0.6%)
- Swedish: 348 (0.5%)
- African: 325 (0.5%)
- Scotch-Irish: 315 (0.5%)
- Norwegian: 247 (0.4%)
- British: 229 (0.4%)
- Dutch: 189 (0.3%)
- Scandinavian: 108 (0.2%)
- Czech: 105 (0.2%)
- Portuguese: 91 (0.1%)
- Welsh: 72 (0.1%)
- Nigerian: 71 (0.1%)
- Swiss: 67 (0.1%)
- Danish: 66 (0.1%)
- Ukrainian: 64 (0.1%)
- Northern European: 61 (0.10%)
- French Canadian: 58 (0.09%)
- German Russian: 54 (0.09%)
- Ghanaian: 54 (0.09%)
- Czechoslovakian: 48 (0.08%)
- Eastern European: 38 (0.06%)
- Russian: 36 (0.06%)
- Austrian: 35 (0.06%)
- Brazilian: 35 (0.06%)
- Croatian: 33 (0.05%)
- Macedonian: 32 (0.05%)
- Hungarian: 27 (0.04%)
- Greek: 22 (0.03%)
- Finnish: 19 (0.03%)
- Haitian: 19 (0.03%)
- Kenyan: 17 (0.03%)
- Armenian: 14 (0.02%)
- Syrian: 13 (0.02%)
- Lithuanian: 12 (0.02%)
- Jamaican: 12 (0.02%)
- Lebanese: 10 (0.02%)
- Belgian: 6 (0.01%)
- Iranian: 5 (0.01%)
Most common places of birth for foreign-born residents (%):
| Topeka: | 58.1% (4,056) |
| Kansas: | 39.2% (81,282) |
| Topeka: | 9.2% (645) |
| Kansas: | 6.5% (13,547) |
| Topeka: | 3.8% (262) |
| Kansas: | 2.6% (5,492) |
| Topeka: | 3.1% (217) |
| Kansas: | 5.5% (11,323) |
| Topeka: | 2.3% (163) |
| Kansas: | 3.9% (8,053) |
| Topeka: | 2.1% (144) |
| Kansas: | 0.7% (1,520) |
| Topeka: | 1.9% (134) |
| Kansas: | 0.9% (1,963) |
| Topeka: | 1.5% (107) |
| Kansas: | 1.2% (2,585) |
Place of birth for U.S.-born residents:
- This state: 84,163
- Other state: 31,306
- Northeast: 1,638
- Midwest: 13,517
- South: 8,835
- West: 7,316
77.9% of Topeka residents lived in the same house 1 years ago.
Out of people who lived in different houses, 38.9% lived in this county.
Out of people who lived in different counties, 56.1% lived in Kansas.
| Topeka: | 77.9% |
| State average: | 85.3% |
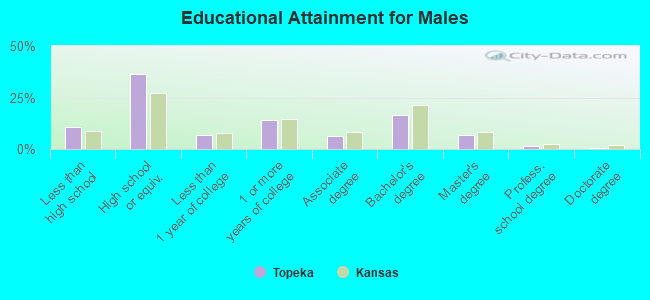
Education attainment for males 25 years and older:
- No schooling: 489
- Nursery to 4th grade: 269
- 5th and 6th grade: 417
- 7th and 8th grade: 416
- 9th grade: 266
- 10th grade: 898
- 11th grade: 431
- 12th grade, no diploma: 1,015
- High school graduate (or equivalency): 14,273
- Less than 1 year of college: 2,683
- Some college more than 1 year, no degree: 5,630
- Associate degree: 2,471
- Bachelor's degree: 6,573
- Master's degree: 2,707
- Professional school degree: 641
- Doctorate degree: 280
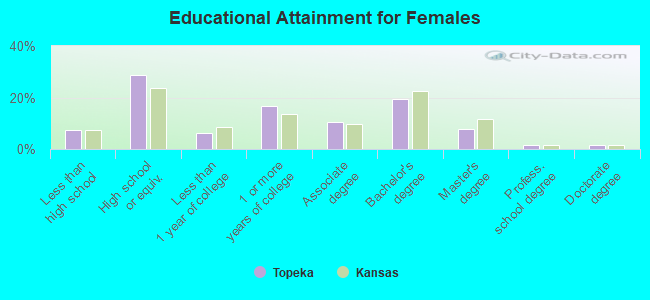
Education attainment for females 25 years and older:
- No schooling: 308
- Nursery to 4th grade: 92
- 5th and 6th grade: 464
- 7th and 8th grade: 429
- 9th grade: 329
- 10th grade: 315
- 11th grade: 695
- 12th grade, no diploma: 744
- High school graduate (or equivalency): 12,861
- Less than 1 year of college: 2,826
- Some college more than 1 year, no degree: 7,543
- Associate degree: 4,671
- Bachelor's degree: 8,742
- Master's degree: 3,504
- Professional school degree: 636
- Doctorate degree: 691


Housing units in structures:
- One, detached: 39,302
- One, attached: 3,222
- Two: 1,692
- 3 or 4: 2,564
- 5 to 9: 2,992
- 10 to 19: 2,932
- 20 to 49: 2,915
- 50 or more: 2,978
- Mobile homes: 1,957
Median worth of mobile homes: $11,759
Housing units lacking complete kitchen facilities in 2022: 5.6%
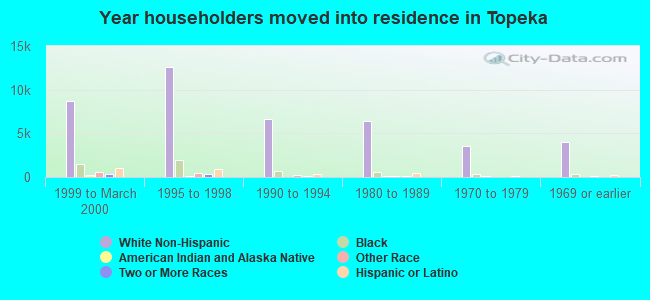
House/condo owner moved in on average 11 years ago
Renter moved in on average 2 years ago
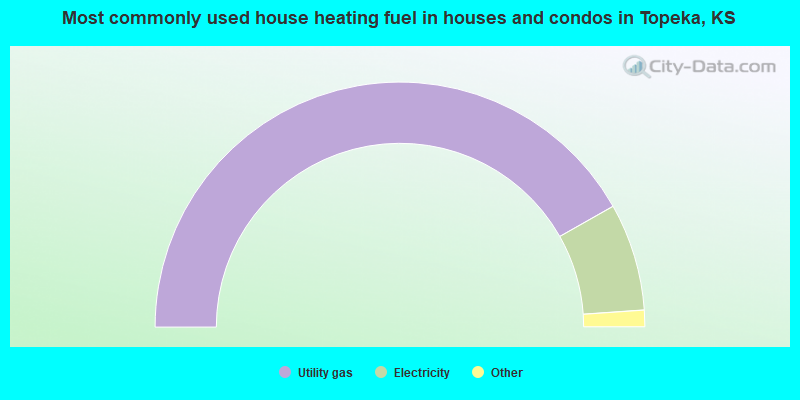
- 83.6%Utility gas
- 14.2%Electricity
- 1.4%Bottled, tank, or LP gas
- 0.5%Wood
- 0.1%No fuel used
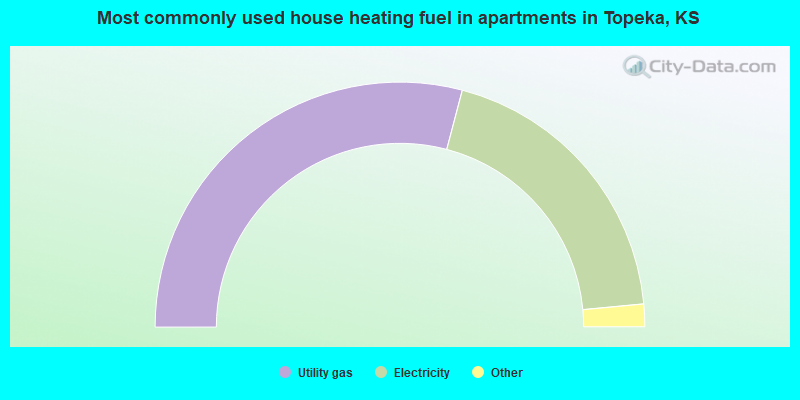
- 58.2%Utility gas
- 38.8%Electricity
- 1.6%Bottled, tank, or LP gas
- 0.8%No fuel used
- 0.4%Other fuel
- 0.1%Fuel oil, kerosene, etc.
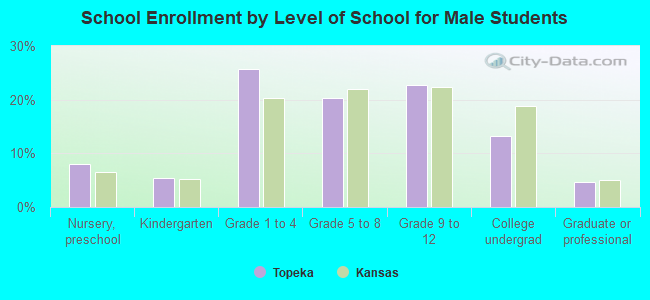
Private vs. public school enrollment:
| Here: | 8.4% |
| Kansas: | 14.1% |
| Here: | 17.1% |
| Kansas: | 10.8% |
| Here: | 19.9% |
| Kansas: | 15.4% |