Troy, MI (Michigan) Houses and Residents
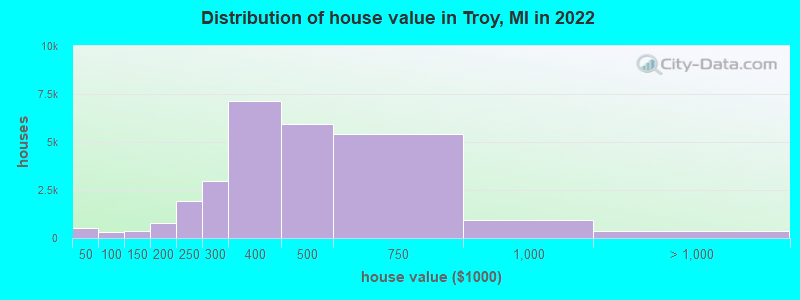
Estimated median house or condo value in 2022: $380,100 (it was $217,800 in 2000 )
Troy:
$380,100Michigan:
$224,400
Lower value quartile - upper value quartile: $296,200 - $518,600Mean price in 2022: Detached houses: $444,965 Here:
$444,965State:
$280,038
Townhouses or other attached units: $290,461 Here:
$290,461State:
$239,520
In 2-unit structures: $516,847 Here:
$516,847State:
$219,481
In 3-to-4-unit structures: $212,976 Here:
$212,976State:
$207,067
In 5-or-more-unit structures: $223,182 Here:
$223,182State:
$192,733
Mobile homes: $25,736 Here:
$25,736State:
$72,868
Total population: 83,107 (Urban population: 80,959, Rural population: 0)
Houses: 34,373 (32,800 occupied: 24,771 owner occupied, 8,029 renter occupied )
% of renters here:
24%State:
27%
Housing density: 1,025 houses/condos per square mile
Median price asked for vacant for-sale houses and condos in 2022: $380,620.
Median contract rent in 2022: $1,248 (lower quartile is $1,005, upper quartile is $1,867)
Median rent asked for vacant for-rent units in 2022: $2,182
Median gross rent in Troy, MI in 2022: $1,375
Housing units in Troy with a mortgage: 15,012 (1,190 second mortgage, 40 home equity loan, 1,106 both second mortgage and home equity loan )Houses without a mortgage: 745
Median household income for houses/condos with a mortgage: $145,647
Median household income for apartments without a mortgage: $127,375
Median monthly housing costs: $1,365
Data:
Median house or condo value ($)
Median house or condo value ($ change since 2000)
Median house or condo value ($) - White
Median house or condo value ($) - Black or African American
Median house or condo value ($) - Asian
Median house or condo value ($) - Hispanic or Latino
Median house or condo value ($) - American Indian and Alaska Native
Median house or condo value ($) - Multirace
Median house or condo value ($) - Other Race
Median price asked for mobile homes ($)
Household density (households per square mile)
Mean house or condo value by units in structure - 1, detached ($)
Mean house or condo value by units in structure - 1, attached ($)
Mean house or condo value by units in structure - 2 ($)
Mean house or condo value by units in structure by units in structure - 3 or 4 ($)
Mean house or condo value by units in structure - 5 or more ($)
Mean house or condo value by units in structure - Boat, RV, van, etc. ($)
Mean house or condo value by units in structure - Mobile home ($)
Median contract rent ($)
Median contract rent - Lower quartile ($)
Median contract rent - Upper quartile ($)
Median gross rent ($)
Urban houses (%)
Rural houses (%)
Houses occupied (%)
Houses occupied (% change since 2000)
Houses owner occupied (%)
Houses owner occupied (% change since 2000)
Houses renter occupied (%)
Houses renter occupied (% change since 2000)
Vacant housing units - For rent (%)
Vacant housing units - For rent (% change since 2000)
Vacant housing units - For sale only (%)
Vacant housing units - For sale only (% change since 2000)
Vacant housing units - Rented or sold, not occupied (%)
Vacant housing units - Rented or sold, not occupied (% change since 2000)
Vacant housing units - For seasonal, recreational, or occasional use (%)
Vacant housing units - For seasonal, recreational, or occasional use (% change since 2000)
Vacant housing units - For migrant workers (%)
Vacant housing units - For migrant workers (% change since 2000)
Vacant housing units - Other vacant (%)
Vacant housing units - Other vacant (% change since 2000)
Median monthly housing costs ($)
Median household income for houses/condos with a mortgage ($)
Median household income for houses/condos without a mortgage ($)
Median household income ($)
Median household income ($) - White
Median household income ($) - Black or African American
Median household income ($) - Asian
Median household income ($) - Hispanic or Latino
Median household income ($) - American Indian and Alaska Native
Median household income ($) - Multirace
Median household income ($) - Other Race
Mortgage status - with mortgage (%)
Mortgage status - with second mortgage (%)
Mortgage status - with home equity loan (%)
Mortgage status - with both second mortgage and home equity loan (%)
Mortgage status - without a mortgage (%)
Median year house/condo built
Median year apartment built
Household type by relationship - Male householder living alone (%)
Household type by relationship - Male householder not living alone (%)
Household type by relationship - Female householder living alone (%)
Household type by relationship - Female householder not living alone (%)
Household type by relationship - Opposite-Sex spouse (%)
Household type by relationship - Same-Sex spouse (%)
Household type by relationship - Opposite-Sex unmarried partner (%)
Household type by relationship - Same-Sex unmarried partner (%)
Household type by relationship - In group quarters (%)
Size of family households - 2-person household (%)
Size of family households - 3-person household (%)
Size of family households - 4-person household (%)
Size of family households - 5-person household (%)
Size of family households - 6-person household (%)
Size of family households - 7-or-more-person household (%)
Size of nonfamily households - 1-person household (%)
Size of nonfamily households - 2-person household (%)
Size of nonfamily households - 3-person household (%)
Size of nonfamily households - 4-person household (%)
Size of nonfamily households - 5-person household (%)
Size of nonfamily households - 6-person household (%)
Size of nonfamily households - 7-or-moreperson household (%)
Year house built - Built 2010 or later (%)
Year house built - Built 2000 to 2009 (%)
Year house built - Built 1990 to 1999 (%)
Year house built - Built 1980 to 1989 (%)
Year house built - Built 1970 to 1979 (%)
Year house built - Built 1960 to 1969 (%)
Year house built - Built 1950 to 1959 (%)
Year house built - Built 1940 to 1949 (%)
Year house built - Built 1939 or earlier (%)
Median number of rooms in houses and condos
Median number of rooms in apartments
Median number of bedrooms in owner occupied houses
Mean number of bedrooms in owner occupied houses
Median number of bedrooms in renter occupied houses
Mean number of bedrooms in renter occupied houses
Median number of vehichles in owner occupied houses
Mean number of vehichles in owner occupied houses
Median number of vehichles in renter occupied houses
Mean number of vehichles in renter occupied houses
Rooms in owner-occupied houses - 1 room (%)
Rooms in owner-occupied houses - 2 rooms (%)
Rooms in owner-occupied houses - 3 rooms (%)
Rooms in owner-occupied houses - 4 rooms (%)
Rooms in owner-occupied houses - 5 rooms (%)
Rooms in owner-occupied houses - 6 rooms (%)
Rooms in owner-occupied houses - 7 rooms (%)
Rooms in owner-occupied houses - 8 rooms (%)
Rooms in owner-occupied houses - 9+ rooms (%)
Rooms in renter-occupied houses - 1 room (%)
Rooms in renter-occupied houses - 2 rooms (%)
Rooms in renter-occupied houses - 3 rooms (%)
Rooms in renter-occupied houses - 4 rooms (%)
Rooms in renter-occupied houses - 5 rooms (%)
Rooms in renter-occupied houses - 6 rooms (%)
Rooms in renter-occupied houses - 7 rooms (%)
Rooms in renter-occupied houses - 8 rooms (%)
Rooms in renter-occupied houses - 9+ rooms (%)
Bedrooms in owner-occupied houses - no bedrooms (%)
Bedrooms in owner-occupied houses - 1 bedroom (%)
Bedrooms in owner-occupied houses - 2 bedrooms (%)
Bedrooms in owner-occupied houses - 3 bedrooms (%)
Bedrooms in owner-occupied houses - 4 bedrooms (%)
Bedrooms in owner-occupied houses - 5+ bedrooms (%)
Bedrooms in renter-occupied houses - no bedrooms (%)
Bedrooms in renter-occupied houses - 1 bedroom (%)
Bedrooms in renter-occupied houses - 2 bedrooms (%)
Bedrooms in renter-occupied houses - 3 bedrooms (%)
Bedrooms in renter-occupied houses - 4 bedrooms (%)
Bedrooms in renter-occupied houses - 5+ bedrooms (%)
Vehicles available in owner-occupied houses - no vehicle available (%)
Vehicles available in owner-occupied houses - 1 vehicle available(%)
Vehicles available in owner-occupied houses - 2 Vehicles available (%)
Vehicles available in owner-occupied houses - 3 Vehicles available (%)
Vehicles available in owner-occupied houses - 4 Vehicles available (%)
Vehicles available in owner-occupied houses - 5+ Vehicles available (%)
Vehicles available in renter-occupied houses - no vehicle available (%)
Vehicles available in renter-occupied houses - 1 vehicle available (%)
Vehicles available in renter-occupied houses - 2 Vehicles available (%)
Vehicles available in renter-occupied houses - 3 Vehicles available (%)
Vehicles available in renter-occupied houses - 4 Vehicles available (%)
Vehicles available in renter-occupied houses - 5+ Vehicles available (%)
Housing units in structures - 1, detached (%)
Housing units in structures - 1, attached (%)
Housing units in structures - 2 (%)
Housing units in structures - 3 or 4 (%)
Housing units in structures - 5 to 9 (%)
Housing units in structures - 10 to 19 (%)
Housing units in structures - 20 to 49 (%)
Housing units in structures - 50 or more (%)
Housing units in structures - Mobile home (%)
Housing units in structures - Boat, RV, van, etc. (%)
Housing units in structures - Owners - 1, detached (%)
Housing units in structures - Owners - 1, attached (%)
Housing units in structures - Owners - 2 (%)
Housing units in structures - Owners - 3 or 4 (%)
Housing units in structures - Owners - 5 to 9 (%)
Housing units in structures - Owners - 10 to 19 (%)
Housing units in structures - Owners - 20 to 49 (%)
Housing units in structures - Owners - 50 or more (%)
Housing units in structures - Owners - Mobile home (%)
Housing units in structures - Owners - Boat, RV, van, etc. (%)
Housing units in structures - Renters - 1, detached (%)
Housing units in structures - Renters - 1, attached (%)
Housing units in structures - Renters - 2 (%)
Housing units in structures - Renters - 3 or 4 (%)
Housing units in structures - Renters - 5 to 9 (%)
Housing units in structures - Renters - 10 to 19 (%)
Housing units in structures - Renters - 20 to 49 (%)
Housing units in structures - Renters - 50 or more (%)
Housing units in structures - Renters - Mobile home (%)
Housing units in structures - Renters - Boat, RV, van, etc. (%)
House/condo owner moved in on average (years ago)
Renter moved in on average (years ago)
Year householder moved into unit - Moved in 1999 to March 2000 (%)
Year householder moved into unit - Moved in 1999 to March 2000 (%) - White
Year householder moved into unit - Moved in 1999 to March 2000 (%) - Black or African American
Year householder moved into unit - Moved in 1999 to March 2000 (%) - Asian
Year householder moved into unit - Moved in 1999 to March 2000 (%) - Hispanic or Latino
Year householder moved into unit - Moved in 1999 to March 2000 (%) - American Indian and Alaska Native
Year householder moved into unit - Moved in 1999 to March 2000 (%) - Multirace
Year householder moved into unit - Moved in 1999 to March 2000 (%) - Other Race
Year householder moved into unit - Moved in 1995 to 1998 (%)
Year householder moved into unit - Moved in 1995 to 1998 (%) - White
Year householder moved into unit - Moved in 1995 to 1998 (%) - Black or African American
Year householder moved into unit - Moved in 1995 to 1998 (%) - Asian
Year householder moved into unit - Moved in 1995 to 1998 (%) - Hispanic or Latino
Year householder moved into unit - Moved in 1995 to 1998 (%) - American Indian and Alaska Native
Year householder moved into unit - Moved in 1995 to 1998 (%) - Multirace
Year householder moved into unit - Moved in 1995 to 1998 (%) - Other Race
Year householder moved into unit - Moved in 1990 to 1994 (%)
Year householder moved into unit - Moved in 1990 to 1994 (%) - White
Year householder moved into unit - Moved in 1990 to 1994 (%) - Black or African American
Year householder moved into unit - Moved in 1990 to 1994 (%) - Asian
Year householder moved into unit - Moved in 1990 to 1994 (%) - Hispanic or Latino
Year householder moved into unit - Moved in 1990 to 1994 (%) - American Indian and Alaska Native
Year householder moved into unit - Moved in 1990 to 1994 (%) - Multirace
Year householder moved into unit - Moved in 1990 to 1994 (%) - Other Race
Year householder moved into unit - Moved in 1980 to 1989 (%)
Year householder moved into unit - Moved in 1980 to 1989 (%) - White
Year householder moved into unit - Moved in 1980 to 1989 (%) - Black or African American
Year householder moved into unit - Moved in 1980 to 1989 (%) - Asian
Year householder moved into unit - Moved in 1980 to 1989 (%) - Hispanic or Latino
Year householder moved into unit - Moved in 1980 to 1989 (%) - American Indian and Alaska Native
Year householder moved into unit - Moved in 1980 to 1989 (%) - Multirace
Year householder moved into unit - Moved in 1980 to 1989 (%) - Other Race
Year householder moved into unit - Moved in 1970 to 1979 (%)
Year householder moved into unit - Moved in 1970 to 1979 (%) - White
Year householder moved into unit - Moved in 1970 to 1979 (%) - Black or African American
Year householder moved into unit - Moved in 1970 to 1979 (%) - Asian
Year householder moved into unit - Moved in 1970 to 1979 (%) - Hispanic or Latino
Year householder moved into unit - Moved in 1970 to 1979 (%) - American Indian and Alaska Native
Year householder moved into unit - Moved in 1970 to 1979 (%) - Multirace
Year householder moved into unit - Moved in 1970 to 1979 (%) - Other Race
Year householder moved into unit - Moved in 1969 or earlier (%)
Year householder moved into unit - Moved in 1969 or earlier (%) - White
Year householder moved into unit - Moved in 1969 or earlier (%) - Black or African American
Year householder moved into unit - Moved in 1969 or earlier (%) - Asian
Year householder moved into unit - Moved in 1969 or earlier (%) - Hispanic or Latino
Year householder moved into unit - Moved in 1969 or earlier (%) - American Indian and Alaska Native
Year householder moved into unit - Moved in 1969 or earlier (%) - Multirace
Year householder moved into unit - Moved in 1969 or earlier (%) - Other Race
Housing units lacking complete plumbing facilities (%)
Housing units lacking complete kitchen facilities (%)
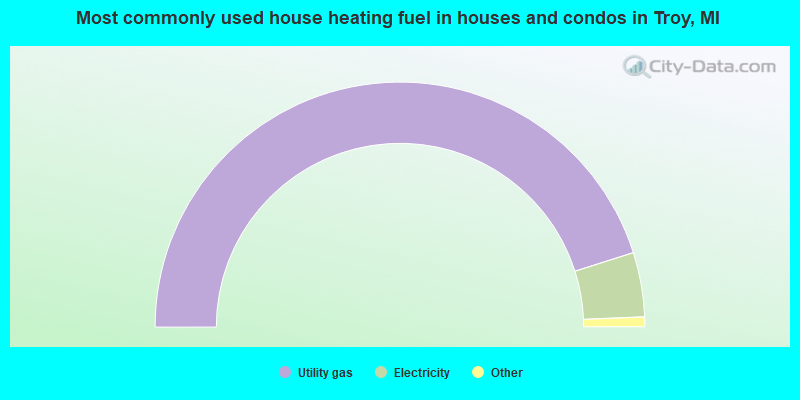
House heating fuel used in houses and condos - Utility gas (%)
House heating fuel used in houses and condos - Bottled, tank, or LP gas (%)
House heating fuel used in houses and condos - Electricity (%)
House heating fuel used in houses and condos - Fuel oil, kerosene, etc. (%)
House heating fuel used in houses and condos - Coal or coke (%)
House heating fuel used in houses and condos - Wood (%)
House heating fuel used in houses and condos - Solar energy (%)
House heating fuel used in houses and condos - Other fuel (%)
House heating fuel used in houses and condos - No fuel used (%)
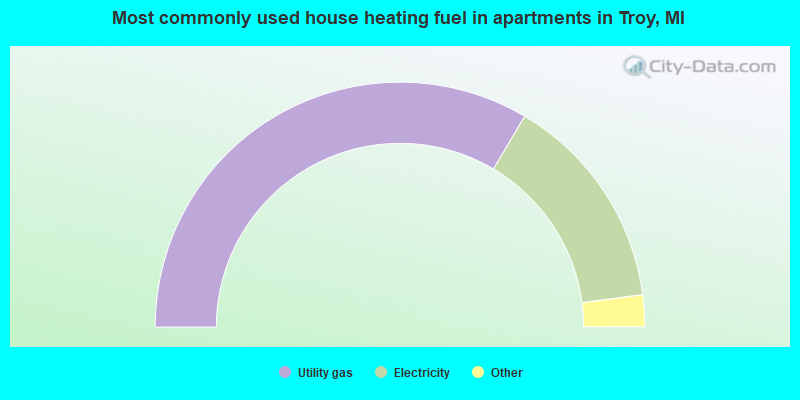
House heating fuel used in apartments - Utility gas (%)
House heating fuel used in apartments - Bottled, tank, or LP gas (%)
House heating fuel used in apartments - Electricity (%)
House heating fuel used in apartments - Fuel oil, kerosene, etc. (%)
House heating fuel used in apartments - Coal or coke (%)
House heating fuel used in apartments - Wood (%)
House heating fuel used in apartments - Solar energy (%)
House heating fuel used in apartments - Other fuel (%)
House heating fuel used in apartments - No fuel used (%)
Latest news about housing in Troy, MI collected exclusively by city-data.com from local newspapers, TV, and radio stations
Median year house/condo built: 1977Median year apartment built: 1979Household type by relationship:
Households: 87,182
Male householders: 19,389 (3,630 living alone ), Female householders: 13,411 (5,284 living alone )17,976 spouses (17,875 opposite-sex spouses ), 1,707 unmarried partners , (1,663 opposite-sex unmarried partners ), 27,410 children (26,263 natural , 474 adopted , 673 stepchildren ), 1,009 grandchildren , 1,543 brothers or sisters , 1,937 parents , 46 foster children , 1,077 other relatives , 1,416 non-relatives In group quarters: 261
Size of family households: 8,965 2-persons , 4,084 3-persons , 5,303 4-persons , 2,435 5-persons , 1,455 6-persons , 261 7-or-more-persons .
Size of nonfamily households: 8,914 1-person , 1,216 2-persons , 56 3-persons , 111 4-persons .
14,392 married couples with children. single-parent households (655 men , 2,064 women ).
66.8% of residents of Troy speak English at home. of residents speak Spanish at home (73% speak English very well , 15% speak English well , 12% speak English not well ).of residents speak other Indo-European language at home (80% speak English very well , 13% speak English well , 6% speak English not well , 2% don't speak English at all ).of residents speak Asian or Pacific Island language at home (65% speak English very well , 27% speak English well , 7% speak English not well , 1% don't speak English at all ).of residents speak other language at home (73% speak English very well , 15% speak English well , 6% speak English not well , 6% don't speak English at all ).
Foreign born population: 28,592 (32.8%)of them are naturalized citizens )
Median number of rooms in houses and condos:
Median number of rooms in apartments
Owner-occupied Renter-occupied
Rooms in owner-occupied houses in Troy, Michigan
0 1 room 59 2 rooms 156 3 rooms 1,315 4 rooms 2,563 5 rooms 4,354 6 rooms 4,601 7 rooms 4,500 8 rooms 7,223 9+ rooms
Rooms in renter-occupied apartments in Troy, Michigan
452 1 room 566 2 rooms 2,490 3 rooms 2,165 4 rooms 1,334 5 rooms 400 6 rooms 338 7 rooms 0 8 rooms 284 9+ rooms
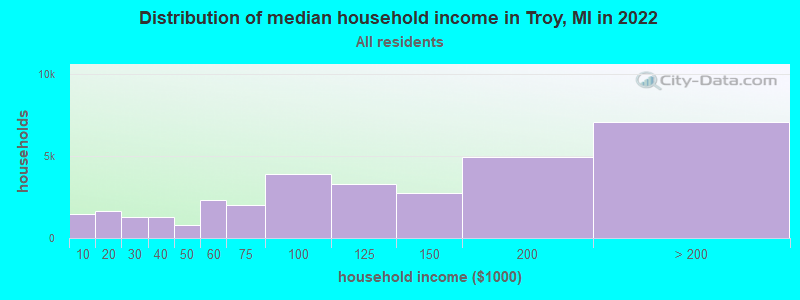
Troy, MI household income distribution 1,480 Less than $10,0001,663 $10,000 to $19,9991,274 $20,000 to $29,9991,295 $30,000 to $39,999770 $40,000 to $49,9992,308 $50,000 to $59,9992,039 $60,000 to $74,9993,922 $75,000 to $99,9993,279 $100,000 to $124,9992,725 $125,000 to $149,9994,951 $150,000 to $199,9997,094 $200,000 or more
Home value of owner - occupied houses in 2022 in Troy, MI 186 Less than $10,00051 $10,000 to $14,99954 $15,000 to $19,99946 $25,000 to $29,99938 $30,000 to $34,99965 $35,000 to $39,99987 $40,000 to $49,99988 $50,000 to $59,99928 $60,000 to $69,99918 $70,000 to $79,99946 $80,000 to $89,99954 $90,000 to $99,999259 $100,000 to $124,999112 $125,000 to $149,999414 $150,000 to $174,999391 $175,000 to $199,9991,945 $200,000 to $249,9992,948 $250,000 to $299,9997,149 $300,000 to $399,9995,929 $400,000 to $499,9995,415 $500,000 to $749,999957 $750,000 to $999,999310 $1,000,000 to $1,499,9996 $1,500,000 to $1,999,99971 $2,000,000 or moreRent paid by renters in 2022 in Troy, MI 56 Less than $100223 $200 to $249516 $250 to $29918 $300 to $34968 $350 to $39995 $400 to $4494 $450 to $49929 $500 to $54977 $550 to $59955 $600 to $64930 $650 to $69923 $700 to $74963 $750 to $79969 $800 to $899543 $900 to $9991,632 $1,000 to $1,2491,828 $1,250 to $1,4991,514 $1,500 to $1,999777 $2,000 to $2,499308 $2,500 to $2,999257 $3,000 to $3,49948 $3,500 or more215 No cash rent
Percentage of workers working in this county: 77.7%Number of people working at home: 11,150 (24.9% of all workers )
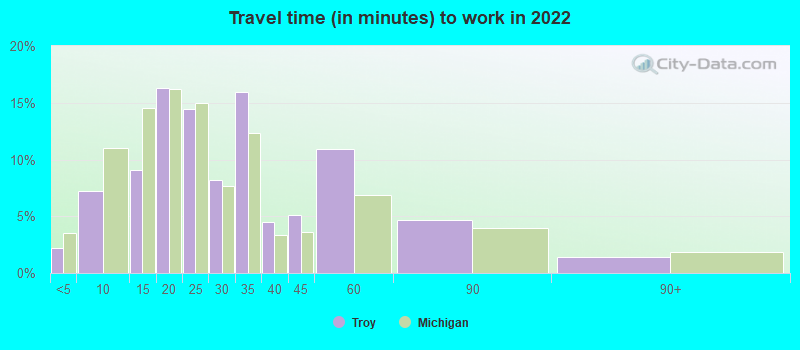
Travel time to work (commute)
Less than 5 minutes: 1,1755 to 9 minutes: 2,68810 to 14 minutes: 5,29415 to 19 minutes: 7,35620 to 24 minutes: 5,03025 to 29 minutes: 1,72730 to 34 minutes: 5,94235 to 39 minutes: 99240 to 44 minutes: 2,34845 to 59 minutes: 1,55960 to 89 minutes: 81190 or more minutes: 170
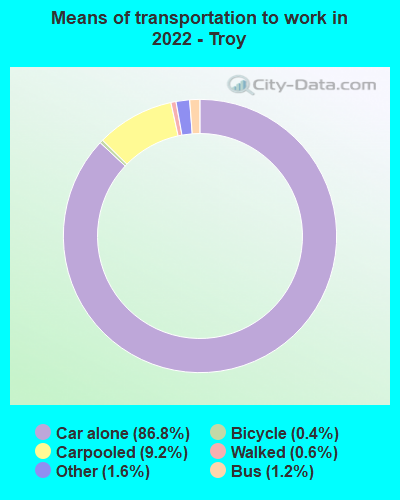
Means of transportation to work:
Drove a car alone: 70,207 (76.4%)Carpooled: 7,459 (8.1%)Bus : 1,006 (1.1%)Ferryboat: 62 (0.1%)Taxi: 1,285 (1.4%)Bicycle: 320 (0.3%)Walked: 519 (0.6%)Worked at home: 11,011 (12.0%)
Unemployment by race in 2022
Unemployment rate for White non-Hispanic residents 3.6% Males2.2% FemalesUnemployment rate for Black residents 2.9% Males8.2% FemalesUnemployment rate for American Indian and Alaska Native residents 14.7% Males38.4% FemalesUnemployment rate for Asian residents 0.6% Males2.5% FemalesUnemployment rate for other race residents 7.0% MalesUnemployment rate for two or more race residents 7.4% Males6.9% FemalesUnemployment rate for Hispanic or Latino residents 9.3% Males
Year of entry for the foreign-born population in Troy, Michigan
9,845 2010 or later 5,965 2000 to 2009 5,368 1990 to 1999 3,571 1980 to 1989 2,738 1970 to 1979 2,596 Before 1970
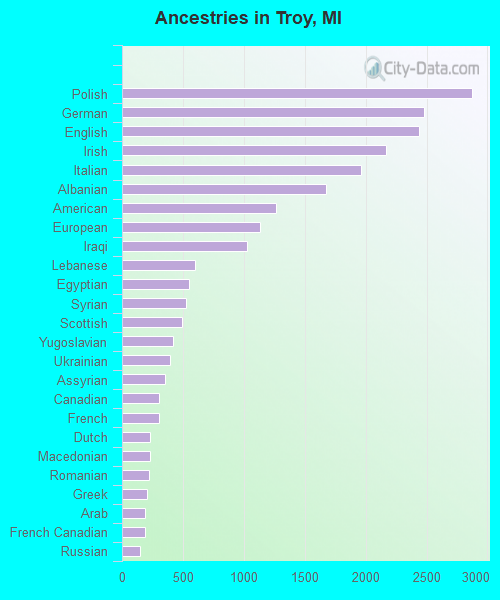
First ancestries reported:
Polish: 2,869 (6.0%)
German: 2,475 (5.1%)
English: 2,437 (5.1%)
Irish: 2,169 (4.5%)
Italian: 1,965 (4.1%)
Albanian: 1,676 (3.5%)
American: 1,265 (2.6%)
European: 1,131 (2.4%)
Iraqi: 1,024 (2.1%)
Lebanese: 598 (1.2%)
Egyptian: 551 (1.1%)
Syrian: 524 (1.1%)
Scottish: 491 (1.0%)
Yugoslavian: 417 (0.9%)
Ukrainian: 394 (0.8%)
Assyrian: 356 (0.7%)
Canadian: 307 (0.6%)
French: 302 (0.6%)
Dutch: 230 (0.5%)
Macedonian: 228 (0.5%)
Romanian: 219 (0.5%)
Greek: 209 (0.4%)
Arab: 191 (0.4%)
French Canadian: 186 (0.4%)
Russian: 149 (0.3%)
Soviet Union: 149 (0.3%)
Armenian: 137 (0.3%)
Hungarian: 134 (0.3%)
Liberian: 132 (0.3%)
Scotch-Irish: 113 (0.2%)
Belgian: 112 (0.2%)
Turkish: 104 (0.2%)
African: 98 (0.2%)
Eastern European: 94 (0.2%)
Brazilian: 93 (0.2%)
Serbian: 83 (0.2%)
Finnish: 83 (0.2%)
Swedish: 83 (0.2%)
Austrian: 75 (0.2%)
Iranian: 72 (0.1%)
Swiss: 72 (0.1%)
Norwegian: 61 (0.1%)
Jamaican: 58 (0.1%)
Lithuanian: 48 (0.10%)
Croatian: 46 (0.10%)
Barbadian: 46 (0.10%)
Slovak: 42 (0.09%)
British: 36 (0.07%)
Maltese: 34 (0.07%)
Danish: 29 (0.06%)
Welsh: 27 (0.06%)
Australian: 24 (0.05%)
Slovene: 24 (0.05%)
Jordanian: 22 (0.05%)
Palestinian: 21 (0.04%)
Cypriot: 21 (0.04%)
Scandinavian: 19 (0.04%)
Portuguese: 18 (0.04%)
Nigerian: 13 (0.03%)
Czechoslovakian: 10 (0.02%)
Bulgarian: 8 (0.02%)
Slavic: 6 (0.01%)
Czech: 4 (0.01%)
Northern European: 4 (0.01%)
Most common places of birth for foreign-born residents (%): India Troy:
34.7% (8,862)Michigan:
11.1% (77,240)
China, excluding Hong Kong and Taiwan Troy:
9.7% (2,476)Michigan:
4.9% (34,295)
Iraq Troy:
7.2% (1,847)Michigan:
8.1% (55,954)
Korea Troy:
5.6% (1,422)Michigan:
3.0% (20,884)
Albania Troy:
3.6% (922)Michigan:
1.9% (12,910)
Pakistan Troy:
3.5% (897)Michigan:
1.5% (10,596)
Canada Troy:
2.9% (737)Michigan:
5.0% (35,052)
Bangladesh Troy:
2.4% (603)Michigan:
2.6% (18,065)
Philippines Troy:
2.3% (591)Michigan:
2.8% (19,112)
Japan Troy:
2.1% (548)Michigan:
1.5% (10,225)
Mexico Troy:
2.0% (516)Michigan:
10.9% (75,965)
Egypt Troy:
1.5% (386)Michigan:
0.6% (3,827)
Place of birth for U.S.-born residents:
This state: 47,324Other state: 10,574Northeast: 3,206Midwest: 3,449South: 2,952West: 967 90.8% of Troy residents lived in the same house 1 years ago.
Out of people who lived in different houses, 31.9% lived in this county.
Out of people who lived in different counties, 71.7% lived in Michigan.
Troy:
90.8%State average:
88.4%
Education attainment for males 25 years and older:
No schooling: 255Nursery to 4th grade: 45th and 6th grade: 1787th and 8th grade: 1369th grade: 5010th grade: 21311th grade: 73912th grade, no diploma: 431High school graduate (or equivalency): 3,770Less than 1 year of college: 649Some college more than 1 year, no degree: 2,245Associate degree: 1,045Bachelor's degree: 9,625Master's degree: 7,531Professional school degree: 1,178Doctorate degree: 1,068
Education attainment for females 25 years and older:
No schooling: 209Nursery to 4th grade: 05th and 6th grade: 2947th and 8th grade: 1689th grade: 010th grade: 55211th grade: 3812th grade, no diploma: 236High school graduate (or equivalency): 4,052Less than 1 year of college: 1,301Some college more than 1 year, no degree: 2,931Associate degree: 1,925Bachelor's degree: 10,702Master's degree: 7,017Professional school degree: 757Doctorate degree: 1,116
Housing units in structures:
One, detached: 24,525One, attached: 2,505Two: 3503 or 4: 1,0025 to 9: 2,73310 to 19: 54420 to 49: 1,26450 or more: 1,226Mobile homes: 224Housing units lacking complete plumbing facilities in 2022: 0.5%Housing units lacking complete kitchen facilities in 2022: 0.3%House/condo owner moved in on average 14 years ago
Renter moved in on average 2 years ago
Private vs. public school enrollment:
Students in private schools in grades 1 to 8 (elementary and middle school): 1,081 Students in private schools in grades 9 to 12 (high school): 349 Students in private undergraduate colleges: 718