Versailles, KY (Kentucky) Houses and Residents
| Versailles: | $286,132 |
| Kentucky: | $196,300 |
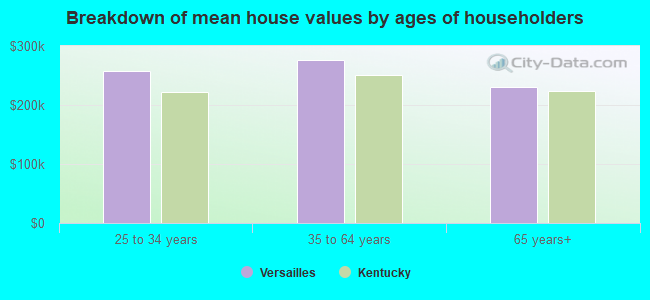
Mean price in 2022:
Detached houses: $278,201
Here: $278,201 State: $256,452 Townhouses or other attached units: $253,516
Here: $253,516 State: $264,090 Mobile homes: $36,992
Here: $36,992 State: $84,635
Total population: 9,054 (Urban population: 7,383 (all inside urban clusters), Rural population: 0)
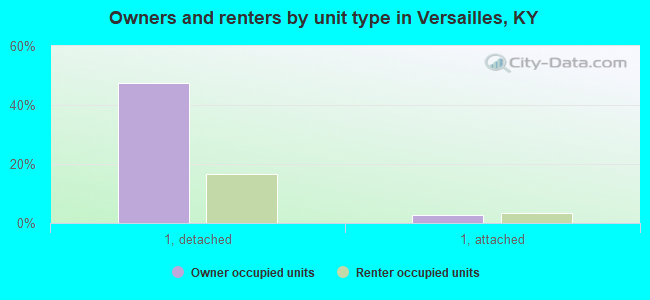
Houses: 4,790 (4,294 occupied: 2,562 owner occupied, 1,823 renter occupied)
| % of renters here: | 42% |
| State: | 31% |
Housing density: 1,702 houses/condos per square mile
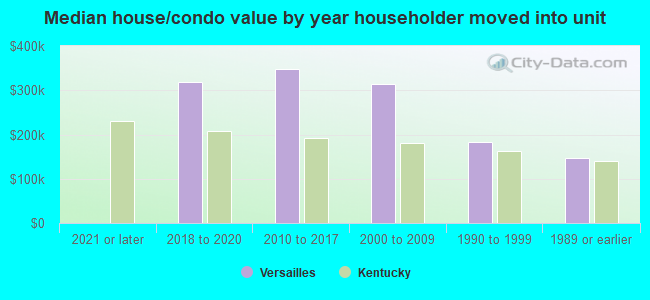
Median price asked for vacant for-sale houses and condos in 2022: $316,702.
Median contract rent in 2022: $727 (lower quartile is $582, upper quartile is $952)
Median rent asked for vacant for-rent units in 2022: $953
Median gross rent in Versailles, KY in 2022: $923
Housing units in Versailles with a mortgage: 1,378 (240 second mortgage, 0 home equity loan, 225 both second mortgage and home equity loan)
Houses without a mortgage: 96
Median household income for houses/condos with a mortgage: $76,402
Median household income for apartments without a mortgage: $75,869
Median monthly housing costs: $888
Compare current foreclosures near Versailles, KY:
| Photo | Address | Area | Beds / Baths | Price | Details |
|---|---|---|---|---|---|

|
#1
Nancy St
Versailles, KY 40383
|
1,080 sq. feet
|
1 baths 3 beds |
show details | |

|
#2
Mcdonald Dr
Versailles, KY 40383
|
1,107 sq. feet
|
1 baths 3 beds |
show details | |

|
#3
Linden St
Versailles, KY 40383
|
1,161 sq. feet
|
1 baths 3 beds |
show details | |

|
#4
Bryanwood St
Versailles, KY 40383
|
1,050 sq. feet
|
1 baths 3 beds |
show details | |

|
#5
Martin Luther King Jr Blvd
Versailles, KY 40383
|
1,085 sq. feet
|
1 baths 3 beds |
show details | |

|
#6
Tincher Dr
Versailles, KY 40383
|
1,452 sq. feet
|
2 baths 3 beds |
show details | |

|
#7
Gormley Dr
Versailles, KY 40383
|
1,864 sq. feet
|
3 baths 4 beds |
show details | |

|
#8
Maple Ave
Versailles, KY 40383
|
1,100 sq. feet
|
2 baths 3 beds |
show details | |

|
#9
Eureka Dr
Versailles, KY 40383
|
2,370 sq. feet
|
3 baths 4 beds |
show details | |

|
#10
Hanover Dr
Versailles, KY 40383
|
2,458 sq. feet
|
2 baths 4 beds |
show details |
| Photo | Address | Area | Beds / Baths | Price | Details |
|---|---|---|---|---|---|

|
#11
Kingsway Dr
Versailles, KY 40383
|
1,300 sq. feet
|
1 baths 3 beds |
show details | |

|
#12
Macey Ave
Versailles, KY 40383
|
1,768 sq. feet
|
1 baths 3 beds |
show details | |

|
#13
Nancy St
Versailles, KY 40383
|
1,066 sq. feet
|
1 baths 3 beds |
show details | |

|
#14
Buck Run Rd
Versailles, KY 40383
|
2,034 sq. feet
|
2 baths 3 beds |
show details | |

|
#15
Blue Spruce Ct
Versailles, KY 40383
|
1,579 sq. feet
|
2 baths 3 beds |
show details | |

|
#16
Duell Dr
Versailles, KY 40383
|
1,364 sq. feet
|
1 baths 3 beds |
show details | |

|
#17
Elm St
Versailles, KY 40383
|
4,770 sq. feet
|
2 baths 3 beds |
show details | |

|
#18
Shetland Rd
Versailles, KY 40383
|
1,597 sq. feet
|
2 baths 3 beds |
show details | |

|
#19
Dunroven Rd
Versailles, KY 40383
|
1,161 sq. feet
|
1 baths 4 beds |
show details | |

|
#20
Abbey Rd
Versailles, KY 40383
|
- sq. feet
|
- baths - beds |
show details |
| Photo | Address | Area | Beds / Baths | Price | Details |
|---|---|---|---|---|---|

|
#21
Rose Hill Ave # B
Versailles, KY 40383
|
- sq. feet
|
- baths - beds |
show details | |

|
#22
Angell Ave
Versailles, KY 40383
|
- sq. feet
|
- baths - beds |
show details | |

|
#23
Ashmore St
Versailles, KY 40383
|
801 sq. feet
|
- baths - beds |
show details | |

|
#24
Linden St
Versailles, KY 40383
|
- sq. feet
|
- baths - beds |
show details | |

|
#25
Bayberry Rd
Versailles, KY 40383
|
- sq. feet
|
- baths - beds |
show details | |

|
#26
Duchess Ct
Versailles, KY 40383
|
- sq. feet
|
- baths - beds |
show details | |

|
#27
Eleanor Rigby Pl
Versailles, KY 40383
|
- sq. feet
|
- baths - beds |
show details | |

|
#28
Hillcrest Dr
Versailles, KY 40383
|
- sq. feet
|
- baths - beds |
show details | |

|
#29
Brookfield Dr
Frankfort, KY 40601
|
1,000 sq. feet
|
1 baths 3 beds |
$190,000
|
show details |

|
#30
Cottage St
Nicholasville, KY 40356
|
1 sq. feet
|
1 baths 1 beds |
$62,500
|
show details |
| Photo | Address | Area | Beds / Baths | Price | Details |
|---|---|---|---|---|---|

|
#31
Powhatan Trl
Versailles, KY 40383
|
- sq. feet
|
- baths - beds |
show details | |

|
#32
Redcoach Trl Apt A
Lexington, KY 40517
|
1,332 sq. feet
|
2 baths 3 beds |
show details | |

|
#33
Bracken Ct
Frankfort, KY 40601
|
2,913 sq. feet
|
3 baths 4 beds |
show details | |

|
#34
Lackawanna Rd
Lexington, KY 40503
|
1,609 sq. feet
|
1 baths 3 beds |
show details | |

|
#35
Brewer Dr
Lexington, KY 40505
|
1,247 sq. feet
|
2 baths 3 beds |
show details | |

|
#36
Lochdale Ter
Lexington, KY 40514
|
504 sq. feet
|
2 baths 2 beds |
show details | |

|
#37
Wichita Dr
Nicholasville, KY 40356
|
1,435 sq. feet
|
2 baths 3 beds |
show details | |

|
#38
Parterre Pl
Lexington, KY 40504
|
1,453 sq. feet
|
2 baths 2 beds |
show details | |

|
#39
Beacon Hill Rd
Lexington, KY 40504
|
1,402 sq. feet
|
2 baths 3 beds |
show details | |

|
#40
E Short St Unit 320
Lexington, KY 40507
|
801 sq. feet
|
1 baths 1 beds |
show details |
| Photo | Address | Area | Beds / Baths | Price | Details |
|---|---|---|---|---|---|

|
#41
Bear Creek Rd
Lawrenceburg, KY 40342
|
2,025 sq. feet
|
2 baths 3 beds |
show details | |

|
#42
Alexandria Dr
Lexington, KY 40504
|
1,377 sq. feet
|
2 baths 3 beds |
show details | |

|
#43
Rockbridge Rd
Lexington, KY 40515
|
1,562 sq. feet
|
3 baths 4 beds |
show details | |

|
#44
Evergreen Rd
Frankfort, KY 40601
|
2,696 sq. feet
|
2 baths 5 beds |
show details | |

|
#45
Lisa Ct
Lexington, KY 40505
|
975 sq. feet
|
1 baths 3 beds |
show details | |

|
#46
Lochdale Ter
Lexington, KY 40514
|
546 sq. feet
|
2 baths 2 beds |
show details | |

|
#47
Tanforan Ct
Lexington, KY 40517
|
1,463 sq. feet
|
3 baths 3 beds |
show details | |

|
#48
Zandale Dr
Lexington, KY 40502
|
1,620 sq. feet
|
3 baths 3 beds |
show details | |

|
#49
Strader Dr
Lexington, KY 40505
|
1,201 sq. feet
|
1 baths 2 beds |
show details | |

|
Check over 1 million property listings on Foreclosure.com!
|
browse all offers | |||

Latest news about housing in Versailles, KY collected exclusively by city-data.com from local newspapers, TV, and radio stations

 | Frankfort or Versailles? (6 replies) |
| House on Bennett Ave and Versailles Rd (14 replies) |
| Apartments in Versailles or Frankfort (0 replies) |
| Moving Back...Looking to rent a 1800+ Sq Ft home in the Versailles Rd, Harrodsburg Rd Corridor (4 replies) |
| Local economy (7 replies) |
| Apartments between Harrodsburg & Versailles (9 replies) |

Median year apartment built: 1979
Household type by relationship:
Households: 10,318- Male householders: 1,985 (598 living alone), Female householders: 2,266 (633 living alone)
1,714 spouses (1,699 opposite-sex spouses), 190 unmarried partners, (179 opposite-sex unmarried partners), 3,101 children (2,753 natural, 147 adopted, 200 stepchildren), 279 grandchildren, 158 brothers or sisters, 53 parents, 0 foster children, 119 other relatives, 359 non-relatives
- In group quarters: 90
Size of family households: 1,451 2-persons, 695 3-persons, 411 4-persons, 65 5-persons, 76 6-persons, 119 7-or-more-persons.
Size of nonfamily households: 1,298 1-person, 271 2-persons.
1,322 married couples with children.
795 single-parent households (64 men, 731 women).
90.6% of residents of Versailles speak English at home.
7.7% of residents speak Spanish at home (35% speak English very well, 12% speak English well, 49% speak English not well, 5% don't speak English at all).
0.8% of residents speak other Indo-European language at home (97% speak English very well, 3% speak English not well).
0.7% of residents speak other language at home (100% speak English very well).
Foreign born population: 670 (6.5%)
(14.8% of them are naturalized citizens)
| Here: | 6.4 |
| State: | 6.4 |
| Here: | 4.6 |
| State: | 4.4 |
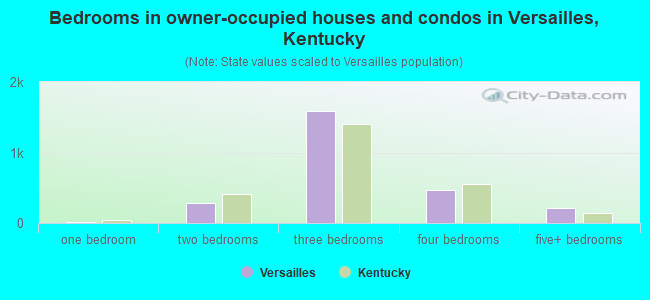
- Bedrooms in owner-occupied houses and condos in Versailles, Kentucky
- 0no bedroom
- 171 bedroom
- 2802 bedrooms
- 1,5883 bedrooms
- 4704 bedrooms
- 2085+ bedrooms
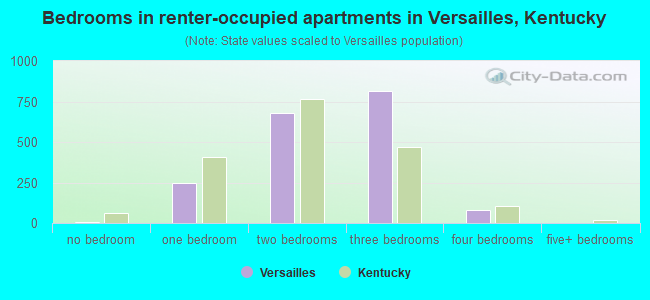
- Bedrooms in renter-occupied apartments in Versailles, Kentucky
- 6no bedroom
- 2481 bedroom
- 6782 bedrooms
- 8143 bedrooms
- 784 bedrooms
- 05+ bedrooms
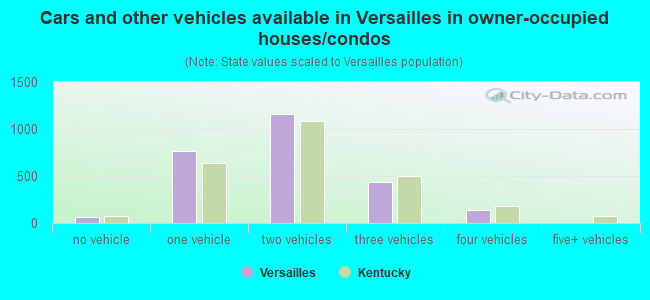
- Cars and other vehicles available in Versailles in owner-occupied houses/condos
- 66no vehicle
- 7641 vehicle
- 1,1622 vehicles
- 4373 vehicles
- 1334 vehicles
- 05+ vehicles
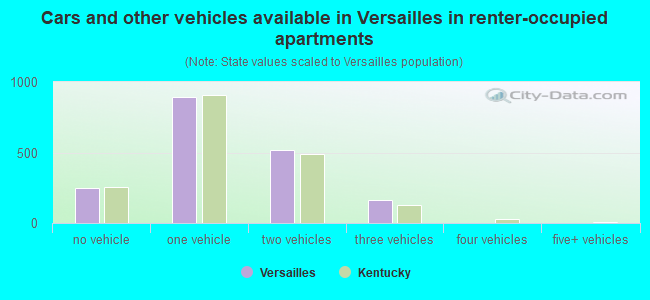
- Cars and other vehicles available in Versailles in renter-occupied apartments
- 248no vehicle
- 8921 vehicle
- 5192 vehicles
- 1643 vehicles
- 04 vehicles
- 05+ vehicles
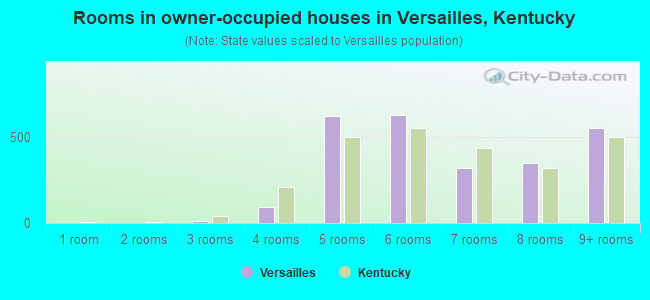
- Rooms in owner-occupied houses in Versailles, Kentucky
- 01 room
- 02 rooms
- 93 rooms
- 914 rooms
- 6215 rooms
- 6266 rooms
- 3217 rooms
- 3458 rooms
- 5489+ rooms
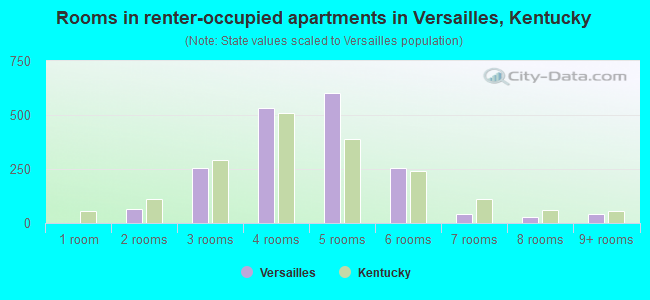
- Rooms in renter-occupied apartments in Versailles, Kentucky
- 01 room
- 672 rooms
- 2543 rooms
- 5324 rooms
- 6035 rooms
- 2556 rooms
- 427 rooms
- 278 rooms
- 429+ rooms
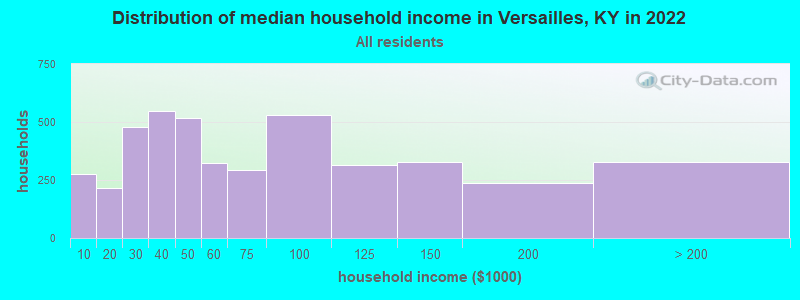
Versailles, KY household income distribution

- 277Less than $10,000
- 217$10,000 to $19,999
- 480$20,000 to $29,999
- 548$30,000 to $39,999
- 517$40,000 to $49,999
- 322$50,000 to $59,999
- 291$60,000 to $74,999
- 532$75,000 to $99,999
- 315$100,000 to $124,999
- 326$125,000 to $149,999
- 235$150,000 to $199,999
- 328$200,000 or more
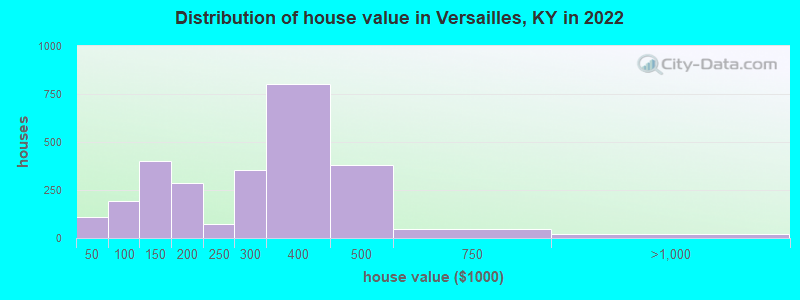
Home value of owner - occupied houses in 2022 in Versailles, KY
-
- 41Less than $10,000
- 15$20,000 to $24,999
- 22$25,000 to $29,999
- 8$30,000 to $34,999
- 17$35,000 to $39,999
- 5$40,000 to $49,999
- 75$50,000 to $59,999
- 36$70,000 to $79,999
- 12$80,000 to $89,999
- 64$90,000 to $99,999
- 116$100,000 to $124,999
- 282$125,000 to $149,999
- 236$150,000 to $174,999
- 50$175,000 to $199,999
- 71$200,000 to $249,999
- 353$250,000 to $299,999
- 804$300,000 to $399,999
- 381$400,000 to $499,999
- 48$500,000 to $749,999
- 22$750,000 to $999,999
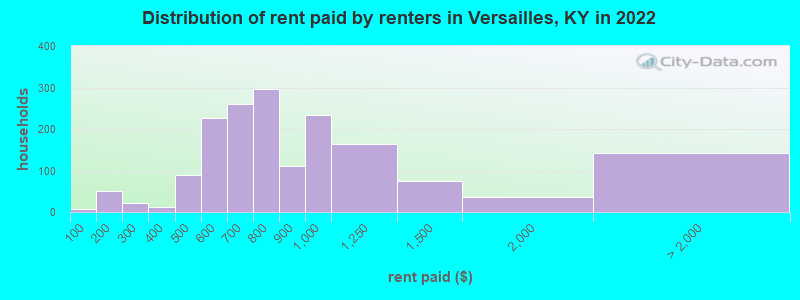
Rent paid by renters in 2022 in Versailles, KY
-
- 7Less than $100
- 17$100 to $149
- 32$150 to $199
- 21$200 to $249
- 11$300 to $349
- 15$400 to $449
- 72$450 to $499
- 69$500 to $549
- 156$550 to $599
- 137$600 to $649
- 122$650 to $699
- 182$700 to $749
- 114$750 to $799
- 112$800 to $899
- 232$900 to $999
- 164$1,000 to $1,249
- 75$1,250 to $1,499
- 35$1,500 to $1,999
- 12$2,500 to $2,999
- 129No cash rent
Percentage of workers working in this county: 54.0%
Number of people working at home: 578 (10.4% of all workers)
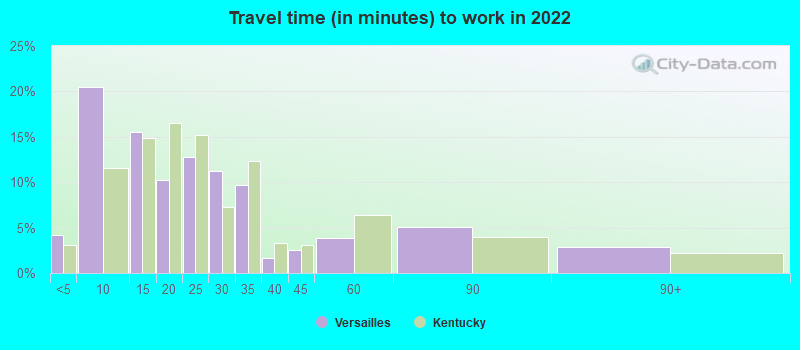
Travel time to work (commute)
- Less than 5 minutes: 241
- 5 to 9 minutes: 955
- 10 to 14 minutes: 657
- 15 to 19 minutes: 654
- 20 to 24 minutes: 503
- 25 to 29 minutes: 420
- 30 to 34 minutes: 691
- 35 to 39 minutes: 278
- 40 to 44 minutes: 127
- 45 to 59 minutes: 131
- 60 to 89 minutes: 40
- 90 or more minutes: 295
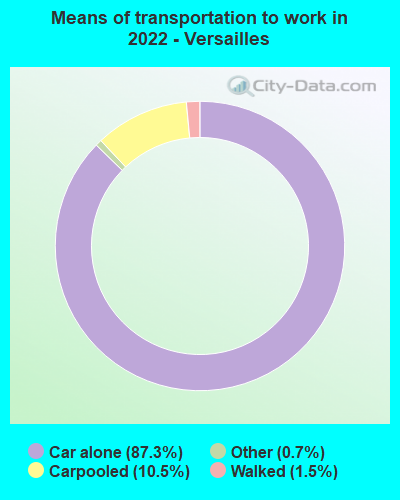
Means of transportation to work:
- Drove a car alone: 5,323 (78.6%)
- Carpooled: 704 (10.4%)
- Taxi: 53 (0.8%)
- Walked: 94 (1.4%)
- Worked at home: 578 (8.5%)
- Unemployment by race in 2022
- Unemployment rate for White non-Hispanic residents
- 1.9%Males
- 1.5%Females
- Unemployment rate for Black residents
- 0.6%Females
- Unemployment rate for two or more race residents
- 30.8%Males
- 38.8%Females
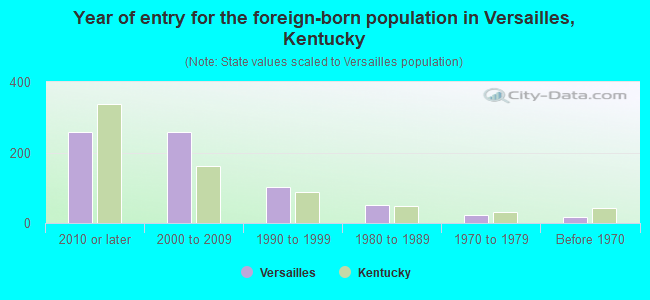
- Year of entry for the foreign-born population in Versailles, Kentucky
- 2582010 or later
- 2582000 to 2009
- 1021990 to 1999
- 511980 to 1989
- 231970 to 1979
- 17Before 1970
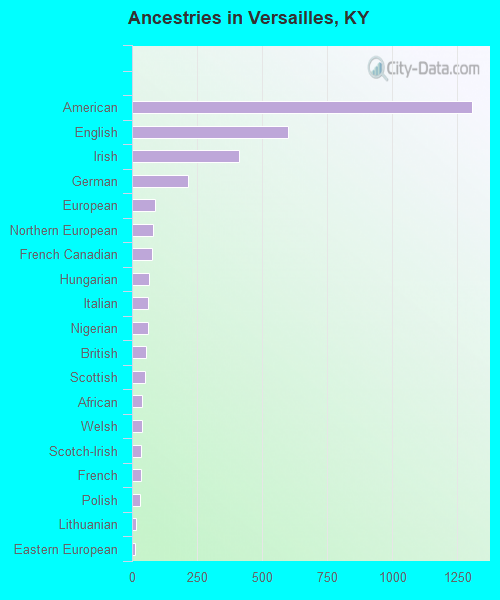
First ancestries reported:
- American: 1,306 (24.2%)
- English: 598 (11.1%)
- Irish: 412 (7.6%)
- German: 215 (4.0%)
- European: 88 (1.6%)
- Northern European: 82 (1.5%)
- French Canadian: 75 (1.4%)
- Hungarian: 64 (1.2%)
- Italian: 62 (1.2%)
- Nigerian: 62 (1.2%)
- British: 53 (1.0%)
- Scottish: 49 (0.9%)
- African: 40 (0.7%)
- Welsh: 37 (0.7%)
- Scotch-Irish: 36 (0.7%)
- French: 35 (0.6%)
- Polish: 30 (0.6%)
- Lithuanian: 15 (0.3%)
- Eastern European: 12 (0.2%)
- Russian: 6 (0.1%)
- Slovene: 5 (0.09%)
- Greek: 4 (0.07%)
Most common places of birth for foreign-born residents (%):
| Versailles: | 78.7% (547) |
| Kentucky: | 15.8% (29,070) |
| Versailles: | 4.7% (33) |
| Kentucky: | 2.5% (4,639) |
| Versailles: | 3.7% (26) |
| Kentucky: | 0.4% (800) |
| Versailles: | 2.3% (16) |
| Kentucky: | 1.9% (3,585) |
| Versailles: | 1.7% (12) |
| Kentucky: | 0.1% (271) |
| Versailles: | 1.7% (12) |
| Kentucky: | 0.9% (1,652) |
Place of birth for U.S.-born residents:
- This state: 6,983
- Other state: 2,571
- Northeast: 434
- Midwest: 1,008
- South: 866
- West: 273
86.0% of Versailles residents lived in the same house 1 years ago.
Out of people who lived in different houses, 37.2% lived in this county.
Out of people who lived in different counties, 86.8% lived in Kentucky.
| Versailles: | 86.0% |
| State average: | 87.2% |
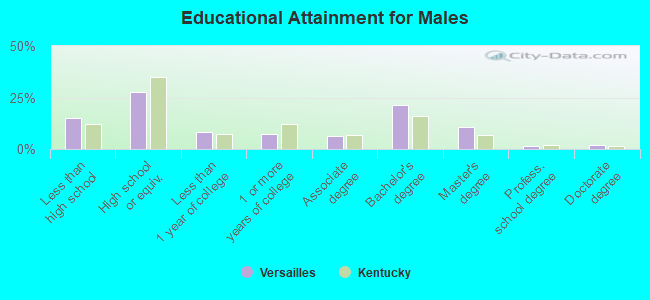
Education attainment for males 25 years and older:
- No schooling: 0
- Nursery to 4th grade: 67
- 5th and 6th grade: 13
- 7th and 8th grade: 34
- 9th grade: 84
- 10th grade: 162
- 11th grade: 116
- 12th grade, no diploma: 57
- High school graduate (or equivalency): 971
- Less than 1 year of college: 285
- Some college more than 1 year, no degree: 261
- Associate degree: 217
- Bachelor's degree: 743
- Master's degree: 380
- Professional school degree: 50
- Doctorate degree: 64
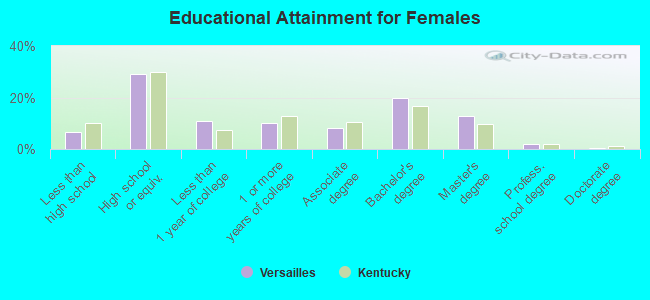
Education attainment for females 25 years and older:
- No schooling: 21
- Nursery to 4th grade: 0
- 5th and 6th grade: 31
- 7th and 8th grade: 43
- 9th grade: 26
- 10th grade: 47
- 11th grade: 32
- 12th grade, no diploma: 38
- High school graduate (or equivalency): 1,023
- Less than 1 year of college: 381
- Some college more than 1 year, no degree: 348
- Associate degree: 287
- Bachelor's degree: 691
- Master's degree: 448
- Professional school degree: 72
- Doctorate degree: 20


Housing units in structures:
- One, detached: 3,130
- One, attached: 434
- Two: 257
- 3 or 4: 466
- 5 to 9: 166
- 10 to 19: 133
- 20 to 49: 83
- 50 or more: 19
- Mobile homes: 100
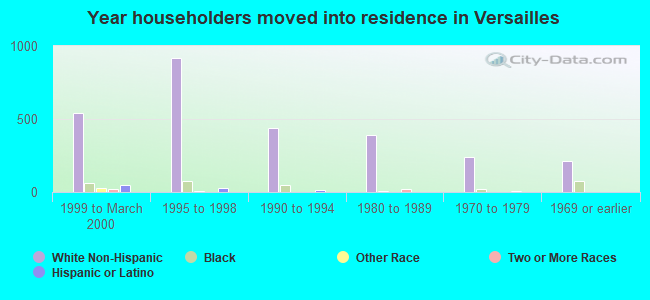
House/condo owner moved in on average 11 years ago
Renter moved in on average 4 years ago
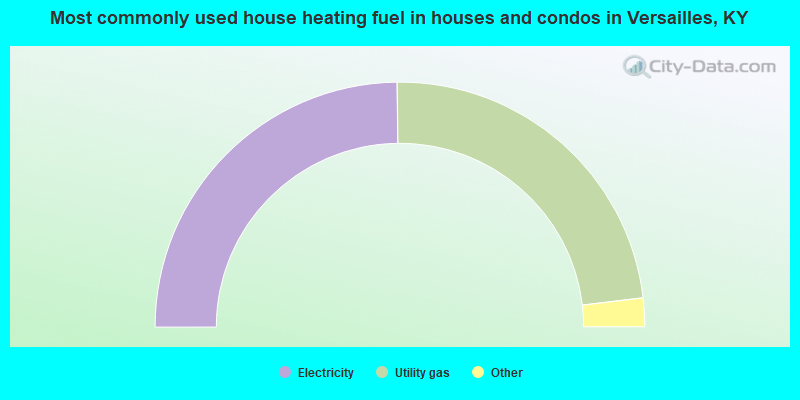
- 49.7%Electricity
- 46.6%Utility gas
- 3.2%Bottled, tank, or LP gas
- 0.4%Wood
- 0.2%Other fuel
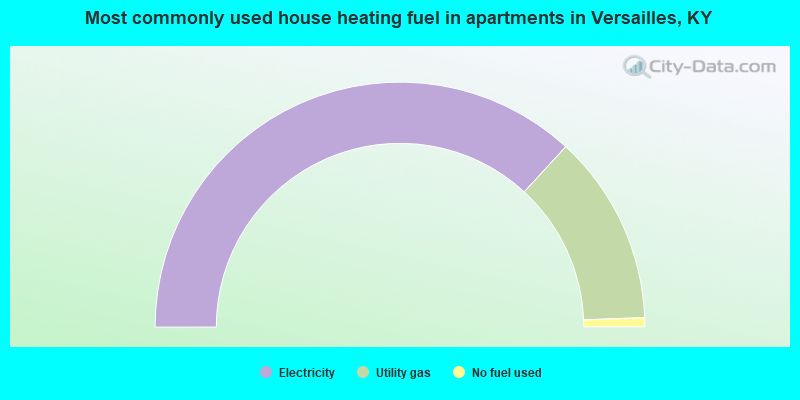
- 73.6%Electricity
- 25.1%Utility gas
- 1.2%No fuel used
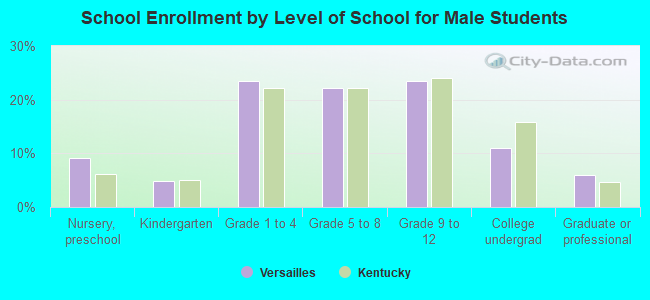
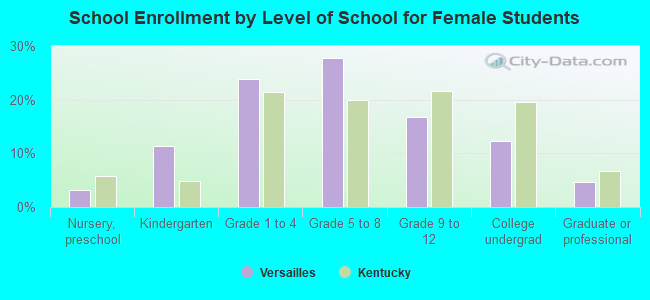
Private vs. public school enrollment:
| Here: | 9.1% |
| Kentucky: | 17.2% |
| Here: | 5.3% |
| Kentucky: | 15.2% |
| Here: | 8.1% |
| Kentucky: | 19.6% |