Vidalia, GA (Georgia) Houses and Residents
| Vidalia: | $177,908 |
| Georgia: | $297,400 |
Total population: 10,670 (Urban population: 9,239 (all inside urban clusters), Rural population: 1,367 (39 farm, 1,328 nonfarm))
Houses: 4,771 (4,055 occupied: 2,199 owner occupied, 1,901 renter occupied)
| % of renters here: | 46% |
| State: | 34% |
Housing density: 275 houses/condos per square mile
Median price asked for vacant for-sale houses and condos in 2022 in this county: $904,229.
Median contract rent in 2022: $519 (lower quartile is $321, upper quartile is $703)
Median rent asked for vacant for-rent units in 2022: $561
Median gross rent in Vidalia, GA in 2022: $666
Housing units in Vidalia with a mortgage: 1,271 (74 second mortgage, 0 home equity loan, 27 both second mortgage and home equity loan)
Houses without a mortgage: 96
Median household income for houses/condos with a mortgage: $69,694
Median household income for apartments without a mortgage: $68,384
Median monthly housing costs: $725
Compare current foreclosures near Vidalia, GA:
| Photo | Address | Area | Beds / Baths | Price | Details |
|---|---|---|---|---|---|

|
#1
Pheasant Dr
Vidalia, GA 30474
|
1,862 sq. feet
|
2 baths 3 beds |
show details | |

|
#2
Jane Dr
Vidalia, GA 30474
|
924 sq. feet
|
1 baths 3 beds |
show details | |

|
#3
Dixon Lake Cir
Vidalia, GA 30474
|
2,549 sq. feet
|
2 baths - beds |
show details | |

|
#4
Southland Dr
Vidalia, GA 30474
|
2,128 sq. feet
|
2 baths 4 beds |
show details | |

|
#5
Cadillac Dr
Vidalia, GA 30474
|
1,306 sq. feet
|
1 baths - beds |
show details | |

|
#6
Schumpert St
Vidalia, GA 30474
|
912 sq. feet
|
1 baths - beds |
show details | |

|
#7
Lent Stephens Rd
Vidalia, GA 30474
|
3,814 sq. feet
|
2 baths - beds |
show details | |

|
#8
Madison St
Vidalia, GA 30474
|
1,155 sq. feet
|
2 baths - beds |
show details | |

|
#9
Rimando Cir
Vidalia, GA 30474
|
1,700 sq. feet
|
2 baths - beds |
show details | |

|
#10
Green St
Vidalia, GA 30474
|
1,582 sq. feet
|
1 baths - beds |
show details |
| Photo | Address | Area | Beds / Baths | Price | Details |
|---|---|---|---|---|---|

|
#11
S Smalley Dr
Vidalia, GA 30474
|
1,112 sq. feet
|
1 baths - beds |
show details | |

|
#12
Charles Dr
Vidalia, GA 30474
|
2,428 sq. feet
|
2 baths - beds |
show details | |

|
#13
Scott Dr
Vidalia, GA 30474
|
- sq. feet
|
- baths - beds |
show details | |

|
#14
Green Willow Dr
Vidalia, GA 30474
|
- sq. feet
|
- baths - beds |
show details | |

|
#15
Old Oconee Rd
Vidalia, GA 30474
|
- sq. feet
|
- baths - beds |
show details | |

|
#16
Loop Rd Apt 3b
Vidalia, GA 30474
|
- sq. feet
|
- baths - beds |
show details | |

|
#17
Agan Dr Apt 3201
Vidalia, GA 30474
|
- sq. feet
|
- baths - beds |
show details | |

|
#18
Timberloch Dr
Vidalia, GA 30474
|
- sq. feet
|
- baths - beds |
show details | |

|
#19
Aimwell Rd
Vidalia, GA 30474
|
- sq. feet
|
- baths - beds |
show details | |

|
#20
Kenworth St
Vidalia, GA 30474
|
- sq. feet
|
- baths - beds |
show details |
| Photo | Address | Area | Beds / Baths | Price | Details |
|---|---|---|---|---|---|

|
#21
North St E
Vidalia, GA 30474
|
- sq. feet
|
- baths - beds |
show details | |

|
#22
Hutcheson Ln # 3
Vidalia, GA 30474
|
- sq. feet
|
- baths - beds |
show details | |

|
#23
Maple Dr # A
Vidalia, GA 30474
|
- sq. feet
|
- baths - beds |
show details | |

|
#24
Randolph Dr Apt 7d
Vidalia, GA 30474
|
- sq. feet
|
- baths - beds |
show details | |

|
#25
E Sadie St
Mount Vernon, GA 30445
|
2,112 sq. feet
|
2 baths 3 beds |
show details | |

|
#26
N Fifth St
Glenwood, GA 30428
|
1,428 sq. feet
|
1 baths - beds |
show details | |

|
#27
Wells St
Soperton, GA 30457
|
1,664 sq. feet
|
2 baths 3 beds |
show details | |

|
#28
Miller Pond Rd
Soperton, GA 30457
|
1,527 sq. feet
|
1 baths - beds |
show details | |

|
#29
John Jarriel Rd
Collins, GA 30421
|
3,050 sq. feet
|
2 baths - beds |
show details | |

|
#30
Mill Creek Rd
Lyons, GA 30436
|
1,970 sq. feet
|
2 baths - beds |
show details |
| Photo | Address | Area | Beds / Baths | Price | Details |
|---|---|---|---|---|---|

|
#31
Mason St
Mount Vernon, GA 30445
|
1,781 sq. feet
|
2 baths - beds |
show details | |

|
#32
Kermit Mann Rd
Lyons, GA 30436
|
2,240 sq. feet
|
2 baths - beds |
show details | |

|
#33
Jimmy Phillips Rd
Cobbtown, GA 30420
|
2,286 sq. feet
|
2 baths - beds |
show details | |

|
#34
S Victory Dr
Lyons, GA 30436
|
2,010 sq. feet
|
1 baths - beds |
show details | |

|
#35
N Gwinnett St
Lyons, GA 30436
|
1,417 sq. feet
|
2 baths - beds |
show details | |

|
#36
Weed Holland Rd
Cobbtown, GA 30420
|
2,096 sq. feet
|
2 baths - beds |
show details | |

|
#37
Myrtle St
Uvalda, GA 30473
|
1,656 sq. feet
|
2 baths - beds |
show details | |

|
#38
N Jefferson St
Lyons, GA 30436
|
1,892 sq. feet
|
2 baths - beds |
show details | |

|
#39
Bell Ave
Soperton, GA 30457
|
- sq. feet
|
- baths - beds |
show details | |

|
#40
Big Bobby Rd
Twin City, GA 30471
|
- sq. feet
|
- baths - beds |
show details |
| Photo | Address | Area | Beds / Baths | Price | Details |
|---|---|---|---|---|---|

|
#41
Holland Pl # A
Soperton, GA 30457
|
- sq. feet
|
- baths - beds |
show details | |

|
#42
Ga-19 S
Glenwood, GA 30428
|
- sq. feet
|
- baths - beds |
show details | |

|
#43
Ernest Webber Rd
Lyons, GA 30436
|
- sq. feet
|
2 baths - beds |
show details | |

|
#44
Kelly St
Soperton, GA 30457
|
- sq. feet
|
- baths - beds |
show details | |

|
#45
Martin Luther King Jr Dr
Soperton, GA 30457
|
- sq. feet
|
- baths - beds |
show details | |

|
#46
SW Third Street
Glenwood, GA 30428
|
- sq. feet
|
- baths - beds |
show details | |

|
#47
Charlotteville Rd
Uvalda, GA 30473
|
- sq. feet
|
- baths - beds |
show details | |

|
#48
Sycamore Dr Apt A
Soperton, GA 30457
|
- sq. feet
|
- baths - beds |
show details | |

|
#49
Holton Chapel Rd
Soperton, GA 30457
|
- sq. feet
|
- baths - beds |
show details | |

|
Check over 1 million property listings on Foreclosure.com!
|
browse all offers | |||

Latest news about housing in Vidalia, GA collected exclusively by city-data.com from local newspapers, TV, and radio stations

 | Microsoft expansion (306 replies) |
| Could use some advice on relocating to Atlanta (98 replies) |
| Governor Brian Kemp (309 replies) |
| Looking to retire in Georgia (20 replies) |
| Columbus area population grows. (32 replies) |
| How would you rank Georgia's top 5 downtowns in the next 10 years? (143 replies) |

Median year apartment built: 1977
Household type by relationship:
Households: 10,922- Male householders: 1,395 (366 living alone), Female householders: 2,629 (1,007 living alone)
1,503 spouses (1,503 opposite-sex spouses), 130 unmarried partners, (130 opposite-sex unmarried partners), 3,400 children (3,241 natural, 50 adopted, 107 stepchildren), 818 grandchildren, 170 brothers or sisters, 35 parents, 0 foster children, 215 other relatives, 364 non-relatives
- In group quarters: 258
Size of family households: 1,211 2-persons, 595 3-persons, 404 4-persons, 222 5-persons, 51 6-persons, 86 7-or-more-persons.
Size of nonfamily households: 1,378 1-person, 78 2-persons, 24 3-persons, 39 4-persons.
1,015 married couples with children.
808 single-parent households (196 men, 612 women).
93.1% of residents of Vidalia speak English at home.
3.6% of residents speak Spanish at home (65% speak English very well, 20% speak English well, 14% speak English not well, 2% don't speak English at all).
1.9% of residents speak other Indo-European language at home (38% speak English very well, 15% speak English well, 29% speak English not well, 19% don't speak English at all).
1.2% of residents speak Asian or Pacific Island language at home (30% speak English very well, 3% speak English well, 46% speak English not well, 21% don't speak English at all).
Foreign born population: 466 (4.3%)
(28.1% of them are naturalized citizens)
| Here: | 7.0 |
| State: | 6.8 |
| Here: | 4.8 |
| State: | 4.6 |

- Bedrooms in owner-occupied houses and condos in Vidalia, Georgia
- 0no bedroom
- 101 bedroom
- 1362 bedrooms
- 1,2623 bedrooms
- 6754 bedrooms
- 1165+ bedrooms

- Bedrooms in renter-occupied apartments in Vidalia, Georgia
- 94no bedroom
- 2341 bedroom
- 7872 bedrooms
- 6823 bedrooms
- 1044 bedrooms
- 05+ bedrooms

- Cars and other vehicles available in Vidalia in owner-occupied houses/condos
- 28no vehicle
- 5781 vehicle
- 8072 vehicles
- 4433 vehicles
- 2284 vehicles
- 1165+ vehicles

- Cars and other vehicles available in Vidalia in renter-occupied apartments
- 373no vehicle
- 1,0391 vehicle
- 3792 vehicles
- 993 vehicles
- 124 vehicles
- 05+ vehicles

- Rooms in owner-occupied houses in Vidalia, Georgia
- 01 room
- 02 rooms
- 283 rooms
- 1384 rooms
- 2465 rooms
- 4876 rooms
- 3817 rooms
- 2488 rooms
- 6729+ rooms

- Rooms in renter-occupied apartments in Vidalia, Georgia
- 941 room
- 502 rooms
- 2843 rooms
- 3964 rooms
- 3745 rooms
- 3236 rooms
- 1937 rooms
- 1338 rooms
- 559+ rooms


Vidalia, GA household income distribution

- 459Less than $10,000
- 585$10,000 to $19,999
- 403$20,000 to $29,999
- 271$30,000 to $39,999
- 329$40,000 to $49,999
- 325$50,000 to $59,999
- 485$60,000 to $74,999
- 230$75,000 to $99,999
- 365$100,000 to $124,999
- 216$125,000 to $149,999
- 194$150,000 to $199,999
- 211$200,000 or more
Home value of owner - occupied houses in 2022 in Vidalia, GA
-
- 40Less than $10,000
- 14$15,000 to $19,999
- 12$20,000 to $24,999
- 88$40,000 to $49,999
- 23$50,000 to $59,999
- 48$70,000 to $79,999
- 81$80,000 to $89,999
- 28$90,000 to $99,999
- 264$100,000 to $124,999
- 234$125,000 to $149,999
- 170$150,000 to $174,999
- 62$175,000 to $199,999
- 168$200,000 to $249,999
- 305$250,000 to $299,999
- 184$300,000 to $399,999
- 79$400,000 to $499,999
- 52$500,000 to $749,999
Rent paid by renters in 2022 in Vidalia, GA
-
- 120Less than $100
- 62$100 to $149
- 81$150 to $199
- 53$200 to $249
- 39$250 to $299
- 180$300 to $349
- 68$350 to $399
- 27$400 to $449
- 234$450 to $499
- 173$500 to $549
- 56$550 to $599
- 144$600 to $649
- 53$650 to $699
- 84$700 to $749
- 108$750 to $799
- 29$800 to $899
- 51$900 to $999
- 71$1,000 to $1,249
- 11$1,500 to $1,999
- 97No cash rent

Percentage of workers working in this county: 74.6%
Number of people working at home: 173 (4.2% of all workers)
Travel time to work (commute)
- Less than 5 minutes: 188
- 5 to 9 minutes: 712
- 10 to 14 minutes: 819
- 15 to 19 minutes: 718
- 20 to 24 minutes: 38
- 25 to 29 minutes: 149
- 30 to 34 minutes: 224
- 35 to 39 minutes: 0
- 40 to 44 minutes: 76
- 45 to 59 minutes: 606
- 60 to 89 minutes: 78
- 90 or more minutes: 202
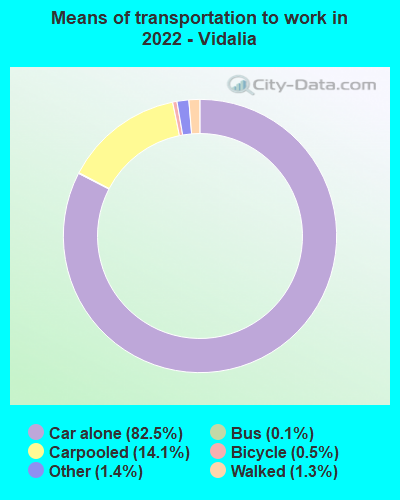
Means of transportation to work:
- Drove a car alone: 6,358 (77.3%)
- Carpooled: 1,138 (13.8%)
- Bus: 7 (0.1%)
- Taxi: 112 (1.4%)
- Bicycle: 39 (0.5%)
- Walked: 106 (1.3%)
- Worked at home: 173 (2.1%)
- Unemployment by race in 2022
- Unemployment rate for White non-Hispanic residents
- 0.5%Males
- Unemployment rate for Black residents
- 32.3%Males
- 2.0%Females
- Unemployment rate for two or more race residents
- 6.0%Males
- Unemployment rate for Hispanic or Latino residents
- 44.6%Males

- Year of entry for the foreign-born population in Vidalia, Georgia
- 2612010 or later
- 452000 to 2009
- 81990 to 1999
- 401980 to 1989
- 261970 to 1979
- 18Before 1970

First ancestries reported:
- American: 888 (15.9%)
- English: 700 (12.5%)
- Irish: 267 (4.8%)
- German: 250 (4.5%)
- Brazilian: 110 (2.0%)
- European: 94 (1.7%)
- Welsh: 72 (1.3%)
- Scottish: 63 (1.1%)
- Scotch-Irish: 43 (0.8%)
- Russian: 27 (0.5%)
- African: 16 (0.3%)
- Eastern European: 15 (0.3%)
- French: 15 (0.3%)
- Haitian: 1 (0.02%)
Most common places of birth for foreign-born residents (%):
| Vidalia: | 24.9% (116) |
| Georgia: | 1.6% (18,211) |
| Vidalia: | 19.7% (92) |
| Georgia: | 3.5% (39,227) |
| Vidalia: | 16.3% (76) |
| Georgia: | 1.7% (18,651) |
| Vidalia: | 5.6% (26) |
| Georgia: | 0.2% (2,103) |
| Vidalia: | 5.6% (26) |
| Georgia: | 2.1% (23,500) |
| Vidalia: | 5.4% (25) |
| Georgia: | 9.2% (103,325) |
| Vidalia: | 5.2% (24) |
| Georgia: | 1.8% (20,700) |
| Vidalia: | 3.4% (16) |
| Georgia: | 3.9% (43,756) |
| Vidalia: | 3.0% (14) |
| Georgia: | 2.5% (27,794) |
| Vidalia: | 3.0% (14) |
| Georgia: | 20.0% (223,400) |
| Vidalia: | 2.4% (11) |
| Georgia: | 0.1% (1,321) |
Place of birth for U.S.-born residents:
- This state: 8,300
- Other state: 1,867
- Northeast: 292
- Midwest: 217
- South: 1,155
- West: 203
88.7% of Vidalia residents lived in the same house 1 years ago.
Out of people who lived in different houses, 23.2% lived in this county.
Out of people who lived in different counties, 61.8% lived in Georgia.
| Vidalia: | 88.7% |
| State average: | 86.6% |
Education attainment for males 25 years and older:
- No schooling: 38
- Nursery to 4th grade: 0
- 5th and 6th grade: 0
- 7th and 8th grade: 0
- 9th grade: 138
- 10th grade: 19
- 11th grade: 21
- 12th grade, no diploma: 28
- High school graduate (or equivalency): 983
- Less than 1 year of college: 145
- Some college more than 1 year, no degree: 576
- Associate degree: 136
- Bachelor's degree: 484
- Master's degree: 184
- Professional school degree: 43
- Doctorate degree: 6

Education attainment for females 25 years and older:
- No schooling: 72
- Nursery to 4th grade: 0
- 5th and 6th grade: 2
- 7th and 8th grade: 74
- 9th grade: 14
- 10th grade: 16
- 11th grade: 26
- 12th grade, no diploma: 123
- High school graduate (or equivalency): 1,092
- Less than 1 year of college: 277
- Some college more than 1 year, no degree: 1,128
- Associate degree: 369
- Bachelor's degree: 289
- Master's degree: 524
- Professional school degree: 59
- Doctorate degree: 26


Housing units in structures:
- One, detached: 3,225
- One, attached: 108
- Two: 687
- 3 or 4: 126
- 5 to 9: 256
- 10 to 19: 47
- 20 to 49: 35
- 50 or more: 91
- Mobile homes: 192
Housing units lacking complete kitchen facilities in 2022: 3.1%
House/condo owner moved in on average 15 years ago
Renter moved in on average 6 years ago

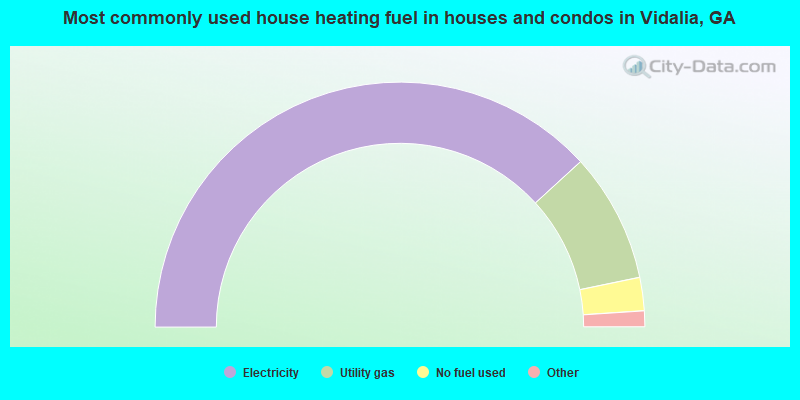
- 76.4%Electricity
- 17.1%Utility gas
- 4.4%No fuel used
- 1.2%Bottled, tank, or LP gas
- 0.9%Wood
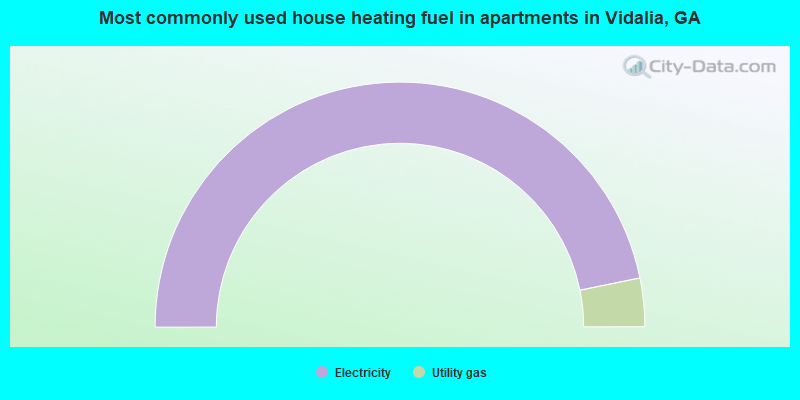
- 93.6%Electricity
- 6.4%Utility gas
Private vs. public school enrollment:
| Here: | 17.7% |
| Georgia: | 12.1% |
| Here: | 4.7% |
| Georgia: | 10.8% |
| Here: | 3.7% |
| Georgia: | 17.1% |


