Westminster, CO (Colorado) Houses and Residents
| Westminster: | $559,100 |
| Colorado: | $531,100 |
Mean price in 2022:
Detached houses: $630,437
Here: $630,437 State: $676,667 Townhouses or other attached units: $452,520
Here: $452,520 State: $526,340 In 3-to-4-unit structures: $373,162
Here: $373,162 State: $385,502 In 5-or-more-unit structures: $302,942
Here: $302,942 State: $417,586 Mobile homes: $32,704
Here: $32,704 State: $115,510
Total population: 112,090 (Urban population: 101,178, Rural population: 19 (all nonfarm))
Houses: 50,338 (47,906 occupied: 30,645 owner occupied, 17,261 renter occupied)
| % of renters here: | 36% |
| State: | 34% |
Housing density: 1,598 houses/condos per square mile
Median price asked for vacant for-sale houses and condos in 2022: $989,696.
Median contract rent in 2022: $1,582 (lower quartile is $1,231, upper quartile is $1,968)
Median rent asked for vacant for-rent units in 2022: $2,695
Median gross rent in Westminster, CO in 2022: $1,735
Housing units in Westminster with a mortgage: 24,153 (3,066 second mortgage, 0 home equity loan, 2,240 both second mortgage and home equity loan)
Houses without a mortgage: 343
Median household income for houses/condos with a mortgage: $133,079
Median household income for apartments without a mortgage: $105,979
Median monthly housing costs: $1,735
Compare current foreclosures in Westminster, CO:
| Photo | Address | Area | Beds / Baths | Price | Details |
|---|---|---|---|---|---|

|
#1
Hunter St
Westminster, CO 80031
|
1,170 sq. feet
|
1 baths 3 beds |
show details | |

|
#2
King Ct
Westminster, CO 80031
|
1,542 sq. feet
|
4 baths 3 beds |
show details | |

|
#3
Hobbit Ln
Westminster, CO 80031
|
2,017 sq. feet
|
3 baths 4 beds |
show details | |

|
#4
W 71st Pl
Westminster, CO 80030
|
1,738 sq. feet
|
2 baths 3 beds |
show details | |

|
#5
Wolff St Unit H
Westminster, CO 80031
|
- sq. feet
|
1 baths 3 beds |
show details | |

|
#6
W 80th Dr
Westminster, CO 80031
|
1,690 sq. feet
|
2 baths 3 beds |
show details | |

|
#7
Stuart Pl
Westminster, CO 80031
|
2,400 sq. feet
|
3 baths 3 beds |
show details | |

|
#8
W 92nd Pl
Westminster, CO 80031
|
1,920 sq. feet
|
3 baths 3 beds |
show details | |

|
#9
Hunter Way
Westminster, CO 80031
|
1,212 sq. feet
|
1 baths 3 beds |
show details | |

|
#10
W 107th Pl
Westminster, CO 80031
|
1,088 sq. feet
|
3 baths 2 beds |
show details |
| Photo | Address | Area | Beds / Baths | Price | Details |
|---|---|---|---|---|---|

|
#11
Wilson Ct
Westminster, CO 80030
|
624 sq. feet
|
1 baths 2 beds |
show details | |

|
#12
W 81st Ave
Westminster, CO 80031
|
1,753 sq. feet
|
4 baths 3 beds |
show details | |

|
#13
Perry Pl
Westminster, CO 80030
|
1,014 sq. feet
|
1 baths 2 beds |
show details | |

|
#14
W 88th Pl
Westminster, CO 80031
|
1,632 sq. feet
|
2 baths 3 beds |
show details | |

|
#15
Turnpike Dr
Westminster, CO 80031
|
1,629 sq. feet
|
2 baths 4 beds |
show details | |

|
#16
Vrain St
Westminster, CO 80030
|
1,198 sq. feet
|
1 baths 3 beds |
show details | |

|
#17
W 101st Ave
Westminster, CO 80031
|
1,967 sq. feet
|
2 baths 3 beds |
show details | |

|
#18
Newton Way
Westminster, CO 80030
|
2,211 sq. feet
|
2 baths 4 beds |
show details | |

|
#19
Bryant St
Westminster, CO 80030
|
1,092 sq. feet
|
1 baths 3 beds |
show details | |

|
#20
Grove St
Westminster, CO 80030
|
988 sq. feet
|
1 baths 3 beds |
show details |
| Photo | Address | Area | Beds / Baths | Price | Details |
|---|---|---|---|---|---|

|
#21
W 89th Way
Westminster, CO 80031
|
2,672 sq. feet
|
2 baths 3 beds |
show details | |

|
#22
W 92nd Ave Unit 14a
Westminster, CO 80031
|
1,764 sq. feet
|
2 baths 2 beds |
show details | |

|
#23
Quigley St
Westminster, CO 80031
|
1,160 sq. feet
|
2 baths 3 beds |
show details | |

|
#24
W 118th Pl
Westminster, CO 80031
|
1,868 sq. feet
|
2 baths 3 beds |
show details | |

|
#25
W 86th Ave Apt 200
Westminster, CO 80031
|
1,000 sq. feet
|
1 baths 2 beds |
show details | |

|
#26
N Osceola Dr
Westminster, CO 80031
|
4,184 sq. feet
|
2 baths 2 beds |
show details | |

|
#27
W 80th Dr
Westminster, CO 80031
|
1,313 sq. feet
|
2 baths 3 beds |
show details | |

|
#28
W 85th Ave
Westminster, CO 80031
|
1,716 sq. feet
|
2 baths 3 beds |
show details | |

|
#29
Knox Pl
Westminster, CO 80030
|
1,632 sq. feet
|
2 baths 2 beds |
show details | |

|
#30
Wagner Dr
Westminster, CO 80031
|
1,200 sq. feet
|
1 baths 3 beds |
show details |
| Photo | Address | Area | Beds / Baths | Price | Details |
|---|---|---|---|---|---|

|
#31
Decatur St Apt 101
Westminster, CO 80031
|
1,030 sq. feet
|
2 baths 2 beds |
show details | |

|
#32
Raleigh Pl
Westminster, CO 80031
|
1,050 sq. feet
|
1 baths 3 beds |
show details | |

|
#33
Shaw Blvd
Westminster, CO 80031
|
1,026 sq. feet
|
1 baths 3 beds |
show details | |

|
#34
Raleigh Pl
Westminster, CO 80030
|
756 sq. feet
|
1 baths 2 beds |
show details | |

|
#35
Newton St
Westminster, CO 80031
|
1,914 sq. feet
|
3 baths 4 beds |
show details | |

|
#36
W 95th Ave
Westminster, CO 80031
|
1,706 sq. feet
|
2 baths 3 beds |
show details | |

|
#37
Highland Pl
Westminster, CO 80031
|
936 sq. feet
|
1 baths 2 beds |
show details | |

|
#38
Mason Cir
Westminster, CO 80031
|
1,478 sq. feet
|
1 baths 2 beds |
show details | |

|
#39
Perry St
Westminster, CO 80031
|
- sq. feet
|
- baths - beds |
show details | |

|
#40
W 97th Ave Unit 22
Westminster, CO 80031
|
- sq. feet
|
- baths - beds |
show details |
| Photo | Address | Area | Beds / Baths | Price | Details |
|---|---|---|---|---|---|

|
#41
Federal Blvd Apt 196
Westminster, CO 80031
|
- sq. feet
|
- baths - beds |
show details | |

|
#42
W 92nd Ave Apt 338
Westminster, CO 80031
|
- sq. feet
|
- baths - beds |
show details | |

|
#43
Bradburn Blvd
Westminster, CO 80031
|
- sq. feet
|
- baths - beds |
show details | |

|
#44
Raleigh St Apt 308
Westminster, CO 80030
|
- sq. feet
|
- baths - beds |
show details | |

|
#45
Osceola St
Westminster, CO 80031
|
- sq. feet
|
- baths - beds |
show details | |

|
#46
Hunter Way
Westminster, CO 80031
|
- sq. feet
|
- baths - beds |
show details | |

|
#47
W 81st Ave Apt B
Westminster, CO 80031
|
- sq. feet
|
- baths - beds |
show details | |

|
#48
Tennyson St Apt 4
Westminster, CO 80030
|
- sq. feet
|
- baths - beds |
show details | |

|
#49
Central Ave, Unit 502
Westminster, CO 80031
|
- sq. feet
|
- baths - beds |
show details | |

|
Check over 1 million property listings on Foreclosure.com!
|
browse all offers | |||

Latest news about housing in Westminster, CO collected exclusively by city-data.com from local newspapers, TV, and radio stations


Median year apartment built: 1994
Household type by relationship:
Households: 114,539- Male householders: 24,560 (6,908 living alone), Female householders: 23,346 (5,787 living alone)
23,354 spouses (23,184 opposite-sex spouses), 4,527 unmarried partners, (4,137 opposite-sex unmarried partners), 31,666 children (29,896 natural, 307 adopted, 1,463 stepchildren), 903 grandchildren, 721 brothers or sisters, 1,119 parents, 0 foster children, 848 other relatives, 3,030 non-relatives
- In group quarters: 465
Size of family households: 14,970 2-persons, 6,641 3-persons, 5,667 4-persons, 2,026 5-persons, 686 6-persons, 168 7-or-more-persons.
Size of nonfamily households: 12,695 1-person, 4,324 2-persons, 271 3-persons, 458 4-persons.
14,388 married couples with children.
6,060 single-parent households (2,405 men, 3,655 women).
83.5% of residents of Westminster speak English at home.
10.4% of residents speak Spanish at home (73% speak English very well, 16% speak English well, 8% speak English not well, 3% don't speak English at all).
2.3% of residents speak other Indo-European language at home (68% speak English very well, 19% speak English well, 12% speak English not well, 1% don't speak English at all).
3.3% of residents speak Asian or Pacific Island language at home (49% speak English very well, 27% speak English well, 22% speak English not well, 2% don't speak English at all).
0.3% of residents speak other language at home (65% speak English very well, 30% speak English well, 5% speak English not well).
Foreign born population: 11,059 (9.7%)
(48.7% of them are naturalized citizens)
| Here: | 7.1 |
| State: | 6.8 |
| Here: | 3.7 |
| State: | 4.0 |

- Bedrooms in owner-occupied houses and condos in Westminster, Colorado
- 46no bedroom
- 3441 bedroom
- 4,9832 bedrooms
- 11,6433 bedrooms
- 10,6824 bedrooms
- 2,9475+ bedrooms

- Bedrooms in renter-occupied apartments in Westminster, Colorado
- 997no bedroom
- 5,9961 bedroom
- 7,2442 bedrooms
- 2,2023 bedrooms
- 3204 bedrooms
- 5025+ bedrooms

- Cars and other vehicles available in Westminster in owner-occupied houses/condos
- 399no vehicle
- 5,9761 vehicle
- 15,3862 vehicles
- 5,3963 vehicles
- 2,2714 vehicles
- 1,2175+ vehicles

- Cars and other vehicles available in Westminster in renter-occupied apartments
- 2,317no vehicle
- 7,4111 vehicle
- 5,6642 vehicles
- 1,3913 vehicles
- 04 vehicles
- 4785+ vehicles

- Rooms in owner-occupied houses in Westminster, Colorado
- 461 room
- 02 rooms
- 6113 rooms
- 2,5824 rooms
- 4,7935 rooms
- 4,7126 rooms
- 4,2357 rooms
- 5,3058 rooms
- 8,3619+ rooms

- Rooms in renter-occupied apartments in Westminster, Colorado
- 8931 room
- 1,8232 rooms
- 4,6973 rooms
- 5,1074 rooms
- 2,0125 rooms
- 1,5376 rooms
- 2677 rooms
- 2158 rooms
- 7109+ rooms


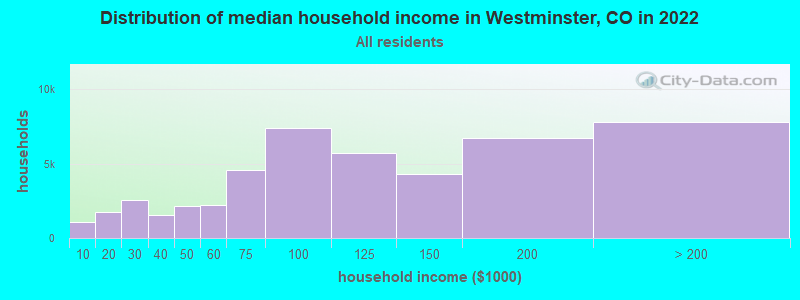
Westminster, CO household income distribution

- 1,077Less than $10,000
- 1,743$10,000 to $19,999
- 2,556$20,000 to $29,999
- 1,565$30,000 to $39,999
- 2,172$40,000 to $49,999
- 2,211$50,000 to $59,999
- 4,601$60,000 to $74,999
- 7,397$75,000 to $99,999
- 5,751$100,000 to $124,999
- 4,277$125,000 to $149,999
- 6,745$150,000 to $199,999
- 7,811$200,000 or more
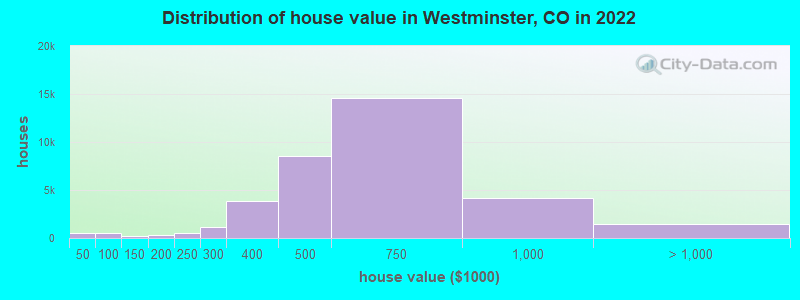
Home value of owner - occupied houses in 2022 in Westminster, CO
-
- 101Less than $10,000
- 60$10,000 to $14,999
- 32$15,000 to $19,999
- 33$20,000 to $24,999
- 22$25,000 to $29,999
- 43$30,000 to $34,999
- 107$35,000 to $39,999
- 87$40,000 to $49,999
- 134$50,000 to $59,999
- 116$60,000 to $69,999
- 24$70,000 to $79,999
- 46$80,000 to $89,999
- 80$90,000 to $99,999
- 119$100,000 to $124,999
- 100$125,000 to $149,999
- 207$150,000 to $174,999
- 151$175,000 to $199,999
- 562$200,000 to $249,999
- 1,112$250,000 to $299,999
- 3,815$300,000 to $399,999
- 8,518$400,000 to $499,999
- 14,569$500,000 to $749,999
- 4,192$750,000 to $999,999
- 1,122$1,000,000 to $1,499,999
- 143$1,500,000 to $1,999,999
- 144$2,000,000 or more
Rent paid by renters in 2022 in Westminster, CO
-
- 36$100 to $149
- 5$200 to $249
- 62$250 to $299
- 45$300 to $349
- 20$350 to $399
- 65$400 to $449
- 41$450 to $499
- 29$500 to $549
- 62$600 to $649
- 86$650 to $699
- 162$700 to $749
- 56$750 to $799
- 385$800 to $899
- 376$900 to $999
- 2,143$1,000 to $1,249
- 2,840$1,250 to $1,499
- 6,798$1,500 to $1,999
- 2,198$2,000 to $2,499
- 626$2,500 to $2,999
- 198$3,000 to $3,499
- 115$3,500 or more
- 345No cash rent


Percentage of workers working in this county: 51.7%
Number of people working at home: 15,922 (22.9% of all workers)
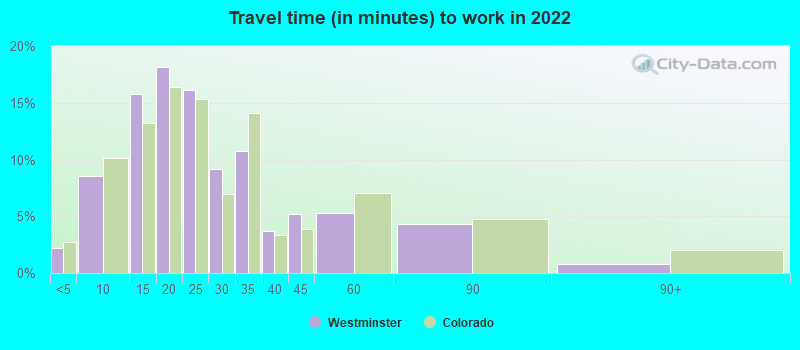
Travel time to work (commute)
- Less than 5 minutes: 625
- 5 to 9 minutes: 3,729
- 10 to 14 minutes: 5,186
- 15 to 19 minutes: 7,365
- 20 to 24 minutes: 9,517
- 25 to 29 minutes: 5,769
- 30 to 34 minutes: 7,752
- 35 to 39 minutes: 2,433
- 40 to 44 minutes: 2,797
- 45 to 59 minutes: 4,489
- 60 to 89 minutes: 2,725
- 90 or more minutes: 141
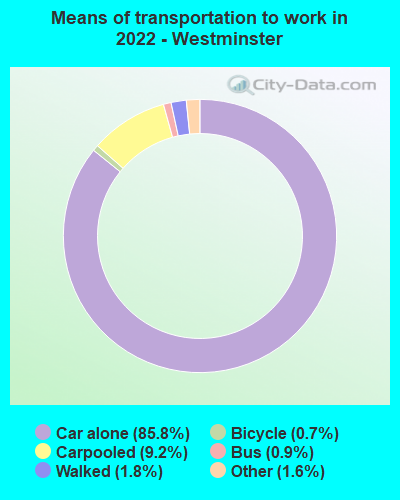
Means of transportation to work:
- Drove a car alone: 34,434 (63.4%)
- Carpooled: 3,912 (7.2%)
- Bus: 238 (0.4%)
- Subway or elevated rail: 6 (0.0%)
- Taxi: 635 (1.2%)
- Bicycle: 214 (0.4%)
- Walked: 611 (1.1%)
- Worked at home: 15,922 (29.3%)

- Unemployment by race in 2022
- Unemployment rate for White non-Hispanic residents
- 2.4%Males
- 1.5%Females
- Unemployment rate for Black residents
- 0.9%Males
- Unemployment rate for American Indian and Alaska Native residents
- 1.6%Males
- 8.4%Females
- Unemployment rate for Asian residents
- 0.6%Males
- 6.8%Females
- Unemployment rate for other race residents
- 1.5%Males
- 4.9%Females
- Unemployment rate for two or more race residents
- 4.3%Males
- 4.1%Females
- Unemployment rate for Hispanic or Latino residents
- 3.2%Males
- 5.7%Females

- Year of entry for the foreign-born population in Westminster, Colorado
- 1,8952010 or later
- 3,1792000 to 2009
- 2,2561990 to 1999
- 2,3821980 to 1989
- 1,3331970 to 1979
- 1,026Before 1970
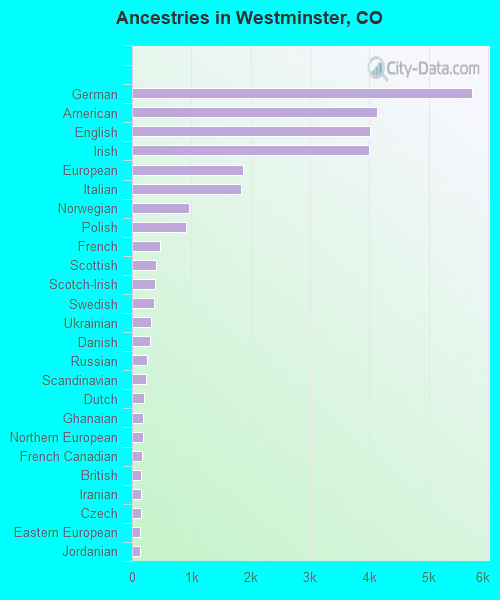
First ancestries reported:
- German: 5,732 (11.0%)
- American: 4,132 (7.9%)
- English: 4,004 (7.7%)
- Irish: 3,989 (7.6%)
- European: 1,876 (3.6%)
- Italian: 1,838 (3.5%)
- Norwegian: 967 (1.9%)
- Polish: 909 (1.7%)
- French: 464 (0.9%)
- Scottish: 401 (0.8%)
- Scotch-Irish: 387 (0.7%)
- Swedish: 377 (0.7%)
- Ukrainian: 315 (0.6%)
- Danish: 308 (0.6%)
- Russian: 248 (0.5%)
- Scandinavian: 240 (0.5%)
- Dutch: 197 (0.4%)
- Ghanaian: 187 (0.4%)
- Northern European: 180 (0.3%)
- French Canadian: 174 (0.3%)
- British: 156 (0.3%)
- Iranian: 152 (0.3%)
- Czech: 150 (0.3%)
- Eastern European: 142 (0.3%)
- Jordanian: 133 (0.3%)
- Yugoslavian: 120 (0.2%)
- Turkish: 107 (0.2%)
- Austrian: 106 (0.2%)
- Armenian: 88 (0.2%)
- Swiss: 76 (0.1%)
- Czechoslovakian: 72 (0.1%)
- Greek: 56 (0.1%)
- Canadian: 56 (0.1%)
- Croatian: 54 (0.1%)
- Lithuanian: 46 (0.09%)
- Palestinian: 40 (0.08%)
- Finnish: 38 (0.07%)
- Hungarian: 36 (0.07%)
- Bulgarian: 35 (0.07%)
- Portuguese: 34 (0.07%)
- Slavic: 34 (0.07%)
- Slovak: 33 (0.06%)
- U.S. Virgin Islander: 32 (0.06%)
- African: 26 (0.05%)
- Slovene: 25 (0.05%)
- Ethiopian: 22 (0.04%)
- West Indian: 21 (0.04%)
- Haitian: 20 (0.04%)
- New Zealander: 19 (0.04%)
- Latvian: 17 (0.03%)
- Belgian: 16 (0.03%)
- Basque: 15 (0.03%)
- Welsh: 13 (0.02%)
- Egyptian: 12 (0.02%)
- German Russian: 10 (0.02%)
- Serbian: 10 (0.02%)
- Brazilian: 10 (0.02%)
- Romanian: 5 (0.01%)
- Albanian: 5 (0.01%)
- South African: 5 (0.01%)
- Estonian: 3 (0.01%)
Most common places of birth for foreign-born residents (%):
| Westminster: | 31.5% (3,252) |
| Colorado: | 38.3% (209,491) |
| Westminster: | 6.6% (681) |
| Colorado: | 3.0% (16,616) |
| Westminster: | 4.0% (417) |
| Colorado: | 0.4% (2,063) |
| Westminster: | 4.0% (412) |
| Colorado: | 4.0% (21,689) |
| Westminster: | 3.3% (346) |
| Colorado: | 2.9% (15,981) |
| Westminster: | 3.1% (323) |
| Colorado: | 3.3% (17,998) |
| Westminster: | 2.6% (272) |
| Colorado: | 1.1% (5,971) |
| Westminster: | 2.4% (249) |
| Colorado: | 1.0% (5,214) |
| Westminster: | 2.2% (232) |
| Colorado: | 0.4% (2,007) |
| Westminster: | 2.1% (220) |
| Colorado: | 2.7% (15,026) |
| Westminster: | 1.9% (192) |
| Colorado: | 0.9% (4,829) |
| Westminster: | 1.8% (187) |
| Colorado: | 2.5% (13,706) |
| Westminster: | 1.8% (182) |
| Colorado: | 0.1% (701) |
| Westminster: | 1.7% (180) |
| Colorado: | 0.9% (4,810) |
| Westminster: | 1.7% (172) |
| Colorado: | 0.7% (3,596) |
| Westminster: | 1.7% (171) |
| Colorado: | 0.7% (3,568) |
Place of birth for U.S.-born residents:
- This state: 55,546
- Other state: 46,096
- Northeast: 5,713
- Midwest: 15,818
- South: 10,914
- West: 13,651
87.2% of Westminster residents lived in the same house 1 years ago.
Out of people who lived in different houses, 24.0% lived in this county.
Out of people who lived in different counties, 68.2% lived in Colorado.
| Westminster: | 87.2% |
| State average: | 83.6% |
Education attainment for males 25 years and older:
- No schooling: 474
- Nursery to 4th grade: 306
- 5th and 6th grade: 38
- 7th and 8th grade: 109
- 9th grade: 774
- 10th grade: 118
- 11th grade: 528
- 12th grade, no diploma: 658
- High school graduate (or equivalency): 10,584
- Less than 1 year of college: 2,249
- Some college more than 1 year, no degree: 5,641
- Associate degree: 2,942
- Bachelor's degree: 13,092
- Master's degree: 5,013
- Professional school degree: 906
- Doctorate degree: 445

Education attainment for females 25 years and older:
- No schooling: 438
- Nursery to 4th grade: 0
- 5th and 6th grade: 59
- 7th and 8th grade: 208
- 9th grade: 370
- 10th grade: 657
- 11th grade: 946
- 12th grade, no diploma: 805
- High school graduate (or equivalency): 7,322
- Less than 1 year of college: 2,359
- Some college more than 1 year, no degree: 4,032
- Associate degree: 2,515
- Bachelor's degree: 12,646
- Master's degree: 6,911
- Professional school degree: 434
- Doctorate degree: 603


Housing units in structures:
- One, detached: 27,622
- One, attached: 5,000
- Two: 352
- 3 or 4: 1,555
- 5 to 9: 3,777
- 10 to 19: 3,672
- 20 to 49: 3,219
- 50 or more: 4,850
- Mobile homes: 291
Median worth of mobile homes: $66,476
Housing units lacking complete kitchen facilities in 2022: 0.3%
House/condo owner moved in on average 9 years ago
Renter moved in on average 2 years ago

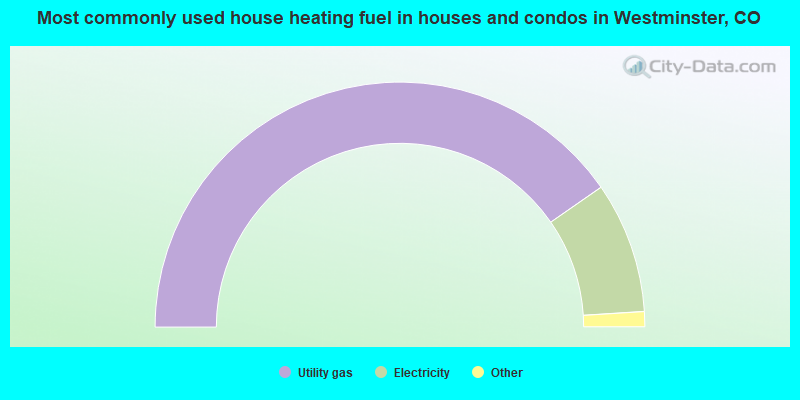
- 80.6%Utility gas
- 17.3%Electricity
- 0.6%Wood
- 0.6%Bottled, tank, or LP gas
- 0.5%Solar energy
- 0.3%No fuel used
- 0.1%Other fuel
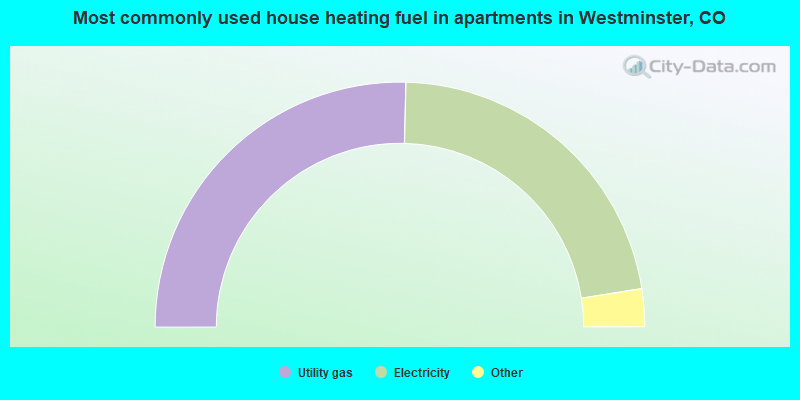
- 50.8%Utility gas
- 44.2%Electricity
- 1.9%Bottled, tank, or LP gas
- 1.6%Other fuel
- 1.5%No fuel used
Private vs. public school enrollment:
| Here: | 9.9% |
| Colorado: | 11.4% |
| Here: | 7.0% |
| Colorado: | 8.5% |
| Here: | 20.7% |
| Colorado: | 14.0% |


