Wichita, KS (Kansas) Houses and Residents
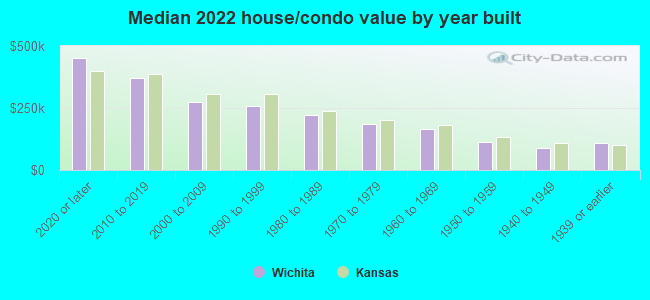
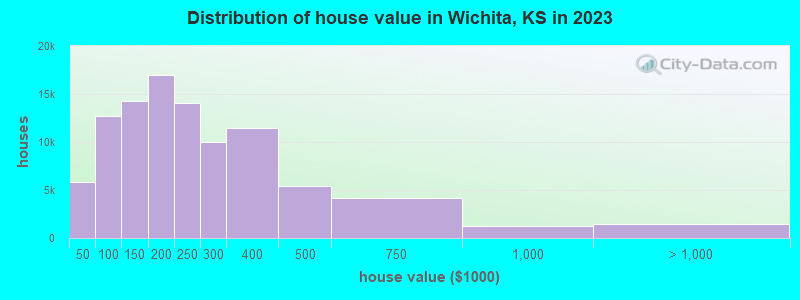
Estimated median house or condo value in 2022: $187,800 (it was $75,000 in 2000 )
Wichita:
$187,800Kansas:
$206,600
Lower value quartile - upper value quartile: $109,900 - $288,100Mean price in 2022: Detached houses: $245,335 Here:
$245,335State:
$264,181
Townhouses or other attached units: $162,110 Here:
$162,110State:
$219,178
In 2-unit structures: $171,138 Here:
$171,138State:
$190,919
In 3-to-4-unit structures: $120,299 Here:
$120,299State:
$161,859
In 5-or-more-unit structures: $346,125 Here:
$346,125State:
$267,030
Mobile homes: $47,436 Here:
$47,436State:
$74,712
Total population: 388,413 (Urban population: 343,028, Rural population: 969 (all nonfarm) )
Houses: 177,646 (157,146 occupied: 96,408 owner occupied, 60,738 renter occupied )
% of renters here:
39%State:
32%
Housing density: 1,309 houses/condos per square mile
Median price asked for vacant for-sale houses and condos in 2022: $246,208.
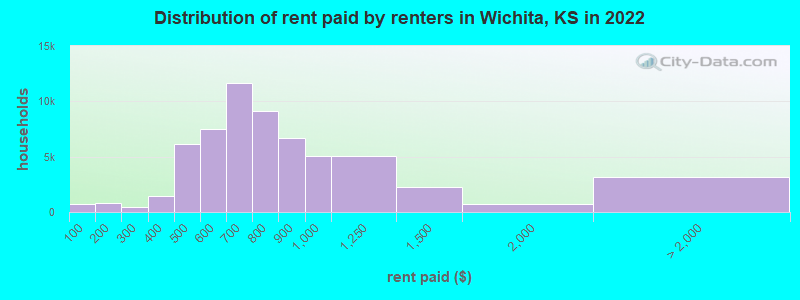
Median contract rent in 2022: $709 (lower quartile is $571, upper quartile is $892)
Median rent asked for vacant for-rent units in 2022: $742
Median gross rent in Wichita, KS in 2022: $900
Housing units in Wichita with a mortgage: 56,737 (3,596 second mortgage, 0 home equity loan, 2,668 both second mortgage and home equity loan )Houses without a mortgage: 1,492
Median household income for houses/condos with a mortgage: $91,277
Median household income for apartments without a mortgage: $60,870
Median monthly housing costs: $930
Data:
Median house or condo value ($)
Median house or condo value ($ change since 2000)
Median house or condo value ($) - White
Median house or condo value ($) - Black or African American
Median house or condo value ($) - Asian
Median house or condo value ($) - Hispanic or Latino
Median house or condo value ($) - American Indian and Alaska Native
Median house or condo value ($) - Multirace
Median house or condo value ($) - Other Race
Median price asked for mobile homes ($)
Household density (households per square mile)
Mean house or condo value by units in structure - 1, detached ($)
Mean house or condo value by units in structure - 1, attached ($)
Mean house or condo value by units in structure - 2 ($)
Mean house or condo value by units in structure by units in structure - 3 or 4 ($)
Mean house or condo value by units in structure - 5 or more ($)
Mean house or condo value by units in structure - Boat, RV, van, etc. ($)
Mean house or condo value by units in structure - Mobile home ($)
Median contract rent ($)
Median contract rent - Lower quartile ($)
Median contract rent - Upper quartile ($)
Median gross rent ($)
Urban houses (%)
Rural houses (%)
Houses occupied (%)
Houses occupied (% change since 2000)
Houses owner occupied (%)
Houses owner occupied (% change since 2000)
Houses renter occupied (%)
Houses renter occupied (% change since 2000)
Vacant housing units - For rent (%)
Vacant housing units - For rent (% change since 2000)
Vacant housing units - For sale only (%)
Vacant housing units - For sale only (% change since 2000)
Vacant housing units - Rented or sold, not occupied (%)
Vacant housing units - Rented or sold, not occupied (% change since 2000)
Vacant housing units - For seasonal, recreational, or occasional use (%)
Vacant housing units - For seasonal, recreational, or occasional use (% change since 2000)
Vacant housing units - For migrant workers (%)
Vacant housing units - For migrant workers (% change since 2000)
Vacant housing units - Other vacant (%)
Vacant housing units - Other vacant (% change since 2000)
Median monthly housing costs ($)
Median household income for houses/condos with a mortgage ($)
Median household income for houses/condos without a mortgage ($)
Median household income ($)
Median household income ($) - White
Median household income ($) - Black or African American
Median household income ($) - Asian
Median household income ($) - Hispanic or Latino
Median household income ($) - American Indian and Alaska Native
Median household income ($) - Multirace
Median household income ($) - Other Race
Mortgage status - with mortgage (%)
Mortgage status - with second mortgage (%)
Mortgage status - with home equity loan (%)
Mortgage status - with both second mortgage and home equity loan (%)
Mortgage status - without a mortgage (%)
Median year house/condo built
Median year apartment built
Household type by relationship - Male householder living alone (%)
Household type by relationship - Male householder not living alone (%)
Household type by relationship - Female householder living alone (%)
Household type by relationship - Female householder not living alone (%)
Household type by relationship - Opposite-Sex spouse (%)
Household type by relationship - Same-Sex spouse (%)
Household type by relationship - Opposite-Sex unmarried partner (%)
Household type by relationship - Same-Sex unmarried partner (%)
Household type by relationship - In group quarters (%)
Size of family households - 2-person household (%)
Size of family households - 3-person household (%)
Size of family households - 4-person household (%)
Size of family households - 5-person household (%)
Size of family households - 6-person household (%)
Size of family households - 7-or-more-person household (%)
Size of nonfamily households - 1-person household (%)
Size of nonfamily households - 2-person household (%)
Size of nonfamily households - 3-person household (%)
Size of nonfamily households - 4-person household (%)
Size of nonfamily households - 5-person household (%)
Size of nonfamily households - 6-person household (%)
Size of nonfamily households - 7-or-moreperson household (%)
Year house built - Built 2010 or later (%)
Year house built - Built 2000 to 2009 (%)
Year house built - Built 1990 to 1999 (%)
Year house built - Built 1980 to 1989 (%)
Year house built - Built 1970 to 1979 (%)
Year house built - Built 1960 to 1969 (%)
Year house built - Built 1950 to 1959 (%)
Year house built - Built 1940 to 1949 (%)
Year house built - Built 1939 or earlier (%)
Median number of rooms in houses and condos
Median number of rooms in apartments
Median number of bedrooms in owner occupied houses
Mean number of bedrooms in owner occupied houses
Median number of bedrooms in renter occupied houses
Mean number of bedrooms in renter occupied houses
Median number of vehichles in owner occupied houses
Mean number of vehichles in owner occupied houses
Median number of vehichles in renter occupied houses
Mean number of vehichles in renter occupied houses
Rooms in owner-occupied houses - 1 room (%)
Rooms in owner-occupied houses - 2 rooms (%)
Rooms in owner-occupied houses - 3 rooms (%)
Rooms in owner-occupied houses - 4 rooms (%)
Rooms in owner-occupied houses - 5 rooms (%)
Rooms in owner-occupied houses - 6 rooms (%)
Rooms in owner-occupied houses - 7 rooms (%)
Rooms in owner-occupied houses - 8 rooms (%)
Rooms in owner-occupied houses - 9+ rooms (%)
Rooms in renter-occupied houses - 1 room (%)
Rooms in renter-occupied houses - 2 rooms (%)
Rooms in renter-occupied houses - 3 rooms (%)
Rooms in renter-occupied houses - 4 rooms (%)
Rooms in renter-occupied houses - 5 rooms (%)
Rooms in renter-occupied houses - 6 rooms (%)
Rooms in renter-occupied houses - 7 rooms (%)
Rooms in renter-occupied houses - 8 rooms (%)
Rooms in renter-occupied houses - 9+ rooms (%)
Bedrooms in owner-occupied houses - no bedrooms (%)
Bedrooms in owner-occupied houses - 1 bedroom (%)
Bedrooms in owner-occupied houses - 2 bedrooms (%)
Bedrooms in owner-occupied houses - 3 bedrooms (%)
Bedrooms in owner-occupied houses - 4 bedrooms (%)
Bedrooms in owner-occupied houses - 5+ bedrooms (%)
Bedrooms in renter-occupied houses - no bedrooms (%)
Bedrooms in renter-occupied houses - 1 bedroom (%)
Bedrooms in renter-occupied houses - 2 bedrooms (%)
Bedrooms in renter-occupied houses - 3 bedrooms (%)
Bedrooms in renter-occupied houses - 4 bedrooms (%)
Bedrooms in renter-occupied houses - 5+ bedrooms (%)
Vehicles available in owner-occupied houses - no vehicle available (%)
Vehicles available in owner-occupied houses - 1 vehicle available(%)
Vehicles available in owner-occupied houses - 2 Vehicles available (%)
Vehicles available in owner-occupied houses - 3 Vehicles available (%)
Vehicles available in owner-occupied houses - 4 Vehicles available (%)
Vehicles available in owner-occupied houses - 5+ Vehicles available (%)
Vehicles available in renter-occupied houses - no vehicle available (%)
Vehicles available in renter-occupied houses - 1 vehicle available (%)
Vehicles available in renter-occupied houses - 2 Vehicles available (%)
Vehicles available in renter-occupied houses - 3 Vehicles available (%)
Vehicles available in renter-occupied houses - 4 Vehicles available (%)
Vehicles available in renter-occupied houses - 5+ Vehicles available (%)
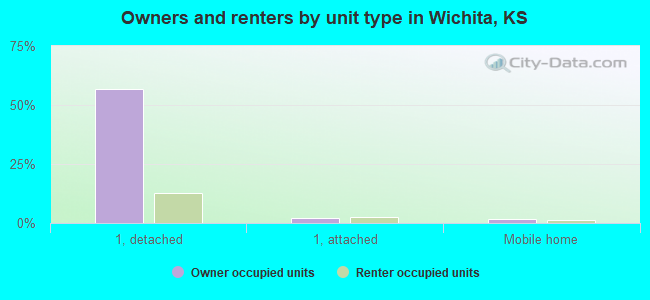
Housing units in structures - 1, detached (%)
Housing units in structures - 1, attached (%)
Housing units in structures - 2 (%)
Housing units in structures - 3 or 4 (%)
Housing units in structures - 5 to 9 (%)
Housing units in structures - 10 to 19 (%)
Housing units in structures - 20 to 49 (%)
Housing units in structures - 50 or more (%)
Housing units in structures - Mobile home (%)
Housing units in structures - Boat, RV, van, etc. (%)
Housing units in structures - Owners - 1, detached (%)
Housing units in structures - Owners - 1, attached (%)
Housing units in structures - Owners - 2 (%)
Housing units in structures - Owners - 3 or 4 (%)
Housing units in structures - Owners - 5 to 9 (%)
Housing units in structures - Owners - 10 to 19 (%)
Housing units in structures - Owners - 20 to 49 (%)
Housing units in structures - Owners - 50 or more (%)
Housing units in structures - Owners - Mobile home (%)
Housing units in structures - Owners - Boat, RV, van, etc. (%)
Housing units in structures - Renters - 1, detached (%)
Housing units in structures - Renters - 1, attached (%)
Housing units in structures - Renters - 2 (%)
Housing units in structures - Renters - 3 or 4 (%)
Housing units in structures - Renters - 5 to 9 (%)
Housing units in structures - Renters - 10 to 19 (%)
Housing units in structures - Renters - 20 to 49 (%)
Housing units in structures - Renters - 50 or more (%)
Housing units in structures - Renters - Mobile home (%)
Housing units in structures - Renters - Boat, RV, van, etc. (%)
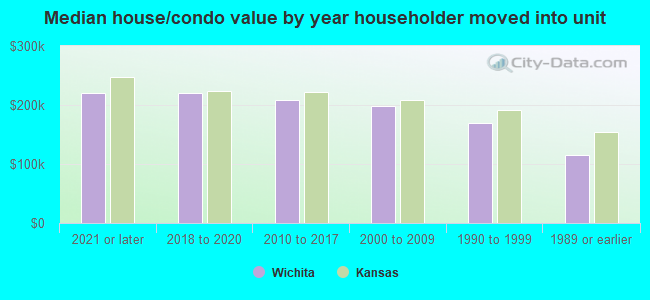
House/condo owner moved in on average (years ago)
Renter moved in on average (years ago)
Year householder moved into unit - Moved in 1999 to March 2000 (%)
Year householder moved into unit - Moved in 1999 to March 2000 (%) - White
Year householder moved into unit - Moved in 1999 to March 2000 (%) - Black or African American
Year householder moved into unit - Moved in 1999 to March 2000 (%) - Asian
Year householder moved into unit - Moved in 1999 to March 2000 (%) - Hispanic or Latino
Year householder moved into unit - Moved in 1999 to March 2000 (%) - American Indian and Alaska Native
Year householder moved into unit - Moved in 1999 to March 2000 (%) - Multirace
Year householder moved into unit - Moved in 1999 to March 2000 (%) - Other Race
Year householder moved into unit - Moved in 1995 to 1998 (%)
Year householder moved into unit - Moved in 1995 to 1998 (%) - White
Year householder moved into unit - Moved in 1995 to 1998 (%) - Black or African American
Year householder moved into unit - Moved in 1995 to 1998 (%) - Asian
Year householder moved into unit - Moved in 1995 to 1998 (%) - Hispanic or Latino
Year householder moved into unit - Moved in 1995 to 1998 (%) - American Indian and Alaska Native
Year householder moved into unit - Moved in 1995 to 1998 (%) - Multirace
Year householder moved into unit - Moved in 1995 to 1998 (%) - Other Race
Year householder moved into unit - Moved in 1990 to 1994 (%)
Year householder moved into unit - Moved in 1990 to 1994 (%) - White
Year householder moved into unit - Moved in 1990 to 1994 (%) - Black or African American
Year householder moved into unit - Moved in 1990 to 1994 (%) - Asian
Year householder moved into unit - Moved in 1990 to 1994 (%) - Hispanic or Latino
Year householder moved into unit - Moved in 1990 to 1994 (%) - American Indian and Alaska Native
Year householder moved into unit - Moved in 1990 to 1994 (%) - Multirace
Year householder moved into unit - Moved in 1990 to 1994 (%) - Other Race
Year householder moved into unit - Moved in 1980 to 1989 (%)
Year householder moved into unit - Moved in 1980 to 1989 (%) - White
Year householder moved into unit - Moved in 1980 to 1989 (%) - Black or African American
Year householder moved into unit - Moved in 1980 to 1989 (%) - Asian
Year householder moved into unit - Moved in 1980 to 1989 (%) - Hispanic or Latino
Year householder moved into unit - Moved in 1980 to 1989 (%) - American Indian and Alaska Native
Year householder moved into unit - Moved in 1980 to 1989 (%) - Multirace
Year householder moved into unit - Moved in 1980 to 1989 (%) - Other Race
Year householder moved into unit - Moved in 1970 to 1979 (%)
Year householder moved into unit - Moved in 1970 to 1979 (%) - White
Year householder moved into unit - Moved in 1970 to 1979 (%) - Black or African American
Year householder moved into unit - Moved in 1970 to 1979 (%) - Asian
Year householder moved into unit - Moved in 1970 to 1979 (%) - Hispanic or Latino
Year householder moved into unit - Moved in 1970 to 1979 (%) - American Indian and Alaska Native
Year householder moved into unit - Moved in 1970 to 1979 (%) - Multirace
Year householder moved into unit - Moved in 1970 to 1979 (%) - Other Race
Year householder moved into unit - Moved in 1969 or earlier (%)
Year householder moved into unit - Moved in 1969 or earlier (%) - White
Year householder moved into unit - Moved in 1969 or earlier (%) - Black or African American
Year householder moved into unit - Moved in 1969 or earlier (%) - Asian
Year householder moved into unit - Moved in 1969 or earlier (%) - Hispanic or Latino
Year householder moved into unit - Moved in 1969 or earlier (%) - American Indian and Alaska Native
Year householder moved into unit - Moved in 1969 or earlier (%) - Multirace
Year householder moved into unit - Moved in 1969 or earlier (%) - Other Race
Housing units lacking complete plumbing facilities (%)
Housing units lacking complete kitchen facilities (%)
House heating fuel used in houses and condos - Utility gas (%)
House heating fuel used in houses and condos - Bottled, tank, or LP gas (%)
House heating fuel used in houses and condos - Electricity (%)
House heating fuel used in houses and condos - Fuel oil, kerosene, etc. (%)
House heating fuel used in houses and condos - Coal or coke (%)
House heating fuel used in houses and condos - Wood (%)
House heating fuel used in houses and condos - Solar energy (%)
House heating fuel used in houses and condos - Other fuel (%)
House heating fuel used in houses and condos - No fuel used (%)
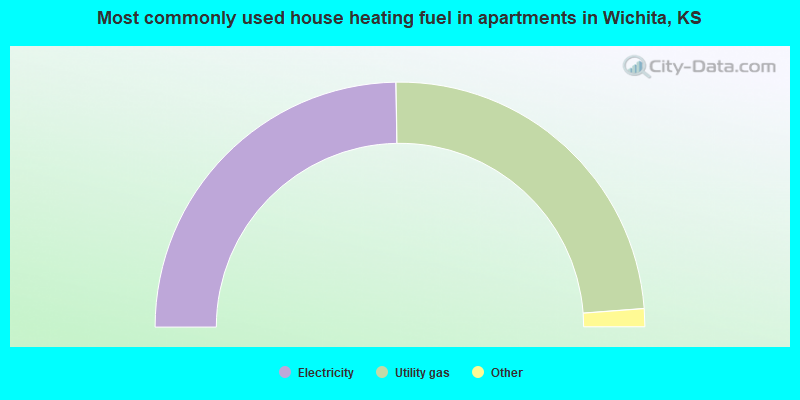
House heating fuel used in apartments - Utility gas (%)
House heating fuel used in apartments - Bottled, tank, or LP gas (%)
House heating fuel used in apartments - Electricity (%)
House heating fuel used in apartments - Fuel oil, kerosene, etc. (%)
House heating fuel used in apartments - Coal or coke (%)
House heating fuel used in apartments - Wood (%)
House heating fuel used in apartments - Solar energy (%)
House heating fuel used in apartments - Other fuel (%)
House heating fuel used in apartments - No fuel used (%)
Latest news about housing in Wichita, KS collected exclusively by city-data.com from local newspapers, TV, and radio stations
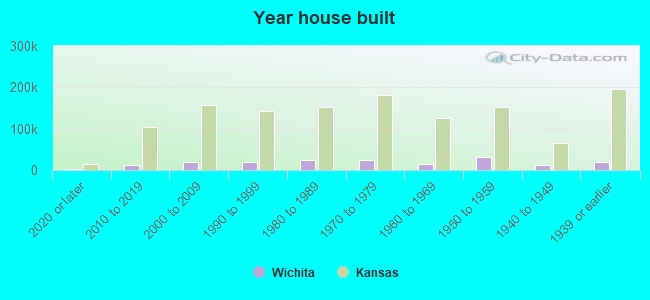
Median year house/condo built: 1975Median year apartment built: 1976Household type by relationship:
Households: 396,205
Male householders: 77,022 (24,509 living alone ), Female householders: 80,124 (25,957 living alone )65,172 spouses (64,652 opposite-sex spouses ), 12,909 unmarried partners , (12,027 opposite-sex unmarried partners ), 116,232 children (105,119 natural , 3,063 adopted , 8,050 stepchildren ), 8,760 grandchildren , 2,663 brothers or sisters , 5,523 parents , 314 foster children , 4,971 other relatives , 13,513 non-relatives In group quarters: 9,002
Size of family households: 42,247 2-persons , 19,157 3-persons , 16,622 4-persons , 7,527 5-persons , 5,501 6-persons , 2,600 7-or-more-persons .
Size of nonfamily households: 50,466 1-person , 10,930 2-persons , 1,818 3-persons , 222 4-persons , 56 5-persons .
55,859 married couples with children. single-parent households (8,723 men , 19,920 women ).
83.9% of residents of Wichita speak English at home. of residents speak Spanish at home (61% speak English very well , 21% speak English well , 11% speak English not well , 7% don't speak English at all ).of residents speak other Indo-European language at home (82% speak English very well , 13% speak English well , 2% speak English not well , 4% don't speak English at all ).of residents speak Asian or Pacific Island language at home (46% speak English very well , 22% speak English well , 24% speak English not well , 8% don't speak English at all ).of residents speak other language at home (73% speak English very well , 20% speak English well , 7% speak English not well ).
Foreign born population: 40,244 (10.2%)of them are naturalized citizens )
Median number of rooms in houses and condos:
Median number of rooms in apartments
Owner-occupied Renter-occupied
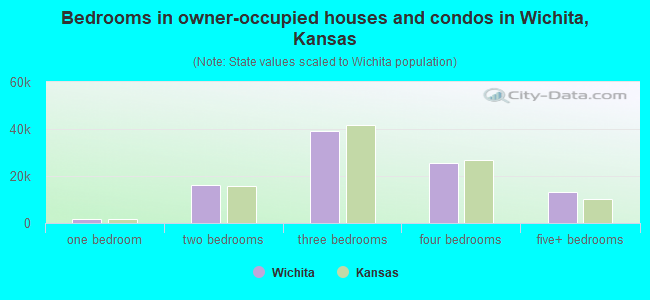
Bedrooms in owner-occupied houses and condos in Wichita, Kansas
208 no bedroom 1,709 1 bedroom 16,145 2 bedrooms 39,204 3 bedrooms 25,743 4 bedrooms 13,399 5+ bedrooms
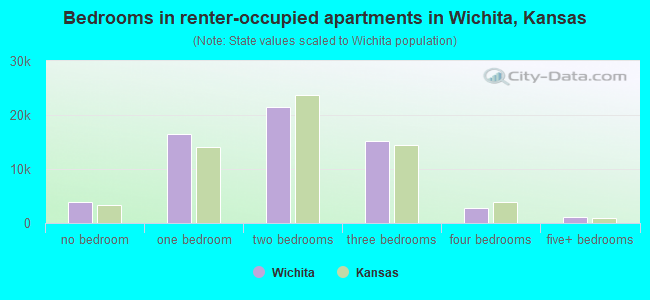
Bedrooms in renter-occupied apartments in Wichita, Kansas
3,817 no bedroom 16,419 1 bedroom 21,558 2 bedrooms 15,104 3 bedrooms 2,766 4 bedrooms 1,074 5+ bedrooms
Owner-occupied Renter-occupied
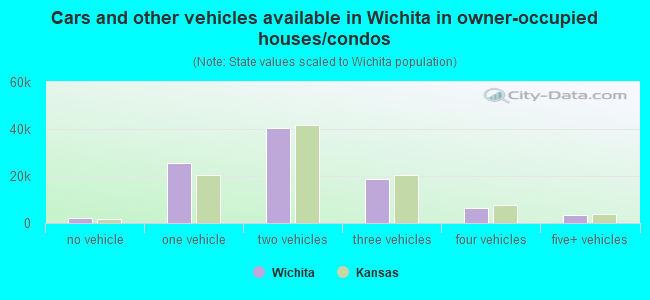
Cars and other vehicles available in Wichita in owner-occupied houses/condos
2,255 no vehicle 25,368 1 vehicle 40,296 2 vehicles 18,852 3 vehicles 6,418 4 vehicles 3,219 5+ vehicles
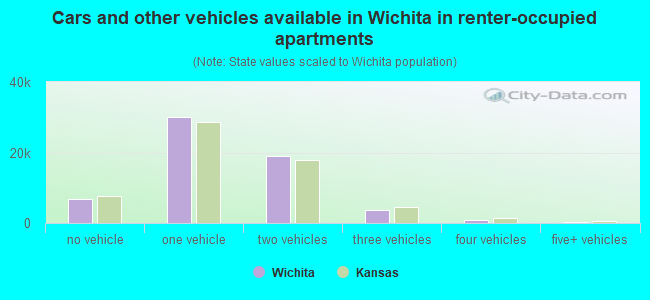
Cars and other vehicles available in Wichita in renter-occupied apartments
6,873 no vehicle 30,138 1 vehicle 19,081 2 vehicles 3,577 3 vehicles 812 4 vehicles 257 5+ vehicles
Owner-occupied Renter-occupied
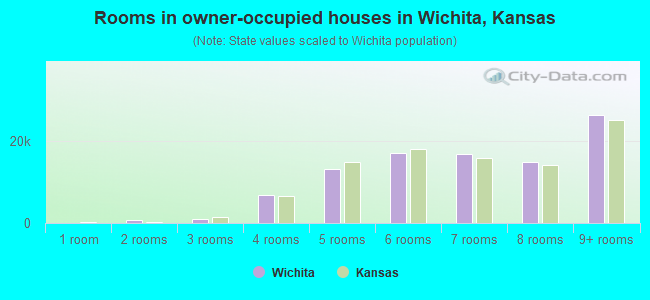
Rooms in owner-occupied houses in Wichita, Kansas
115 1 room 636 2 rooms 938 3 rooms 6,697 4 rooms 13,184 5 rooms 16,999 6 rooms 16,792 7 rooms 14,822 8 rooms 26,225 9+ rooms
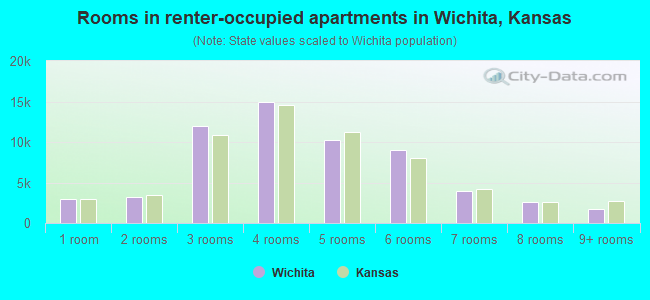
Rooms in renter-occupied apartments in Wichita, Kansas
2,980 1 room 3,256 2 rooms 11,966 3 rooms 14,948 4 rooms 10,291 5 rooms 9,034 6 rooms 3,968 7 rooms 2,616 8 rooms 1,679 9+ rooms
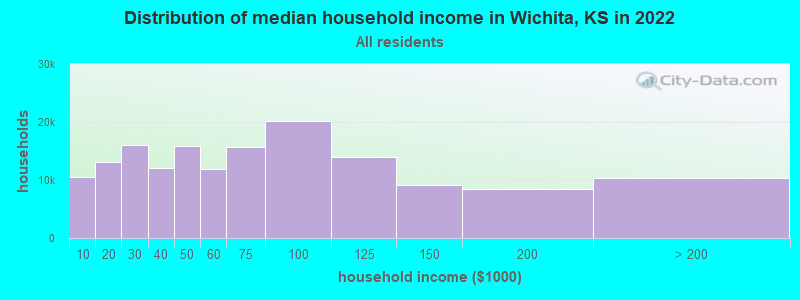
Wichita, KS household income distribution 10,519 Less than $10,00013,064 $10,000 to $19,99915,993 $20,000 to $29,99912,128 $30,000 to $39,99915,812 $40,000 to $49,99911,833 $50,000 to $59,99915,758 $60,000 to $74,99920,183 $75,000 to $99,99913,892 $100,000 to $124,9999,182 $125,000 to $149,9998,431 $150,000 to $199,99910,351 $200,000 or more
Home value of owner - occupied houses in 2022 in Wichita, KS 1,928 Less than $10,0001,020 $10,000 to $14,999501 $15,000 to $19,999144 $20,000 to $24,999569 $25,000 to $29,999445 $30,000 to $34,999284 $35,000 to $39,9991,289 $40,000 to $49,9991,934 $50,000 to $59,9992,252 $60,000 to $69,9992,535 $70,000 to $79,9994,017 $80,000 to $89,9993,480 $90,000 to $99,9999,316 $100,000 to $124,9996,775 $125,000 to $149,9998,544 $150,000 to $174,9996,198 $175,000 to $199,99914,221 $200,000 to $249,9999,001 $250,000 to $299,99910,548 $300,000 to $399,9995,108 $400,000 to $499,9993,905 $500,000 to $749,999960 $750,000 to $999,999516 $1,000,000 to $1,499,999221 $1,500,000 to $1,999,999697 $2,000,000 or moreRent paid by renters in 2022 in Wichita, KS 748 Less than $100109 $100 to $149695 $150 to $199411 $250 to $299500 $300 to $349906 $350 to $3992,809 $400 to $4493,336 $450 to $4993,476 $500 to $5493,993 $550 to $5994,321 $600 to $6497,330 $650 to $6993,885 $700 to $7495,254 $750 to $7996,720 $800 to $8995,058 $900 to $9995,071 $1,000 to $1,2492,255 $1,250 to $1,499742 $1,500 to $1,999451 $2,000 to $2,49964 $2,500 to $2,999244 $3,000 to $3,499237 $3,500 or more2,123 No cash rent
Percentage of workers working in this county: 94.3%Number of people working at home: 13,266 (7.0% of all workers )
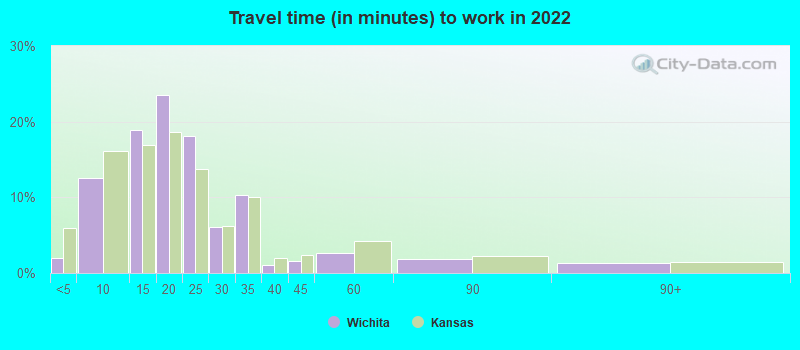
Travel time to work (commute)
Less than 5 minutes: 3,6825 to 9 minutes: 23,66110 to 14 minutes: 37,47715 to 19 minutes: 46,95220 to 24 minutes: 32,45925 to 29 minutes: 7,55230 to 34 minutes: 12,96735 to 39 minutes: 1,15440 to 44 minutes: 1,37245 to 59 minutes: 4,11760 to 89 minutes: 2,08590 or more minutes: 2,678
Means of transportation to work:
Drove a car alone: 172,964 (81.0%)Carpooled: 20,428 (9.6%)Bus : 673 (0.3%)Light rail, streetcar or trolley : 571 (0.3%)Ferryboat: 68 (0.0%)Taxi: 2,635 (1.2%)Bicycle: 724 (0.3%)Walked: 2,158 (1.0%)Worked at home: 13,266 (6.2%)
Unemployment by race in 2022
Unemployment rate for White non-Hispanic residents 5.2% Males4.7% FemalesUnemployment rate for Black residents 9.8% Males5.5% FemalesUnemployment rate for American Indian and Alaska Native residents 10.8% Males5.4% FemalesUnemployment rate for Asian residents 6.9% Males3.7% FemalesUnemployment rate for other race residents 14.0% Males5.0% FemalesUnemployment rate for two or more race residents 6.1% Males11.4% FemalesUnemployment rate for Hispanic or Latino residents 4.5% Males9.1% Females
Year of entry for the foreign-born population in Wichita, Kansas
11,819 2010 or later 10,909 2000 to 2009 8,915 1990 to 1999 6,779 1980 to 1989 3,749 1970 to 1979 1,970 Before 1970
First ancestries reported:
German: 25,888 (13.8%)
English: 15,205 (8.1%)
American: 15,109 (8.0%)
Irish: 8,754 (4.7%)
European: 5,075 (2.7%)
Italian: 2,219 (1.2%)
African: 1,915 (1.0%)
Scotch-Irish: 1,549 (0.8%)
Scottish: 1,471 (0.8%)
Lebanese: 1,079 (0.6%)
French: 1,038 (0.6%)
Swedish: 1,013 (0.5%)
Polish: 943 (0.5%)
Norwegian: 867 (0.5%)
British: 768 (0.4%)
Dutch: 687 (0.4%)
French Canadian: 492 (0.3%)
Scandinavian: 454 (0.2%)
Hungarian: 309 (0.2%)
Kenyan: 279 (0.1%)
Czech: 271 (0.1%)
Nigerian: 253 (0.1%)
Danish: 241 (0.1%)
Welsh: 213 (0.1%)
Moroccan: 198 (0.1%)
Ghanaian: 198 (0.1%)
Iranian: 176 (0.09%)
Bulgarian: 159 (0.08%)
Russian: 146 (0.08%)
Swiss: 143 (0.08%)
Portuguese: 135 (0.07%)
Pennsylvania German: 119 (0.06%)
Eastern European: 116 (0.06%)
Northern European: 115 (0.06%)
Greek: 111 (0.06%)
Canadian: 108 (0.06%)
Ukrainian: 101 (0.05%)
Czechoslovakian: 99 (0.05%)
Jamaican: 97 (0.05%)
Belgian: 93 (0.05%)
Egyptian: 81 (0.04%)
Syrian: 80 (0.04%)
Haitian: 79 (0.04%)
Sudanese: 76 (0.04%)
Arab: 72 (0.04%)
Cajun: 69 (0.04%)
Slovak: 64 (0.03%)
Palestinian: 62 (0.03%)
Celtic: 60 (0.03%)
Brazilian: 60 (0.03%)
German Russian: 58 (0.03%)
Croatian: 55 (0.03%)
Jordanian: 54 (0.03%)
Romanian: 46 (0.02%)
Austrian: 42 (0.02%)
Ethiopian: 41 (0.02%)
Ugandan: 41 (0.02%)
Icelander: 39 (0.02%)
Turkish: 25 (0.01%)
Armenian: 23 (0.01%)
New Zealander: 23 (0.01%)
Zimbabwean: 22 (0.01%)
South African: 21 (0.01%)
Finnish: 17 (0.01%)
Estonian: 14 (0.01%)
Luxembourger: 13 (0.01%)
Slovene: 12 (0.01%)
Latvian: 12 (0.01%)
Australian: 12 (0.01%)
Yugoslavian: 10 (0.01%)
Most common places of birth for foreign-born residents (%): Mexico Wichita:
40.9% (16,391)Kansas:
39.2% (81,282)
Vietnam Wichita:
15.4% (6,162)Kansas:
5.5% (11,323)
Philippines Wichita:
3.3% (1,314)Kansas:
2.6% (5,492)
India Wichita:
2.7% (1,098)Kansas:
6.5% (13,547)
El Salvador Wichita:
2.0% (800)Kansas:
2.2% (4,488)
Guatemala Wichita:
1.6% (650)Kansas:
3.5% (7,355)
China, excluding Hong Kong and Taiwan Wichita:
1.6% (624)Kansas:
3.9% (8,053)
Place of birth for U.S.-born residents:
This state: 247,886Other state: 103,220Northeast: 8,568Midwest: 31,868South: 39,306West: 23,478 85.6% of Wichita residents lived in the same house 1 years ago.
Out of people who lived in different houses, 40.5% lived in this county.
Out of people who lived in different counties, 51.9% lived in Kansas.
Wichita:
85.6%State average:
85.3%
Education attainment for males 25 years and older:
No schooling: 3,962Nursery to 4th grade: 3665th and 6th grade: 1,3167th and 8th grade: 1,2089th grade: 98210th grade: 1,84511th grade: 2,86912th grade, no diploma: 2,397High school graduate (or equivalency): 32,483Less than 1 year of college: 9,942Some college more than 1 year, no degree: 18,424Associate degree: 10,050Bachelor's degree: 25,495Master's degree: 9,635Professional school degree: 3,099Doctorate degree: 1,294
Education attainment for females 25 years and older:
No schooling: 4,128Nursery to 4th grade: 3175th and 6th grade: 6947th and 8th grade: 1,5749th grade: 87610th grade: 2,36511th grade: 1,39912th grade, no diploma: 2,039High school graduate (or equivalency): 31,970Less than 1 year of college: 13,205Some college more than 1 year, no degree: 17,871Associate degree: 10,823Bachelor's degree: 29,198Master's degree: 13,280Professional school degree: 2,554Doctorate degree: 1,234
Housing units in structures:
One, detached: 119,169One, attached: 7,109Two: 6,1573 or 4: 9,2875 to 9: 5,40810 to 19: 9,89820 to 49: 6,95250 or more: 8,189Mobile homes: 5,477Median worth of mobile homes: $29,421
Housing units lacking complete plumbing facilities in 2022: 1.8%Housing units lacking complete kitchen facilities in 2022: 2.7%House/condo owner moved in on average 12 years ago
Renter moved in on average 2 years ago
Private vs. public school enrollment:
Students in private schools in grades 1 to 8 (elementary and middle school): 6,354 Students in private schools in grades 9 to 12 (high school): 2,635 Students in private undergraduate colleges: 2,675