Williston, ND (North Dakota) Houses and Residents
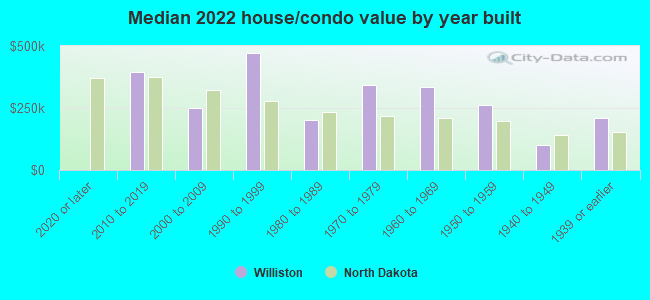
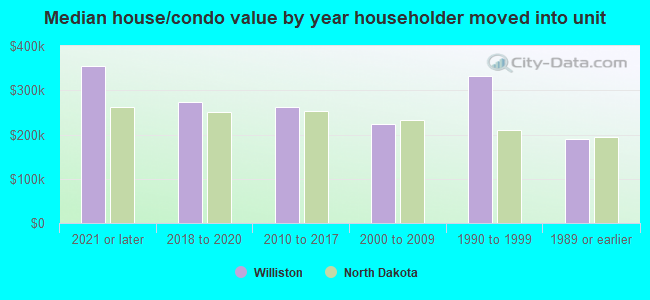
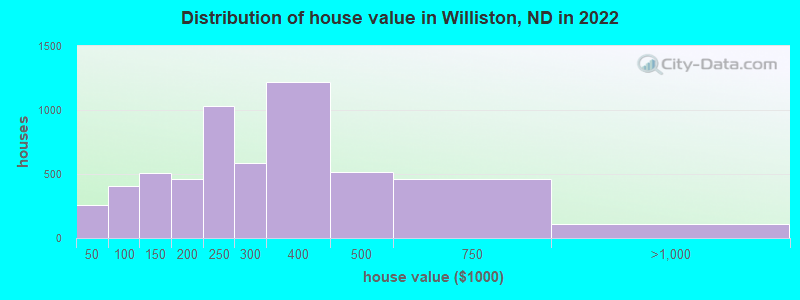
Estimated median house or condo value in 2022: $256,797 (it was $56,600 in 2000 )
Williston:
$256,797North Dakota:
$243,100
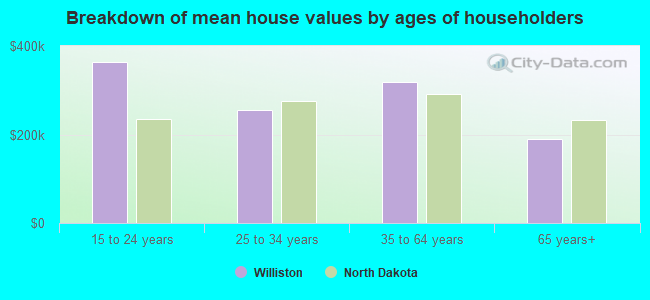
Lower value quartile - upper value quartile: $164,295 - $379,908Mean price in 2022: Detached houses: $243,543 Here:
$243,543State:
$284,144
Townhouses or other attached units: $213,123 Here:
$213,123State:
$250,572
In 2-unit structures: $229,338 Here:
$229,338State:
$200,034
Mobile homes: $44,162 Here:
$44,162State:
$85,388
Total population: 24,562 (Urban population: 12,508 (all inside urban clusters), Rural population: 71 (all nonfarm) )
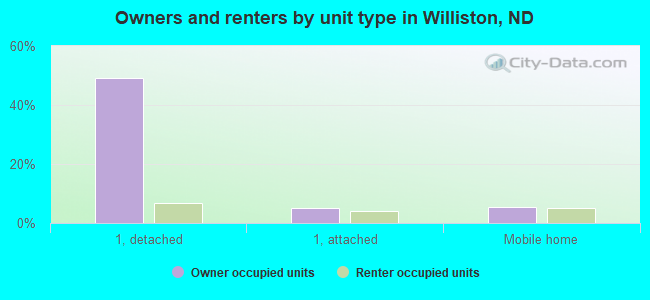
Houses: 14,945 (11,573 occupied: 5,383 owner occupied, 6,434 renter occupied )
% of renters here:
54%State:
35%
Housing density: 2,143 houses/condos per square mile
Median price asked for vacant for-sale houses and condos in 2022: $338,525.
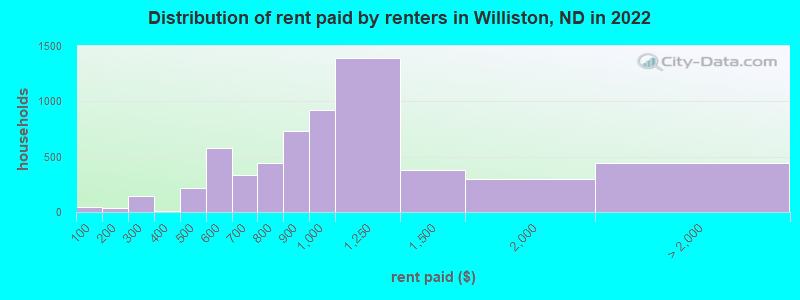
Median contract rent in 2022: $951 (lower quartile is $739, upper quartile is $1,075)
Median rent asked for vacant for-rent units in 2022: $1,105
Median gross rent in Williston, ND in 2022: $1,036
Housing units in Williston with a mortgage: 3,350 (122 second mortgage, 40 home equity loan, 22 both second mortgage and home equity loan )Houses without a mortgage: 75
Median household income for houses/condos with a mortgage: $137,521
Median household income for apartments without a mortgage: $69,441
Median monthly housing costs: $1,073
Data:
Median house or condo value ($)
Median house or condo value ($ change since 2000)
Median house or condo value ($) - White
Median house or condo value ($) - Black or African American
Median house or condo value ($) - Asian
Median house or condo value ($) - Hispanic or Latino
Median house or condo value ($) - American Indian and Alaska Native
Median house or condo value ($) - Multirace
Median house or condo value ($) - Other Race
Median price asked for mobile homes ($)
Household density (households per square mile)
Mean house or condo value by units in structure - 1, detached ($)
Mean house or condo value by units in structure - 1, attached ($)
Mean house or condo value by units in structure - 2 ($)
Mean house or condo value by units in structure by units in structure - 3 or 4 ($)
Mean house or condo value by units in structure - 5 or more ($)
Mean house or condo value by units in structure - Boat, RV, van, etc. ($)
Mean house or condo value by units in structure - Mobile home ($)
Median contract rent ($)
Median contract rent - Lower quartile ($)
Median contract rent - Upper quartile ($)
Median gross rent ($)
Urban houses (%)
Rural houses (%)
Houses occupied (%)
Houses occupied (% change since 2000)
Houses owner occupied (%)
Houses owner occupied (% change since 2000)
Houses renter occupied (%)
Houses renter occupied (% change since 2000)
Vacant housing units - For rent (%)
Vacant housing units - For rent (% change since 2000)
Vacant housing units - For sale only (%)
Vacant housing units - For sale only (% change since 2000)
Vacant housing units - Rented or sold, not occupied (%)
Vacant housing units - Rented or sold, not occupied (% change since 2000)
Vacant housing units - For seasonal, recreational, or occasional use (%)
Vacant housing units - For seasonal, recreational, or occasional use (% change since 2000)
Vacant housing units - For migrant workers (%)
Vacant housing units - For migrant workers (% change since 2000)
Vacant housing units - Other vacant (%)
Vacant housing units - Other vacant (% change since 2000)
Median monthly housing costs ($)
Median household income for houses/condos with a mortgage ($)
Median household income for houses/condos without a mortgage ($)
Median household income ($)
Median household income ($) - White
Median household income ($) - Black or African American
Median household income ($) - Asian
Median household income ($) - Hispanic or Latino
Median household income ($) - American Indian and Alaska Native
Median household income ($) - Multirace
Median household income ($) - Other Race
Mortgage status - with mortgage (%)
Mortgage status - with second mortgage (%)
Mortgage status - with home equity loan (%)
Mortgage status - with both second mortgage and home equity loan (%)
Mortgage status - without a mortgage (%)
Median year house/condo built
Median year apartment built
Household type by relationship - Male householder living alone (%)
Household type by relationship - Male householder not living alone (%)
Household type by relationship - Female householder living alone (%)
Household type by relationship - Female householder not living alone (%)
Household type by relationship - Opposite-Sex spouse (%)
Household type by relationship - Same-Sex spouse (%)
Household type by relationship - Opposite-Sex unmarried partner (%)
Household type by relationship - Same-Sex unmarried partner (%)
Household type by relationship - In group quarters (%)
Size of family households - 2-person household (%)
Size of family households - 3-person household (%)
Size of family households - 4-person household (%)
Size of family households - 5-person household (%)
Size of family households - 6-person household (%)
Size of family households - 7-or-more-person household (%)
Size of nonfamily households - 1-person household (%)
Size of nonfamily households - 2-person household (%)
Size of nonfamily households - 3-person household (%)
Size of nonfamily households - 4-person household (%)
Size of nonfamily households - 5-person household (%)
Size of nonfamily households - 6-person household (%)
Size of nonfamily households - 7-or-moreperson household (%)
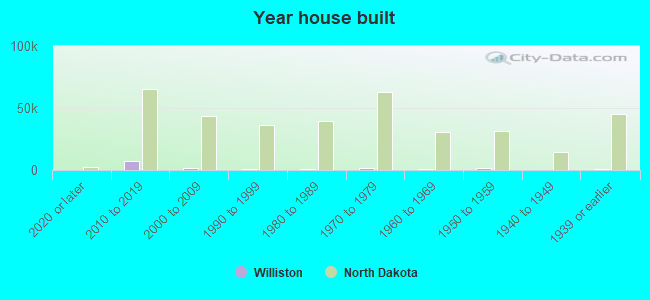
Year house built - Built 2010 or later (%)
Year house built - Built 2000 to 2009 (%)
Year house built - Built 1990 to 1999 (%)
Year house built - Built 1980 to 1989 (%)
Year house built - Built 1970 to 1979 (%)
Year house built - Built 1960 to 1969 (%)
Year house built - Built 1950 to 1959 (%)
Year house built - Built 1940 to 1949 (%)
Year house built - Built 1939 or earlier (%)
Median number of rooms in houses and condos
Median number of rooms in apartments
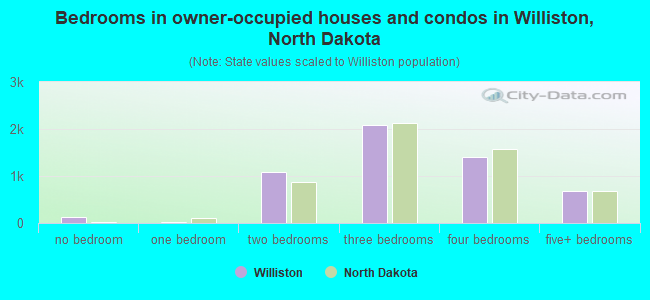
Median number of bedrooms in owner occupied houses
Mean number of bedrooms in owner occupied houses
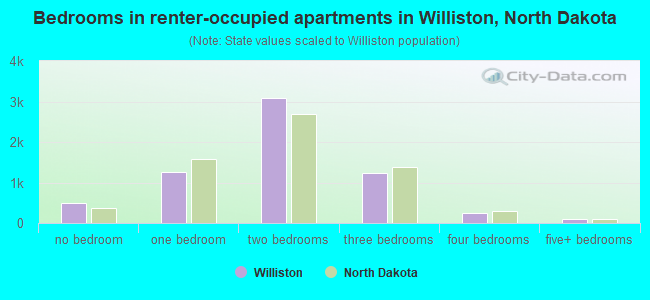
Median number of bedrooms in renter occupied houses
Mean number of bedrooms in renter occupied houses
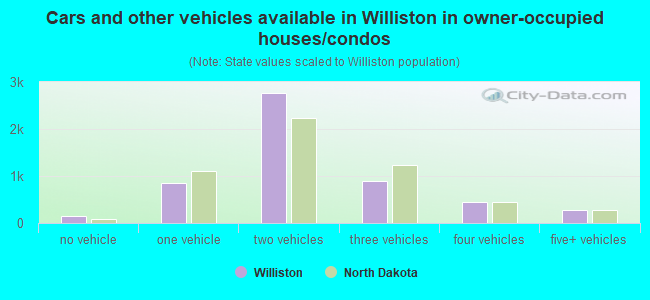
Median number of vehichles in owner occupied houses
Mean number of vehichles in owner occupied houses
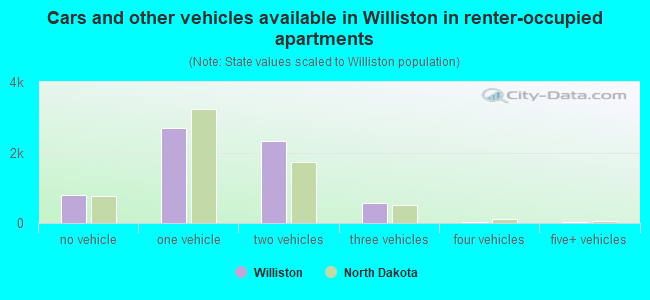
Median number of vehichles in renter occupied houses
Mean number of vehichles in renter occupied houses
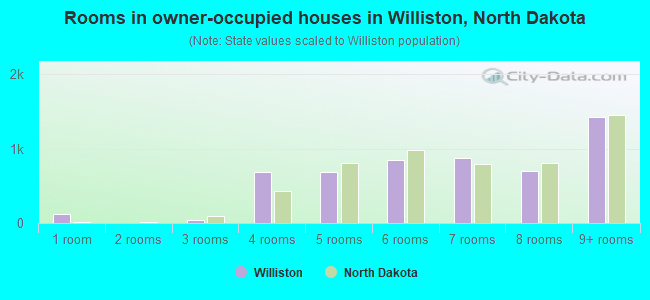
Rooms in owner-occupied houses - 1 room (%)
Rooms in owner-occupied houses - 2 rooms (%)
Rooms in owner-occupied houses - 3 rooms (%)
Rooms in owner-occupied houses - 4 rooms (%)
Rooms in owner-occupied houses - 5 rooms (%)
Rooms in owner-occupied houses - 6 rooms (%)
Rooms in owner-occupied houses - 7 rooms (%)
Rooms in owner-occupied houses - 8 rooms (%)
Rooms in owner-occupied houses - 9+ rooms (%)
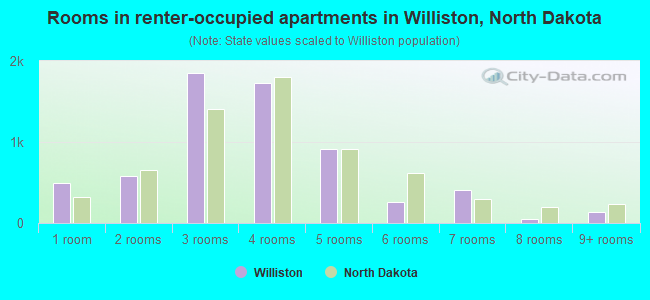
Rooms in renter-occupied houses - 1 room (%)
Rooms in renter-occupied houses - 2 rooms (%)
Rooms in renter-occupied houses - 3 rooms (%)
Rooms in renter-occupied houses - 4 rooms (%)
Rooms in renter-occupied houses - 5 rooms (%)
Rooms in renter-occupied houses - 6 rooms (%)
Rooms in renter-occupied houses - 7 rooms (%)
Rooms in renter-occupied houses - 8 rooms (%)
Rooms in renter-occupied houses - 9+ rooms (%)
Bedrooms in owner-occupied houses - no bedrooms (%)
Bedrooms in owner-occupied houses - 1 bedroom (%)
Bedrooms in owner-occupied houses - 2 bedrooms (%)
Bedrooms in owner-occupied houses - 3 bedrooms (%)
Bedrooms in owner-occupied houses - 4 bedrooms (%)
Bedrooms in owner-occupied houses - 5+ bedrooms (%)
Bedrooms in renter-occupied houses - no bedrooms (%)
Bedrooms in renter-occupied houses - 1 bedroom (%)
Bedrooms in renter-occupied houses - 2 bedrooms (%)
Bedrooms in renter-occupied houses - 3 bedrooms (%)
Bedrooms in renter-occupied houses - 4 bedrooms (%)
Bedrooms in renter-occupied houses - 5+ bedrooms (%)
Vehicles available in owner-occupied houses - no vehicle available (%)
Vehicles available in owner-occupied houses - 1 vehicle available(%)
Vehicles available in owner-occupied houses - 2 Vehicles available (%)
Vehicles available in owner-occupied houses - 3 Vehicles available (%)
Vehicles available in owner-occupied houses - 4 Vehicles available (%)
Vehicles available in owner-occupied houses - 5+ Vehicles available (%)
Vehicles available in renter-occupied houses - no vehicle available (%)
Vehicles available in renter-occupied houses - 1 vehicle available (%)
Vehicles available in renter-occupied houses - 2 Vehicles available (%)
Vehicles available in renter-occupied houses - 3 Vehicles available (%)
Vehicles available in renter-occupied houses - 4 Vehicles available (%)
Vehicles available in renter-occupied houses - 5+ Vehicles available (%)
Housing units in structures - 1, detached (%)
Housing units in structures - 1, attached (%)
Housing units in structures - 2 (%)
Housing units in structures - 3 or 4 (%)
Housing units in structures - 5 to 9 (%)
Housing units in structures - 10 to 19 (%)
Housing units in structures - 20 to 49 (%)
Housing units in structures - 50 or more (%)
Housing units in structures - Mobile home (%)
Housing units in structures - Boat, RV, van, etc. (%)
Housing units in structures - Owners - 1, detached (%)
Housing units in structures - Owners - 1, attached (%)
Housing units in structures - Owners - 2 (%)
Housing units in structures - Owners - 3 or 4 (%)
Housing units in structures - Owners - 5 to 9 (%)
Housing units in structures - Owners - 10 to 19 (%)
Housing units in structures - Owners - 20 to 49 (%)
Housing units in structures - Owners - 50 or more (%)
Housing units in structures - Owners - Mobile home (%)
Housing units in structures - Owners - Boat, RV, van, etc. (%)
Housing units in structures - Renters - 1, detached (%)
Housing units in structures - Renters - 1, attached (%)
Housing units in structures - Renters - 2 (%)
Housing units in structures - Renters - 3 or 4 (%)
Housing units in structures - Renters - 5 to 9 (%)
Housing units in structures - Renters - 10 to 19 (%)
Housing units in structures - Renters - 20 to 49 (%)
Housing units in structures - Renters - 50 or more (%)
Housing units in structures - Renters - Mobile home (%)
Housing units in structures - Renters - Boat, RV, van, etc. (%)
House/condo owner moved in on average (years ago)
Renter moved in on average (years ago)
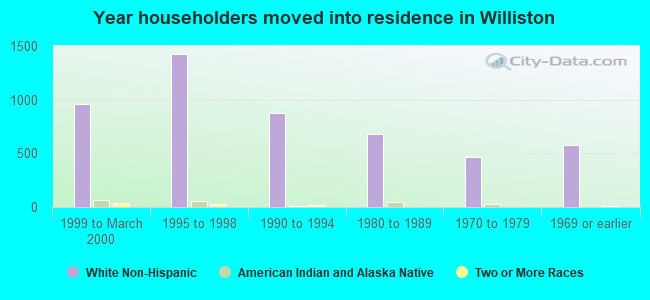
Year householder moved into unit - Moved in 1999 to March 2000 (%)
Year householder moved into unit - Moved in 1999 to March 2000 (%) - White
Year householder moved into unit - Moved in 1999 to March 2000 (%) - Black or African American
Year householder moved into unit - Moved in 1999 to March 2000 (%) - Asian
Year householder moved into unit - Moved in 1999 to March 2000 (%) - Hispanic or Latino
Year householder moved into unit - Moved in 1999 to March 2000 (%) - American Indian and Alaska Native
Year householder moved into unit - Moved in 1999 to March 2000 (%) - Multirace
Year householder moved into unit - Moved in 1999 to March 2000 (%) - Other Race
Year householder moved into unit - Moved in 1995 to 1998 (%)
Year householder moved into unit - Moved in 1995 to 1998 (%) - White
Year householder moved into unit - Moved in 1995 to 1998 (%) - Black or African American
Year householder moved into unit - Moved in 1995 to 1998 (%) - Asian
Year householder moved into unit - Moved in 1995 to 1998 (%) - Hispanic or Latino
Year householder moved into unit - Moved in 1995 to 1998 (%) - American Indian and Alaska Native
Year householder moved into unit - Moved in 1995 to 1998 (%) - Multirace
Year householder moved into unit - Moved in 1995 to 1998 (%) - Other Race
Year householder moved into unit - Moved in 1990 to 1994 (%)
Year householder moved into unit - Moved in 1990 to 1994 (%) - White
Year householder moved into unit - Moved in 1990 to 1994 (%) - Black or African American
Year householder moved into unit - Moved in 1990 to 1994 (%) - Asian
Year householder moved into unit - Moved in 1990 to 1994 (%) - Hispanic or Latino
Year householder moved into unit - Moved in 1990 to 1994 (%) - American Indian and Alaska Native
Year householder moved into unit - Moved in 1990 to 1994 (%) - Multirace
Year householder moved into unit - Moved in 1990 to 1994 (%) - Other Race
Year householder moved into unit - Moved in 1980 to 1989 (%)
Year householder moved into unit - Moved in 1980 to 1989 (%) - White
Year householder moved into unit - Moved in 1980 to 1989 (%) - Black or African American
Year householder moved into unit - Moved in 1980 to 1989 (%) - Asian
Year householder moved into unit - Moved in 1980 to 1989 (%) - Hispanic or Latino
Year householder moved into unit - Moved in 1980 to 1989 (%) - American Indian and Alaska Native
Year householder moved into unit - Moved in 1980 to 1989 (%) - Multirace
Year householder moved into unit - Moved in 1980 to 1989 (%) - Other Race
Year householder moved into unit - Moved in 1970 to 1979 (%)
Year householder moved into unit - Moved in 1970 to 1979 (%) - White
Year householder moved into unit - Moved in 1970 to 1979 (%) - Black or African American
Year householder moved into unit - Moved in 1970 to 1979 (%) - Asian
Year householder moved into unit - Moved in 1970 to 1979 (%) - Hispanic or Latino
Year householder moved into unit - Moved in 1970 to 1979 (%) - American Indian and Alaska Native
Year householder moved into unit - Moved in 1970 to 1979 (%) - Multirace
Year householder moved into unit - Moved in 1970 to 1979 (%) - Other Race
Year householder moved into unit - Moved in 1969 or earlier (%)
Year householder moved into unit - Moved in 1969 or earlier (%) - White
Year householder moved into unit - Moved in 1969 or earlier (%) - Black or African American
Year householder moved into unit - Moved in 1969 or earlier (%) - Asian
Year householder moved into unit - Moved in 1969 or earlier (%) - Hispanic or Latino
Year householder moved into unit - Moved in 1969 or earlier (%) - American Indian and Alaska Native
Year householder moved into unit - Moved in 1969 or earlier (%) - Multirace
Year householder moved into unit - Moved in 1969 or earlier (%) - Other Race
Housing units lacking complete plumbing facilities (%)
Housing units lacking complete kitchen facilities (%)
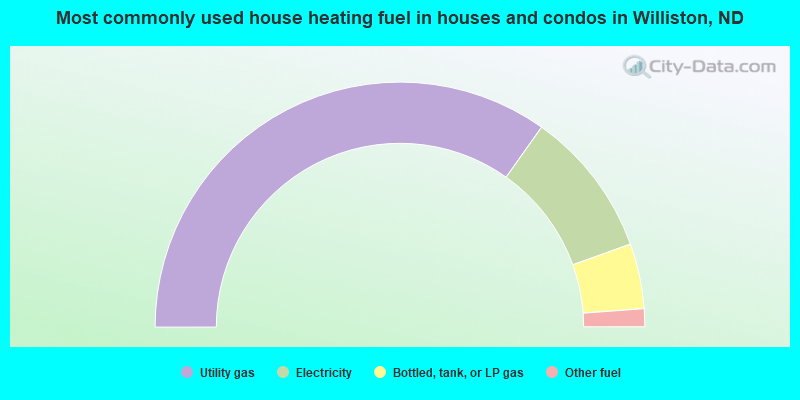
House heating fuel used in houses and condos - Utility gas (%)
House heating fuel used in houses and condos - Bottled, tank, or LP gas (%)
House heating fuel used in houses and condos - Electricity (%)
House heating fuel used in houses and condos - Fuel oil, kerosene, etc. (%)
House heating fuel used in houses and condos - Coal or coke (%)
House heating fuel used in houses and condos - Wood (%)
House heating fuel used in houses and condos - Solar energy (%)
House heating fuel used in houses and condos - Other fuel (%)
House heating fuel used in houses and condos - No fuel used (%)
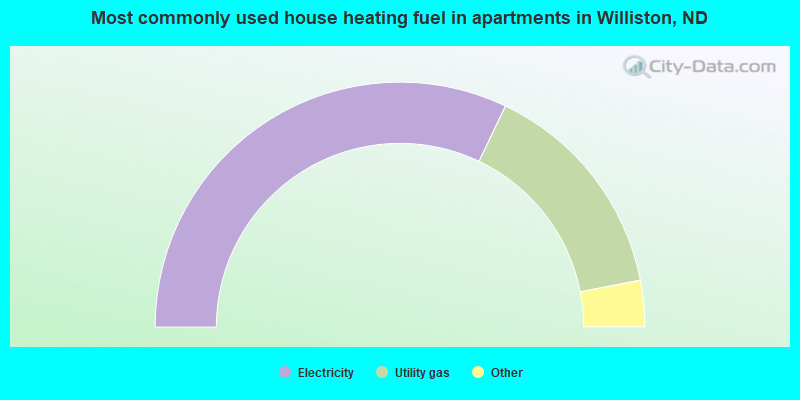
House heating fuel used in apartments - Utility gas (%)
House heating fuel used in apartments - Bottled, tank, or LP gas (%)
House heating fuel used in apartments - Electricity (%)
House heating fuel used in apartments - Fuel oil, kerosene, etc. (%)
House heating fuel used in apartments - Coal or coke (%)
House heating fuel used in apartments - Wood (%)
House heating fuel used in apartments - Solar energy (%)
House heating fuel used in apartments - Other fuel (%)
House heating fuel used in apartments - No fuel used (%)
Latest news about housing in Williston, ND collected exclusively by city-data.com from local newspapers, TV, and radio stations
Median year house/condo built: 1966Median year apartment built: 2016Household type by relationship:
Households: 27,868
Male householders: 6,907 (2,600 living alone ), Female householders: 4,537 (1,353 living alone )4,668 spouses (4,646 opposite-sex spouses ), 959 unmarried partners , (959 opposite-sex unmarried partners ), 8,650 children (8,056 natural , 202 adopted , 391 stepchildren ), 267 grandchildren , 286 brothers or sisters , 135 parents , 72 foster children , 224 other relatives , 689 non-relatives In group quarters: 468
Size of family households: 2,711 2-persons , 1,618 3-persons , 1,341 4-persons , 611 5-persons , 211 6-persons , 299 7-or-more-persons .
Size of nonfamily households: 4,095 1-person , 930 2-persons , 78 3-persons .
5,357 married couples with children. single-parent households (1,065 men , 821 women ).
87.2% of residents of Williston speak English at home. of residents speak Spanish at home (61% speak English very well , 23% speak English well , 16% speak English not well ).of residents speak other Indo-European language at home (68% speak English very well , 15% speak English well , 17% speak English not well ).of residents speak Asian or Pacific Island language at home (59% speak English very well , 41% speak English well ).of residents speak other language at home (76% speak English very well , 24% speak English well ).
Foreign born population: 3,327 (11.9%)of them are naturalized citizens )
Median number of rooms in houses and condos:
Median number of rooms in apartments
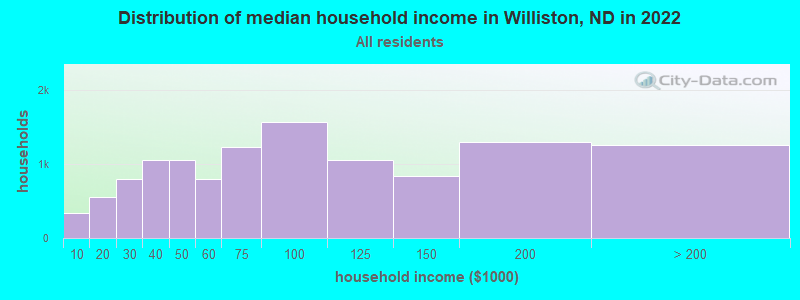
Williston, ND household income distribution 332 Less than $10,000554 $10,000 to $19,999794 $20,000 to $29,9991,051 $30,000 to $39,9991,057 $40,000 to $49,999796 $50,000 to $59,9991,227 $60,000 to $74,9991,564 $75,000 to $99,9991,048 $100,000 to $124,999841 $125,000 to $149,9991,296 $150,000 to $199,9991,254 $200,000 or more
Home value of owner - occupied houses in 2022 in Williston, ND 65 Less than $10,000108 $20,000 to $24,9998 $25,000 to $29,99957 $30,000 to $34,9998 $35,000 to $39,9997 $40,000 to $49,99997 $50,000 to $59,999164 $60,000 to $69,99933 $80,000 to $89,999105 $90,000 to $99,999217 $100,000 to $124,999291 $125,000 to $149,999336 $150,000 to $174,999125 $175,000 to $199,9991,034 $200,000 to $249,999587 $250,000 to $299,9991,218 $300,000 to $399,999512 $400,000 to $499,999459 $500,000 to $749,999113 $750,000 to $999,999Rent paid by renters in 2022 in Williston, ND 45 Less than $10039 $150 to $199141 $200 to $2499 $350 to $399215 $400 to $449176 $500 to $549397 $550 to $599118 $600 to $649210 $650 to $699299 $700 to $749141 $750 to $799727 $800 to $899919 $900 to $9991,392 $1,000 to $1,249377 $1,250 to $1,499294 $1,500 to $1,999142 $2,000 to $2,49955 $2,500 to $2,999246 No cash rent
Percentage of workers working in this county: 97.1%Number of people working at home: 452 (3.0% of all workers )
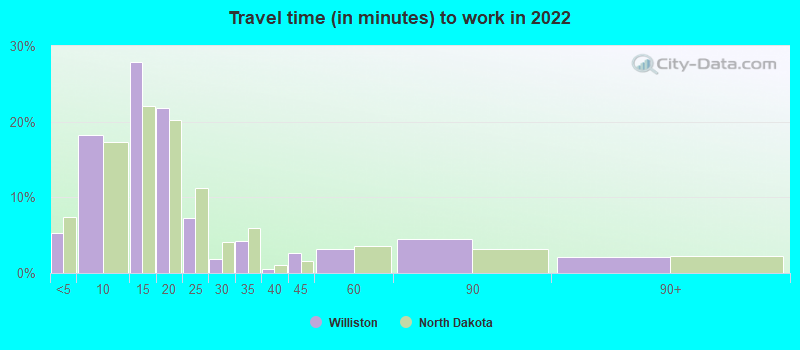
Travel time to work (commute)
Less than 5 minutes: 8035 to 9 minutes: 2,99210 to 14 minutes: 4,04615 to 19 minutes: 3,93420 to 24 minutes: 88725 to 29 minutes: 31730 to 34 minutes: 42135 to 39 minutes: 1940 to 44 minutes: 20145 to 59 minutes: 17260 to 89 minutes: 41390 or more minutes: 122
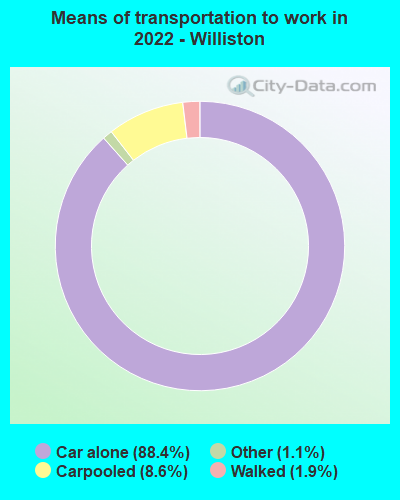
Means of transportation to work:
Drove a car alone: 13,486 (84.8%)Carpooled: 1,374 (8.6%)Bus : 4 (0.0%)Long-distance train or commuter rail : 8 (0.1%)Taxi: 129 (0.8%)Walked: 317 (2.0%)Worked at home: 452 (2.8%)
Unemployment by race in 2022
Unemployment rate for White non-Hispanic residents 0.9% Males3.9% FemalesUnemployment rate for other race residents 2.0% MalesUnemployment rate for two or more race residents 6.5% MalesUnemployment rate for Hispanic or Latino residents 7.6% Males
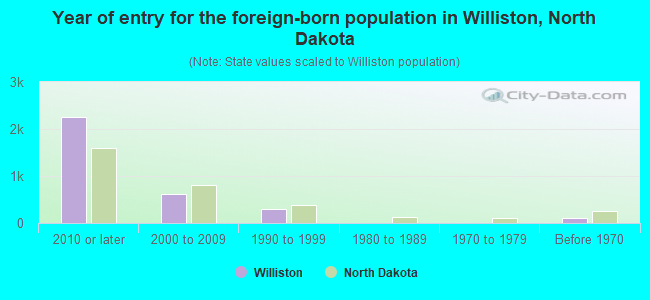
Year of entry for the foreign-born population in Williston, North Dakota
2,264 2010 or later 613 2000 to 2009 291 1990 to 1999 0 1980 to 1989 0 1970 to 1979 108 Before 1970
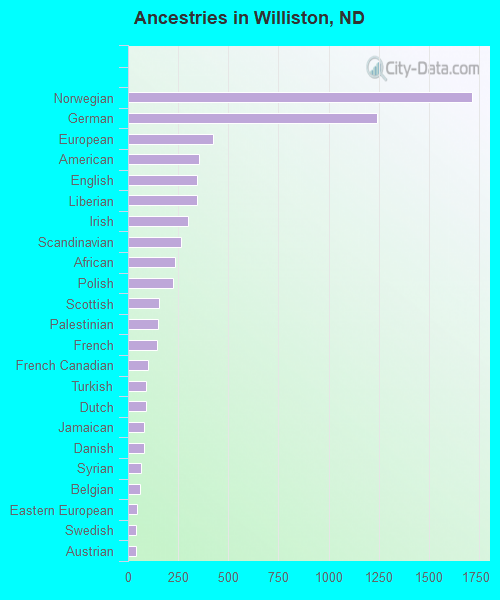
First ancestries reported:
Norwegian: 1,714 (18.4%)
German: 1,243 (13.3%)
European: 422 (4.5%)
American: 353 (3.8%)
English: 344 (3.7%)
Liberian: 342 (3.7%)
Irish: 300 (3.2%)
Scandinavian: 265 (2.8%)
African: 234 (2.5%)
Polish: 226 (2.4%)
Scottish: 154 (1.6%)
Palestinian: 148 (1.6%)
French: 146 (1.6%)
French Canadian: 101 (1.1%)
Turkish: 91 (1.0%)
Dutch: 88 (0.9%)
Jamaican: 80 (0.9%)
Danish: 78 (0.8%)
Syrian: 65 (0.7%)
Belgian: 60 (0.6%)
Eastern European: 45 (0.5%)
Swedish: 42 (0.4%)
Austrian: 39 (0.4%)
Northern European: 12 (0.1%)
Australian: 11 (0.1%)
Finnish: 10 (0.1%)
Scotch-Irish: 10 (0.1%)
Canadian: 4 (0.04%)
Somali: 1 (0.01%) Most common places of birth for foreign-born residents (%): Mexico Williston:
22.5% (718)North Dakota:
8.0% (2,889)
Democratic Republic of Congo (Zaire) Williston:
15.0% (478)North Dakota:
1.7% (595)
Philippines Williston:
8.0% (254)North Dakota:
6.9% (2,472)
France Williston:
6.3% (200)North Dakota:
0.7% (239)
Peru Williston:
5.8% (185)North Dakota:
0.7% (245)
Canada Williston:
5.4% (173)North Dakota:
8.7% (3,118)
Liberia Williston:
4.7% (150)North Dakota:
8.6% (3,094)
Africa, n.e.c. Williston:
4.6% (147)North Dakota:
1.3% (456)
Dominican Republic Williston:
3.0% (95)North Dakota:
0.5% (164)
Turkey Williston:
2.9% (91)North Dakota:
0.3% (112)
Ghana Williston:
2.8% (90)North Dakota:
1.0% (351)
Asia, n.e.c. Williston:
2.7% (87)North Dakota:
0.2% (88)
Colombia Williston:
2.4% (77)North Dakota:
0.6% (234)
Other Central America Williston:
2.2% (71)North Dakota:
0.3% (94)
South Africa Williston:
1.9% (60)North Dakota:
1.5% (525)
Korea Williston:
1.7% (53)North Dakota:
2.0% (720)
Place of birth for U.S.-born residents:
This state: 10,642Other state: 13,628Northeast: 577Midwest: 5,479South: 2,877West: 4,552 80.8% of Williston residents lived in the same house 1 years ago.
Out of people who lived in different houses, 29.0% lived in this county.
Out of people who lived in different counties, 51.2% lived in North Dakota.
Williston:
80.8%State average:
84.2%
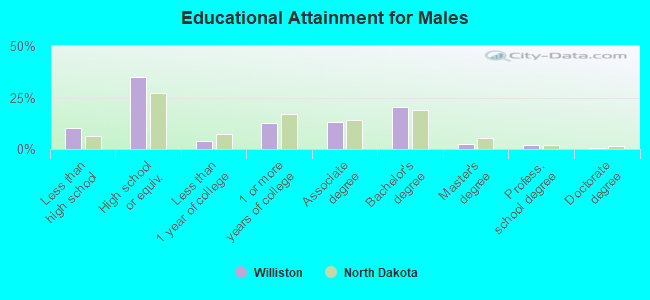
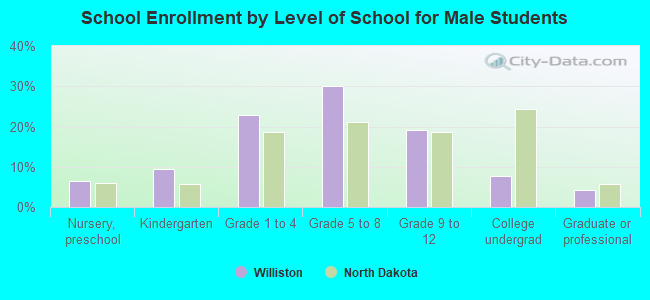
Education attainment for males 25 years and older:
No schooling: 201Nursery to 4th grade: 05th and 6th grade: 07th and 8th grade: 559th grade: 8410th grade: 1811th grade: 38212th grade, no diploma: 207High school graduate (or equivalency): 3,273Less than 1 year of college: 360Some college more than 1 year, no degree: 1,179Associate degree: 1,234Bachelor's degree: 1,882Master's degree: 248Professional school degree: 174Doctorate degree: 38
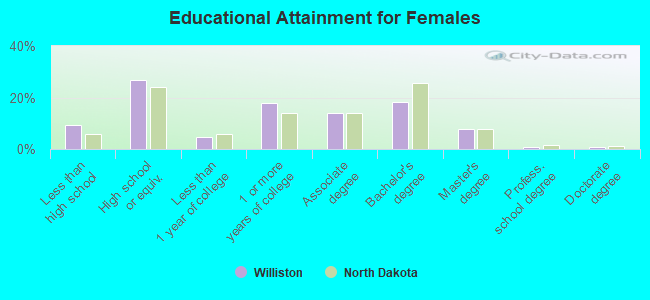
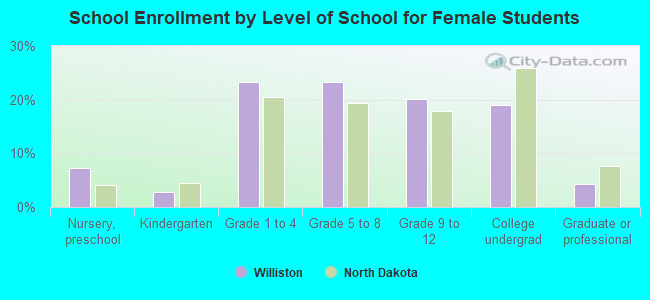
Education attainment for females 25 years and older:
No schooling: 142Nursery to 4th grade: 145th and 6th grade: 07th and 8th grade: 749th grade: 1210th grade: 011th grade: 2212th grade, no diploma: 491High school graduate (or equivalency): 2,192Less than 1 year of college: 388Some college more than 1 year, no degree: 1,457Associate degree: 1,147Bachelor's degree: 1,487Master's degree: 622Professional school degree: 59Doctorate degree: 48
Housing units in structures:
One, detached: 5,449One, attached: 839Two: 3963 or 4: 6425 to 9: 52510 to 19: 1,14720 to 49: 4,01950 or more: 1,346Mobile homes: 579Median worth of mobile homes: $70,245
Housing units lacking complete kitchen facilities in 2022: 0.3%House/condo owner moved in on average 9 years ago
Renter moved in on average 4 years ago
Private vs. public school enrollment:
Students in private schools in grades 1 to 8 (elementary and middle school): 115 Here:
3.2%North Dakota:
8.4%
Students in private schools in grades 9 to 12 (high school): 94 Here:
6.7%North Dakota:
8.2%
Students in private undergraduate colleges: 106 Here:
11.5%North Dakota:
14.3%