The median household income in Arlington, IL in 2022 was $49,308, which was 55.6% less than the median annual income of $76,708 across the entire state of Illinois. Compared to the median income of $27,292 in 2000 this represents an increase of 44.7%. The per capita income in 2022 was $28,606, which means an increase of 57.5% compared to 2000 when it was $12,148.
Whole page based on the data from 2000 / 2022 when the population of Arlington, Illinois was 211 / 199
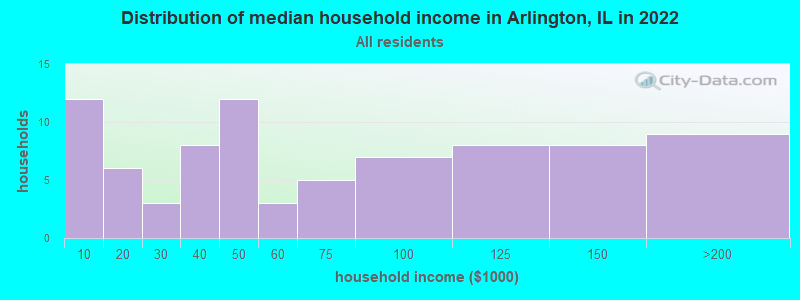
Income statistics for all residents
Median household income in Arlington, IL in 2022:
Arlington:
$49,308
State:
$76,708
Change in median household income between 2000 and 2022:
Arlington, Illinois:
+80.7%
Illinois:
+64.6%
Number of households with income < $10k:
Arlington:
14.8% (12)
State:
5.9% (296,090)
Number of households with income $10k - 20k:
Arlington:
7.4% (6)
State:
6.6% (333,259)
Number of households with income $20k - 30k:
Arlington:
3.7% (3)
State:
6.8% (342,921)
Number of households with income $30k - 40k:
Arlington:
9.9% (8)
State:
7.0% (355,254)
Number of households with income $40k - 50k:
Arlington:
14.8% (12)
State:
6.7% (340,678)
Number of households with income $50k - 60k:
Arlington:
3.7% (3)
Illinois:
6.7% (339,405)
Number of households with income $60k - 75k:
Arlington:
6.2% (5)
Illinois:
9.2% (465,709)
Number of households with income $75k - 100k:
Arlington:
8.6% (7)
State:
12.9% (651,353)
Number of households with income $100k - 125k:
Arlington:
9.9% (8)
State:
10.3% (522,359)
Number of households with income $125k - 150k:
Arlington:
9.9% (8)
State:
7.3% (367,136)
Number of households with income $150k - 200k:
Arlington:
11.1% (9)
State:
9.0% (455,249)
Number of households with income > $200k:
Arlington:
0.0% (0)
State:
11.6% (586,947)
Aggregate household income in Arlington in 2022: $5,559,518
Median family income in Arlington in 2022:
Arlington:
$49,671
Illinois:
$96,948
Number of families with income < $10k:
Arlington:
13.4% (8)
Illinois:
3.4% (105,875)
Number of families with income $10k - 20k:
Arlington:
8.0% (5)
State:
3.3% (105,017)
Number of families with income $30k - 40k:
Arlington:
12.7% (8)
Illinois:
5.3% (167,069)
Number of families with income $40k - 50k:
Arlington:
15.7% (9)
State:
5.8% (181,164)
Number of families with income $50k - 60k:
Arlington:
5.1% (3)
State:
6.1% (191,561)
Number of families with income $75k - 100k:
Arlington:
12.0% (7)
Illinois:
13.8% (432,725)
Number of families with income $100k - 125k:
Arlington:
13.7% (8)
Illinois:
11.9% (373,296)
Number of families with income $125k - 150k:
Arlington:
8.0% (5)
Illinois:
8.9% (279,791)
Number of families with income $150k - 200k:
Arlington:
11.3% (7)
Illinois:
11.9% (372,004)
Median income for 3 person families:
Arlington:
$86,391
State:
$101,710
Median non-family income in Arlington in 2022:
Arlington:
$45,280
State:
$46,533
Change in median non-family income between 2000 and 2022:
Arlington, Illinois:
+143.3%
State:
+64.0%
Median per capita income in Arlington in 2022:
Arlington:
$28,607
Illinois:
$43,317
Change in median per capita income between 2000 and 2022:
Arlington, Illinois:
+135.5%
Illinois:
+87.5%
Income statistics for White residents
Median household income in Arlington, IL in 2022:
Arlington:
$50,217
State:
$83,346
Change in median household income between 2000 and 2022:
Arlington, Illinois:
+84.0%
Illinois:
+67.5%
Number of households with income < $10k:
Arlington:
16.7% (12)
Illinois:
4.5% (149,895)
Number of households with income $10k - 20k:
Arlington:
8.3% (6)
Illinois:
5.5% (184,529)
Number of households with income $20k - 30k:
Arlington:
1.4% (1)
State:
6.1% (205,767)
Number of households with income $30k - 40k:
Arlington:
6.9% (5)
Illinois:
6.7% (225,572)
Number of households with income $40k - 50k:
Arlington:
15.3% (11)
State:
6.5% (216,965)
Number of households with income $50k - 60k:
Arlington:
4.2% (3)
Illinois:
6.6% (222,841)
Number of households with income $60k - 75k:
Arlington:
4.2% (3)
State:
9.3% (312,758)
Number of households with income $75k - 100k:
Arlington:
9.7% (7)
State:
12.9% (433,180)
Number of households with income $100k - 125k:
Arlington:
11.1% (8)
Illinois:
10.7% (360,753)
Number of households with income $125k - 150k:
Arlington:
11.1% (8)
State:
7.9% (266,532)
Number of households with income $150k - 200k:
Arlington:
11.1% (8)
State:
10.0% (337,357)
Number of households with income > $200k:
Arlington:
0.0% (0)
State:
13.3% (446,069)
Aggregate household income in Arlington in 2022: $5,068,092
Median family income in Arlington in 2022:
Arlington:
$68,066
State:
$107,938
Number of families with income < $10k:
Arlington:
15.0% (8)
State:
2.2% (45,983)
Number of families with income $10k - 20k:
Arlington:
8.6% (4)
Illinois:
2.5% (50,574)
Number of families with income $30k - 40k:
Arlington:
9.7% (5)
State:
4.4% (90,563)
Number of families with income $40k - 50k:
Arlington:
12.3% (6)
State:
5.0% (102,597)
Number of families with income $50k - 60k:
Arlington:
5.7% (3)
State:
5.8% (119,129)
Number of families with income $75k - 100k:
Arlington:
12.6% (7)
Illinois:
13.5% (276,887)
Number of families with income $100k - 125k:
Arlington:
14.9% (8)
State:
12.5% (256,099)
Number of families with income $125k - 150k:
Arlington:
8.7% (4)
State:
9.8% (199,855)
Number of families with income $150k - 200k:
Arlington:
12.5% (6)
Illinois:
13.4% (274,569)
Median non-family income in Arlington in 2022:
Arlington:
$46,882
State:
$50,934
Median per capita income in Arlington in 2022:
Arlington:
$30,852
State:
$50,738
Change in median per capita income between 2000 and 2022:
Arlington, Illinois:
+136.7%
Illinois:
+95.5%
Income statistics for Hispanic or Latino residents
Aggregate household income in Arlington in 2022: $2,322,528
Median per capita income in Arlington in 2022:
Arlington:
$20,288
Illinois:
$26,551
Income statistics for Multirace residents
Aggregate household income in Arlington in 2022: $359,976
Median per capita income in Arlington in 2022:
Arlington:
$10,901
State:
$29,285
Income statistics for other residents
Median per capita income in Arlington in 2022:
Arlington:
$25,623
State:
$25,392
Discuss Arlington, Illinois (IL) on our hugely popular Illinois forum.