Boling-Iago, Texas (TX) income map, earnings map, and wages data
The median household income in Boling-Iago, TX in 2022 was $51,994, which was 39.0% less than the median annual income of $72,284 across the entire state of Texas. Compared to the median income of $28,203 in 2000 this represents an increase of 45.8%. The per capita income in 2022 was $25,754, which means an increase of 48.5% compared to 2000 when it was $13,261.
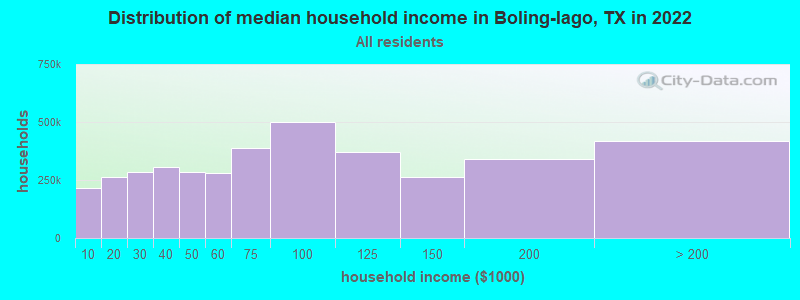
Income statistics for all residents
Median household income in Boling-Iago, TX in 2022:| Boling-Iago: | $51,995 |
| State: | $72,284 |
Change in median household income between 2000 and 2022:| Boling-Iago, Texas: | +84.4% |
| Texas: | +81.0% |
Number of households with income < $10k:| Boling-Iago: | 5.5% (215,680) |
| State: | 5.5% (611,011) |
Number of households with income $10k - 20k:| Boling-Iago: | 6.7% (262,462) |
| State: | 6.7% (743,157) |
Number of households with income $20k - 30k:| Boling-Iago: | 7.2% (283,741) |
| Texas: | 7.2% (803,381) |
Number of households with income $30k - 40k:| Boling-Iago: | 7.8% (305,850) |
| State: | 7.8% (866,080) |
Number of households with income $40k - 50k:| Boling-Iago: | 7.3% (286,213) |
| State: | 7.3% (810,440) |
Number of households with income $50k - 60k:| Boling-Iago: | 7.2% (282,411) |
| State: | 7.2% (799,783) |
Number of households with income $60k - 75k:| Boling-Iago: | 9.9% (386,810) |
| State: | 9.9% (1,095,384) |
Number of households with income $75k - 100k:| Boling-Iago: | 12.8% (501,244) |
| State: | 12.8% (1,419,057) |
Number of households with income $100k - 125k:| Boling-Iago: | 9.5% (372,539) |
| Texas: | 9.5% (1,054,577) |
Number of households with income $125k - 150k:| Boling-Iago: | 6.7% (262,014) |
| State: | 6.7% (741,518) |
Number of households with income $150k - 200k:| Boling-Iago: | 8.7% (339,651) |
| State: | 8.7% (961,776) |
Number of households with income > $200k:| Boling-Iago: | 10.7% (417,091) |
| State: | 10.7% (1,181,544) |
Aggregate household income in Boling-Iago in 2022: $4,397,361,875
Median family income in Boling-Iago in 2022:| Boling-Iago: | $58,091 |
| State: | $86,267 |
Median non-family income in Boling-Iago in 2022:| Boling-Iago: | $29,097 |
| Texas: | $45,999 |
Change in median non-family income between 2000 and 2022:| Boling-Iago, Texas: | +85.2% |
| State: | +79.5% |
Median per capita income in Boling-Iago in 2022:| Boling-Iago: | $25,754 |
| State: | $38,123 |
Change in median per capita income between 2000 and 2022:| Boling-Iago, Texas: | +94.2% |
| Texas: | +94.3% |
Income statistics for White residents
Median household income in Boling-Iago, TX in 2022:| Boling-Iago: | $53,695 |
| State: | $82,032 |
Change in median household income between 2000 and 2022:| Boling-Iago, Texas: | +90.4% |
| Texas: | +91.0% |
Number of households with income < $10k:| Boling-Iago: | 4.7% (89,608) |
| State: | 4.7% (273,716) |
Number of households with income $10k - 20k:| Boling-Iago: | 5.5% (105,838) |
| State: | 5.5% (322,702) |
Number of households with income $20k - 30k:| Boling-Iago: | 6.2% (119,431) |
| Texas: | 6.2% (363,947) |
Number of households with income $30k - 40k:| Boling-Iago: | 6.8% (130,911) |
| Texas: | 6.8% (399,275) |
Number of households with income $40k - 50k:| Boling-Iago: | 6.5% (125,667) |
| State: | 6.5% (383,417) |
Number of households with income $50k - 60k:| Boling-Iago: | 6.6% (127,320) |
| State: | 6.6% (388,535) |
Number of households with income $60k - 75k:| Boling-Iago: | 9.6% (185,327) |
| State: | 9.7% (566,295) |
Number of households with income $75k - 100k:| Boling-Iago: | 13.0% (249,048) |
| Texas: | 13.0% (760,276) |
Number of households with income $100k - 125k:| Boling-Iago: | 10.2% (195,761) |
| State: | 10.2% (597,596) |
Number of households with income $125k - 150k:| Boling-Iago: | 7.4% (143,057) |
| State: | 7.4% (436,830) |
Number of households with income $150k - 200k:| Boling-Iago: | 9.9% (190,797) |
| State: | 9.9% (583,067) |
Number of households with income > $200k:| Boling-Iago: | 13.5% (258,701) |
| Texas: | 13.5% (792,647) |
Aggregate household income in Boling-Iago in 2022: $2,265,306,754
Median family income in Boling-Iago in 2022:| Boling-Iago: | $60,675 |
| State: | $101,788 |
Number of families with income < $10k:| Boling-Iago: | 6.8% (15) |
| State: | 2.8% (108,142) |
Number of families with income $10k - 20k:| Boling-Iago: | 5.6% (12) |
| Texas: | 2.9% (113,421) |
Number of families with income $20k - 30k:| Boling-Iago: | 11.0% (24) |
| State: | 4.1% (157,688) |
Number of families with income $30k - 40k:| Boling-Iago: | 6.7% (15) |
| State: | 5.2% (198,847) |
Number of families with income $40k - 50k:| Boling-Iago: | 9.4% (20) |
| State: | 5.6% (216,490) |
Number of families with income $50k - 60k:| Boling-Iago: | 4.4% (10) |
| State: | 5.7% (220,689) |
Number of families with income $60k - 75k:| Boling-Iago: | 6.8% (15) |
| Texas: | 9.0% (346,106) |
Number of families with income $75k - 100k:| Boling-Iago: | 3.8% (8) |
| State: | 13.7% (527,363) |
Number of families with income $100k - 125k:| Boling-Iago: | 5.6% (12) |
| Texas: | 11.6% (448,411) |
Number of families with income $125k - 150k:| Boling-Iago: | 20.2% (44) |
| State: | 9.2% (355,798) |
Number of families with income > $200k:| Boling-Iago: | 19.7% (43) |
| State: | 17.6% (677,490) |
Median non-family income in Boling-Iago in 2022:| Boling-Iago: | $30,861 |
| Texas: | $50,587 |
Change in median non-family income between 2000 and 2022:| Boling-Iago, Texas: | +85.8% |
| State: | +87.7% |
Median per capita income in Boling-Iago in 2022:| Boling-Iago: | $32,078 |
| Texas: | $47,740 |
Change in median per capita income between 2000 and 2022:| Boling-Iago, Texas: | +112.1% |
| State: | +114.3% |
Income statistics for Black or African American residents
Median household income in Boling-Iago, TX in 2022:| Boling-Iago: | $77,409 |
| Texas: | $55,759 |
Change in median household income between 2000 and 2022:| Boling-Iago, Texas: | +113.5% |
| State: | +90.3% |
Number of households with income < $10k:| Boling-Iago: | 8.9% (77,878) |
| Texas: | 8.9% (126,378) |
Number of households with income $10k - 20k:| Boling-Iago: | 9.9% (87,067) |
| State: | 9.9% (140,369) |
Number of households with income $20k - 30k:| Boling-Iago: | 8.5% (74,907) |
| State: | 8.5% (120,639) |
Number of households with income $30k - 40k:| Boling-Iago: | 9.7% (84,691) |
| State: | 9.7% (137,517) |
Number of households with income $40k - 50k:| Boling-Iago: | 7.9% (69,575) |
| State: | 8.0% (112,973) |
Number of households with income $50k - 60k:| Boling-Iago: | 8.2% (72,093) |
| Texas: | 8.3% (117,156) |
Number of households with income $60k - 75k:| Boling-Iago: | 10.4% (91,007) |
| State: | 10.4% (147,462) |
Number of households with income $75k - 100k:| Boling-Iago: | 11.5% (100,487) |
| Texas: | 11.5% (162,718) |
Number of households with income $100k - 125k:| Boling-Iago: | 8.1% (71,347) |
| State: | 8.2% (115,829) |
Number of households with income $125k - 150k:| Boling-Iago: | 4.9% (43,235) |
| Texas: | 4.9% (69,556) |
Number of households with income $150k - 200k:| Boling-Iago: | 6.4% (55,996) |
| State: | 6.4% (90,701) |
Number of households with income > $200k:| Boling-Iago: | 5.5% (48,108) |
| State: | 5.5% (77,988) |
Aggregate household income in Boling-Iago in 2022: $10,734,110
Median family income in Boling-Iago in 2022:| Boling-Iago: | $81,126 |
| State: | $69,134 |
Median per capita income in Boling-Iago in 2022:| Boling-Iago: | $17,499 |
| State: | $30,490 |
Change in median per capita income between 2000 and 2022:| Boling-Iago, Texas: | +116.3% |
| State: | +113.9% |
Income statistics for Hispanic or Latino residents
Median household income in Boling-Iago, TX in 2022:| Boling-Iago: | $46,667 |
| State: | $60,504 |
Change in median household income between 2000 and 2022:| Boling-Iago, Texas: | +112.9% |
| State: | +102.5% |
Number of households with income < $10k:| Boling-Iago: | 5.8% (78,583) |
| Texas: | 5.8% (213,953) |
Number of households with income $10k - 20k:| Boling-Iago: | 8.0% (109,291) |
| State: | 8.0% (297,456) |
Number of households with income $20k - 30k:| Boling-Iago: | 9.2% (124,872) |
| State: | 9.2% (340,166) |
Number of households with income $30k - 40k:| Boling-Iago: | 9.5% (130,192) |
| State: | 9.5% (354,336) |
Number of households with income $40k - 50k:| Boling-Iago: | 8.8% (120,071) |
| State: | 8.8% (327,013) |
Number of households with income $50k - 60k:| Boling-Iago: | 8.3% (113,324) |
| State: | 8.3% (308,818) |
Number of households with income $60k - 75k:| Boling-Iago: | 10.9% (148,790) |
| Texas: | 10.9% (405,109) |
Number of households with income $75k - 100k:| Boling-Iago: | 13.8% (188,000) |
| State: | 13.8% (511,639) |
Number of households with income $100k - 125k:| Boling-Iago: | 8.6% (117,491) |
| State: | 8.6% (319,728) |
Number of households with income $125k - 150k:| Boling-Iago: | 5.7% (77,578) |
| State: | 5.7% (210,932) |
Number of households with income $150k - 200k:| Boling-Iago: | 6.4% (86,641) |
| Texas: | 6.4% (236,055) |
Number of households with income > $200k:| Boling-Iago: | 5.1% (69,560) |
| Texas: | 5.1% (189,259) |
Aggregate household income in Boling-Iago in 2022: $533,878,809
Median family income in Boling-Iago in 2022:| Boling-Iago: | $48,562 |
| State: | $65,080 |
Number of families with income < $10k:| Boling-Iago: | 10.7% (13) |
| State: | 5.3% (147,493) |
Number of families with income $10k - 20k:| Boling-Iago: | 6.0% (7) |
| Texas: | 6.3% (174,531) |
Number of families with income $20k - 30k:| Boling-Iago: | 17.9% (22) |
| Texas: | 8.6% (238,528) |
Number of families with income $30k - 40k:| Boling-Iago: | 14.4% (18) |
| Texas: | 9.1% (251,999) |
Number of families with income $40k - 50k:| Boling-Iago: | 12.2% (15) |
| State: | 8.6% (240,188) |
Number of families with income $50k - 60k:| Boling-Iago: | 5.7% (7) |
| Texas: | 8.0% (223,566) |
Number of families with income $60k - 75k:| Boling-Iago: | 9.8% (12) |
| State: | 10.9% (302,688) |
Number of families with income $75k - 100k:| Boling-Iago: | 4.4% (5) |
| State: | 14.3% (398,554) |
Number of families with income $100k - 125k:| Boling-Iago: | 4.7% (6) |
| State: | 9.5% (264,007) |
Number of families with income $125k - 150k:| Boling-Iago: | 14.2% (17) |
| State: | 6.2% (171,274) |
Median non-family income in Boling-Iago in 2022:| Boling-Iago: | $40,023 |
| Texas: | $39,934 |
Change in median non-family income between 2000 and 2022:| Boling-Iago, Texas: | +120.8% |
| State: | +109.1% |
Median per capita income in Boling-Iago in 2022:| Boling-Iago: | $25,222 |
| State: | $24,862 |
Change in median per capita income between 2000 and 2022:| Boling-Iago, Texas: | +128.5% |
| Texas: | +130.8% |
Income statistics for Multirace residents
Median household income in Boling-Iago, TX in 2022:| Boling-Iago: | $44,181 |
| State: | $62,748 |
Change in median household income between 2000 and 2022:| Boling-Iago, Texas: | +97.9% |
| Texas: | +92.3% |
Number of households with income < $10k:| Boling-Iago: | 5.5% (41,797) |
| State: | 5.5% (122,324) |
Number of households with income $10k - 20k:| Boling-Iago: | 8.2% (62,268) |
| Texas: | 8.2% (182,232) |
Number of households with income $20k - 30k:| Boling-Iago: | 8.5% (64,669) |
| Texas: | 8.5% (189,456) |
Number of households with income $30k - 40k:| Boling-Iago: | 8.9% (67,466) |
| State: | 8.9% (197,499) |
Number of households with income $40k - 50k:| Boling-Iago: | 8.7% (65,532) |
| Texas: | 8.7% (191,735) |
Number of households with income $50k - 60k:| Boling-Iago: | 8.0% (60,611) |
| State: | 8.0% (177,535) |
Number of households with income $60k - 75k:| Boling-Iago: | 10.5% (79,444) |
| State: | 10.5% (232,479) |
Number of households with income $75k - 100k:| Boling-Iago: | 13.1% (99,220) |
| State: | 13.1% (290,448) |
Number of households with income $100k - 125k:| Boling-Iago: | 8.6% (65,480) |
| Texas: | 8.6% (191,595) |
Number of households with income $125k - 150k:| Boling-Iago: | 6.0% (45,609) |
| State: | 6.0% (133,361) |
Number of households with income $150k - 200k:| Boling-Iago: | 7.2% (54,322) |
| State: | 7.2% (159,195) |
Number of households with income > $200k:| Boling-Iago: | 6.7% (50,577) |
| Texas: | 6.7% (148,064) |
Aggregate household income in Boling-Iago in 2022: $17,780,412
Median family income in Boling-Iago in 2022:| Boling-Iago: | $43,971 |
| State: | $69,780 |
Number of families with income $20k - 30k:| Boling-Iago: | 42.0% (40) |
| Texas: | 7.8% (126,627) |
Number of families with income $30k - 40k:| Boling-Iago: | 58.0% (55) |
| State: | 8.5% (137,626) |
Median per capita income in Boling-Iago in 2022:| Boling-Iago: | $47,550 |
| State: | $26,785 |
Change in median per capita income between 2000 and 2022:| Boling-Iago, Texas: | +108.4% |
| State: | +110.9% |
Income statistics for other residents
Number of households with income < $10k:| Boling-Iago: | 5.8% (21) |
| State: | 5.9% (54,162) |
Number of households with income $10k - 20k:| Boling-Iago: | 6.9% (25) |
| State: | 6.8% (62,891) |
Number of households with income $20k - 30k:| Boling-Iago: | 10.7% (39) |
| Texas: | 10.6% (97,294) |
Number of households with income $30k - 40k:| Boling-Iago: | 10.7% (39) |
| Texas: | 10.8% (99,670) |
Number of households with income $40k - 50k:| Boling-Iago: | 9.3% (34) |
| State: | 9.3% (85,548) |
Number of households with income $50k - 60k:| Boling-Iago: | 9.1% (33) |
| Texas: | 9.0% (82,757) |
Number of households with income $60k - 75k:| Boling-Iago: | 11.0% (40) |
| Texas: | 10.9% (100,326) |
Number of households with income $75k - 100k:| Boling-Iago: | 14.0% (51) |
| State: | 14.0% (128,767) |
Number of households with income $100k - 125k:| Boling-Iago: | 8.2% (30) |
| State: | 8.2% (75,218) |
Number of households with income $125k - 150k:| Boling-Iago: | 4.9% (18) |
| State: | 4.8% (44,223) |
Number of households with income $150k - 200k:| Boling-Iago: | 5.5% (20) |
| State: | 5.6% (51,376) |
Number of households with income > $200k:| Boling-Iago: | 3.8% (14) |
| Texas: | 4.0% (36,393) |
Aggregate household income in Boling-Iago in 2022: $26,714,553
Median family income in Boling-Iago in 2022:| Boling-Iago: | $54,551 |
| Texas: | $60,064 |
Number of families with income $10k - 20k:| Boling-Iago: | 21.5% (5) |
| State: | 6.0% (41,763) |
Number of families with income $20k - 30k:| Boling-Iago: | 27.3% (7) |
| State: | 9.9% (68,761) |
Number of families with income $30k - 40k:| Boling-Iago: | 51.3% (13) |
| Texas: | 9.7% (67,685) |
Median non-family income in Boling-Iago in 2022:| Boling-Iago: | $20,839 |
| Texas: | $38,690 |
Change in median non-family income between 2000 and 2022:| Boling-Iago, Texas: | +123.9% |
| State: | +90.2% |
Median per capita income in Boling-Iago in 2022:| Boling-Iago: | $18,557 |
| State: | $23,899 |
Change in median per capita income between 2000 and 2022:| Boling-Iago, Texas: | +141.8% |
| State: | +135.2% |