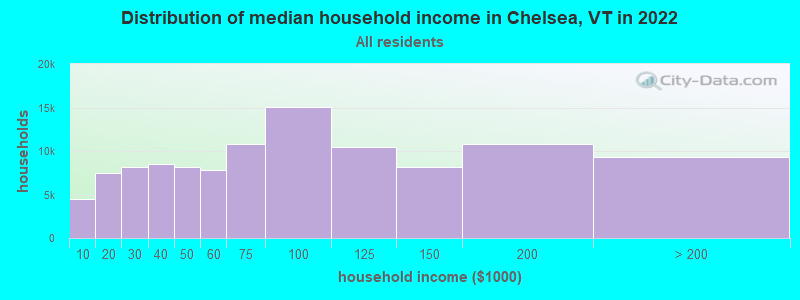
The median household income in Chelsea, VT in 2022 was $58,391, which was 26.7% less than the median annual income of $73,991 across the entire state of Vermont. Compared to the median income of $32,024 in 2000 this represents an increase of 45.2%. The per capita income in 2022 was $33,105, which means an increase of 51.2% compared to 2000 when it was $16,164.
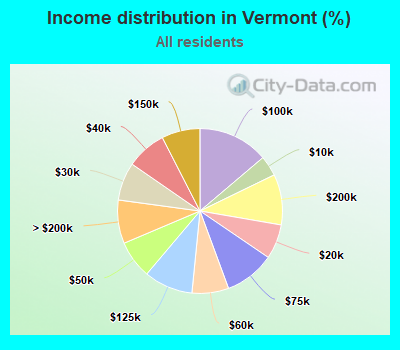
Income statistics for all residents
Median household income in Chelsea, VT in 2022:
Chelsea:
$58,391
State:
$73,991
Change in median household income between 2000 and 2022:
Chelsea, Vermont:
+82.3%
Vermont:
+81.1%
Number of households with income < $10k:
Chelsea:
4.1% (4,459)
State:
4.0% (11,050)
Number of households with income $10k - 20k:
Chelsea:
6.9% (7,510)
State:
6.8% (18,853)
Number of households with income $20k - 30k:
Chelsea:
7.5% (8,204)
State:
7.5% (20,673)
Number of households with income $30k - 40k:
Chelsea:
7.8% (8,553)
State:
7.8% (21,750)
Number of households with income $40k - 50k:
Chelsea:
7.4% (8,135)
State:
7.4% (20,642)
Number of households with income $50k - 60k:
Chelsea:
7.2% (7,835)
Vermont:
7.2% (19,901)
Number of households with income $60k - 75k:
Chelsea:
9.9% (10,800)
State:
9.9% (27,351)
Number of households with income $75k - 100k:
Chelsea:
13.7% (15,003)
State:
13.8% (38,275)
Number of households with income $100k - 125k:
Chelsea:
9.6% (10,488)
State:
9.6% (26,632)
Number of households with income $125k - 150k:
Chelsea:
7.5% (8,199)
Vermont:
7.5% (20,857)
Number of households with income $150k - 200k:
Chelsea:
9.9% (10,835)
State:
9.9% (27,469)
Number of households with income > $200k:
Chelsea:
8.5% (9,281)
State:
8.5% (23,637)
Aggregate household income in Chelsea in 2022: $120,524,681
Median family income in Chelsea in 2022:
Chelsea:
$82,343
Vermont:
$96,345
Median non-family income in Chelsea in 2022:
Chelsea:
$31,910
State:
$46,022
Change in median non-family income between 2000 and 2022:
Chelsea, Vermont:
+87.9%
State:
+87.4%
Median per capita income in Chelsea in 2022:
Chelsea:
$33,105
Vermont:
$42,251
Change in median per capita income between 2000 and 2022:
Chelsea, Vermont:
+104.8%
Vermont:
+104.9%
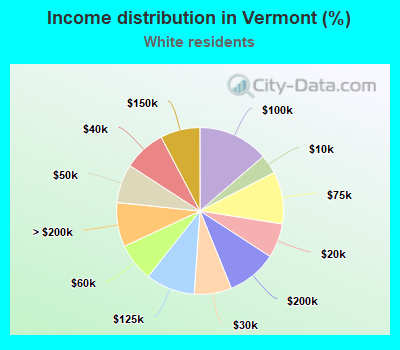
Income statistics for White residents
Median household income in Chelsea, VT in 2022:
Chelsea:
$58,173
State:
$73,591
Change in median household income between 2000 and 2022:
Chelsea, Vermont:
+80.8%
State:
+79.2%
Number of households with income < $10k:
Chelsea:
3.8% (3,814)
State:
3.7% (9,508)
Number of households with income $10k - 20k:
Chelsea:
6.7% (6,782)
State:
6.7% (17,064)
Number of households with income $20k - 30k:
Chelsea:
7.3% (7,345)
State:
7.2% (18,552)
Number of households with income $30k - 40k:
Chelsea:
8.1% (8,205)
Vermont:
8.2% (20,886)
Number of households with income $40k - 50k:
Chelsea:
7.5% (7,551)
State:
7.5% (19,216)
Number of households with income $50k - 60k:
Chelsea:
7.4% (7,428)
State:
7.4% (18,898)
Number of households with income $60k - 75k:
Chelsea:
10.2% (10,240)
State:
10.1% (25,944)
Number of households with income $75k - 100k:
Chelsea:
13.6% (13,685)
State:
13.7% (34,991)
Number of households with income $100k - 125k:
Chelsea:
9.5% (9,583)
Vermont:
9.5% (24,409)
Number of households with income $125k - 150k:
Chelsea:
7.7% (7,744)
State:
7.7% (19,710)
Number of households with income $150k - 200k:
Chelsea:
9.7% (9,740)
Vermont:
9.7% (24,802)
Number of households with income > $200k:
Chelsea:
8.5% (8,606)
State:
8.6% (21,983)
Aggregate household income in Chelsea in 2022: $110,356,441
Median family income in Chelsea in 2022:
Chelsea:
$82,280
Vermont:
$96,147
Number of families with income < $10k:
Chelsea:
2.6% (5)
State:
1.8% (2,669)
Number of families with income $10k - 20k:
Chelsea:
5.5% (11)
State:
3.1% (4,686)
Number of families with income $20k - 30k:
Chelsea:
9.4% (19)
State:
4.1% (6,266)
Number of families with income $30k - 40k:
Chelsea:
10.8% (22)
Vermont:
6.1% (9,273)
Number of families with income $40k - 50k:
Chelsea:
6.3% (13)
State:
6.4% (9,714)
Number of families with income $50k - 60k:
Chelsea:
11.0% (23)
State:
6.1% (9,310)
Number of families with income $60k - 75k:
Chelsea:
11.2% (23)
Vermont:
9.3% (14,175)
Number of families with income $75k - 100k:
Chelsea:
17.6% (36)
State:
15.5% (23,673)
Number of families with income $100k - 125k:
Chelsea:
12.4% (26)
Vermont:
12.7% (19,323)
Number of families with income $125k - 150k:
Chelsea:
10.2% (21)
State:
9.7% (14,805)
Number of families with income > $200k:
Chelsea:
3.0% (6)
State:
12.1% (18,463)
Median non-family income in Chelsea in 2022:
Chelsea:
$31,126
State:
$45,952
Change in median non-family income between 2000 and 2022:
Chelsea, Vermont:
+86.8%
State:
+86.1%
Median per capita income in Chelsea in 2022:
Chelsea:
$33,777
State:
$43,031
Change in median per capita income between 2000 and 2022:
Chelsea, Vermont:
+106.2%
State:
+106.0%
Income statistics for Asian residents
Number of households with income < $10k:
Chelsea:
5.3% (273,893)
Vermont:
8.9% (278)
Number of households with income $10k - 20k:
Chelsea:
4.8% (247,253)
Vermont:
5.9% (184)
Number of households with income $20k - 30k:
Chelsea:
4.7% (241,997)
Vermont:
8.3% (258)
Number of households with income $30k - 40k:
Chelsea:
4.7% (240,213)
Vermont:
8.8% (273)
Number of households with income $40k - 50k:
Chelsea:
4.6% (236,541)
Vermont:
9.7% (302)
Number of households with income $50k - 60k:
Chelsea:
4.8% (245,509)
State:
3.4% (106)
Number of households with income $60k - 75k:
Chelsea:
6.9% (352,090)
State:
6.5% (202)
Number of households with income $75k - 100k:
Chelsea:
10.9% (557,768)
Vermont:
14.6% (455)
Number of households with income $100k - 125k:
Chelsea:
10.0% (511,334)
State:
9.8% (305)
Number of households with income $125k - 150k:
Chelsea:
7.8% (402,363)
State:
2.7% (85)
Number of households with income $150k - 200k:
Chelsea:
11.8% (607,265)
Vermont:
11.8% (369)
Number of households with income > $200k:
Chelsea:
23.7% (1,219,130)
State:
9.6% (299)
Median per capita income in Chelsea in 2022:
Chelsea:
$46,627
Vermont:
$32,037
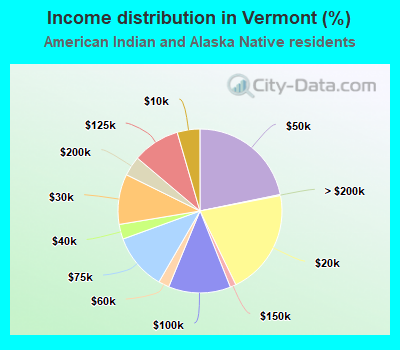
Income statistics for American Indian and Alaska Native residents
Number of households with income < $10k:
Chelsea:
8.0% (4)
State:
4.5% (23)
Number of households with income $10k - 20k:
Chelsea:
10.0% (5)
State:
20.8% (107)
Number of households with income $20k - 30k:
Chelsea:
8.0% (4)
State:
9.9% (51)
Number of households with income $30k - 40k:
Chelsea:
8.0% (4)
State:
2.9% (15)
Number of households with income $40k - 50k:
Chelsea:
8.0% (4)
State:
21.8% (112)
Number of households with income $50k - 60k:
Chelsea:
8.0% (4)
Vermont:
2.1% (11)
Number of households with income $60k - 75k:
Chelsea:
10.0% (5)
State:
11.1% (57)
Number of households with income $75k - 100k:
Chelsea:
12.0% (6)
State:
12.3% (63)
Number of households with income $100k - 125k:
Chelsea:
10.0% (5)
Vermont:
9.3% (48)
Number of households with income $125k - 150k:
Chelsea:
6.0% (3)
Vermont:
1.2% (6)
Number of households with income $150k - 200k:
Chelsea:
6.0% (3)
State:
3.9% (20)
Number of households with income > $200k:
Chelsea:
6.0% (3)
State:
0.2% (1)
Aggregate household income in Chelsea in 2022: $66,772
Median non-family income in Chelsea in 2022:
Chelsea:
$43,569
State:
$47,925
Change in median non-family income between 2000 and 2022:
Chelsea, Vermont:
+83.4%
State:
+130.6%
Median per capita income in Chelsea in 2022:
Chelsea:
$14,071
State:
$19,747
Change in median per capita income between 2000 and 2022:
Chelsea, Vermont:
+37.8%
State:
+41.4%
Income statistics for Multirace residents
Median household income in Chelsea, VT in 2022:
Chelsea:
$50,691
Vermont:
$81,819
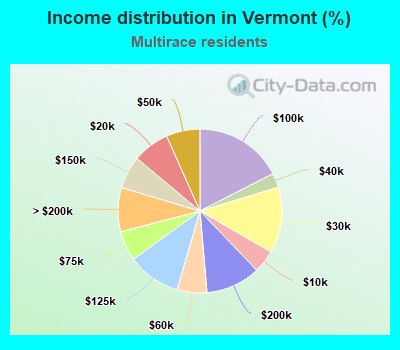
Number of households with income < $10k:
Chelsea:
4.5% (371)
State:
4.5% (613)
Number of households with income $10k - 20k:
Chelsea:
7.3% (598)
State:
7.3% (988)
Number of households with income $20k - 30k:
Chelsea:
13.0% (1,071)
State:
13.0% (1,770)
Number of households with income $30k - 40k:
Chelsea:
2.8% (233)
State:
2.8% (386)
Number of households with income $40k - 50k:
Chelsea:
6.7% (547)
State:
6.7% (904)
Number of households with income $50k - 60k:
Chelsea:
5.9% (482)
Vermont:
5.9% (797)
Number of households with income $60k - 75k:
Chelsea:
5.9% (487)
State:
5.9% (804)
Number of households with income $75k - 100k:
Chelsea:
17.5% (1,438)
State:
17.5% (2,376)
Number of households with income $100k - 125k:
Chelsea:
10.5% (864)
Vermont:
10.5% (1,427)
Number of households with income $125k - 150k:
Chelsea:
6.5% (531)
State:
6.5% (877)
Number of households with income $150k - 200k:
Chelsea:
10.8% (888)
State:
10.8% (1,467)
Number of households with income > $200k:
Chelsea:
8.7% (714)
State:
8.7% (1,180)
Aggregate household income in Chelsea in 2022: $511,185
Median non-family income in Chelsea in 2022:
Chelsea:
$43,509
Vermont:
$44,940
Change in median non-family income between 2000 and 2022:
Chelsea, Vermont:
+132.0%
State:
+160.3%
Median per capita income in Chelsea in 2022:
Chelsea:
$15,158
Vermont:
$34,567
Income statistics for other residents
Number of households with income < $10k:
Chelsea:
6.1% (13)
Vermont:
4.4% (48)
Number of households with income $10k - 20k:
Chelsea:
7.0% (15)
State:
6.4% (69)
Number of households with income $20k - 30k:
Chelsea:
8.0% (17)
Vermont:
2.7% (29)
Number of households with income $30k - 40k:
Chelsea:
9.4% (20)
State:
13.6% (147)
Number of households with income $40k - 50k:
Chelsea:
8.5% (18)
State:
13.4% (145)
Number of households with income $50k - 60k:
Chelsea:
8.0% (17)
State:
7.8% (84)
Number of households with income $60k - 75k:
Chelsea:
10.8% (23)
Vermont:
13.7% (148)
Number of households with income $75k - 100k:
Chelsea:
14.1% (30)
Vermont:
8.1% (87)
Number of households with income $100k - 125k:
Chelsea:
9.4% (20)
Vermont:
8.4% (91)
Number of households with income $125k - 150k:
Chelsea:
6.1% (13)
Vermont:
6.1% (66)
Number of households with income $150k - 200k:
Chelsea:
7.0% (15)
State:
10.7% (116)
Number of households with income > $200k:
Chelsea:
5.6% (12)
State:
4.6% (50)
Aggregate household income in Chelsea in 2022: $874,722
Median family income in Chelsea in 2022:
Chelsea:
$68,542
State:
$105,231
Median per capita income in Chelsea in 2022:
Chelsea:
$24,890
State:
$36,770
Discuss Chelsea, Vermont (VT) on our hugely popular Vermont forum.