The median household income in Crab Orchard, KY in 2022 was $27,333, which was 117.1% less than the median annual income of $59,341 across the entire state of Kentucky. Compared to the median income of $21,184 in 2000 this represents an increase of 22.5%. The per capita income in 2022 was $16,195, which means an increase of 27.7% compared to 2000 when it was $11,706.
Whole page based on the data from 2000 / 2022 when the population of Crab Orchard, Kentucky was 842 / 798
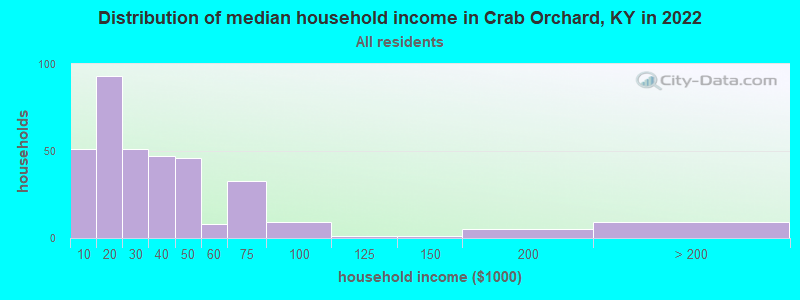
Income statistics for all residents
Median household income in Crab Orchard, KY in 2022:
Crab Orchard:
$27,333
State:
$59,341
Change in median household income between 2000 and 2022:
Crab Orchard, Kentucky:
+29.0%
State:
+76.2%
Number of households with income < $10k:
Crab Orchard:
14.4% (51)
Kentucky:
6.8% (123,697)
Number of households with income $10k - 20k:
Crab Orchard:
26.3% (93)
State:
10.0% (182,645)
Number of households with income $20k - 30k:
Crab Orchard:
14.4% (51)
Kentucky:
9.0% (164,092)
Number of households with income $30k - 40k:
Crab Orchard:
13.3% (47)
Kentucky:
9.1% (165,607)
Number of households with income $40k - 50k:
Crab Orchard:
13.0% (46)
State:
8.0% (146,315)
Number of households with income $50k - 60k:
Crab Orchard:
2.3% (8)
Kentucky:
7.7% (140,671)
Number of households with income $60k - 75k:
Crab Orchard:
9.3% (33)
State:
9.8% (180,002)
Number of households with income $75k - 100k:
Crab Orchard:
2.5% (9)
State:
12.6% (230,239)
Number of households with income $100k - 125k:
Crab Orchard:
0.3% (1)
State:
9.0% (164,398)
Number of households with income $125k - 150k:
Crab Orchard:
0.3% (1)
Kentucky:
5.9% (108,602)
Number of households with income $150k - 200k:
Crab Orchard:
1.4% (5)
Kentucky:
6.2% (112,813)
Number of households with income > $200k:
Crab Orchard:
2.5% (9)
Kentucky:
6.0% (109,599)
Aggregate household income in Crab Orchard in 2022: $13,280,250
Median family income in Crab Orchard in 2022:
Crab Orchard:
$33,543
Kentucky:
$76,119
Number of families with income < $10k:
Crab Orchard:
19.9% (42)
State:
4.3% (50,255)
Number of families with income $10k - 20k:
Crab Orchard:
9.4% (20)
State:
5.4% (62,899)
Number of families with income $20k - 30k:
Crab Orchard:
17.6% (37)
State:
6.5% (76,765)
Number of families with income $30k - 40k:
Crab Orchard:
9.5% (20)
State:
8.1% (95,183)
Number of families with income $40k - 50k:
Crab Orchard:
14.2% (30)
State:
7.1% (83,575)
Number of families with income $50k - 60k:
Crab Orchard:
5.2% (11)
State:
7.4% (86,258)
Number of families with income $60k - 75k:
Crab Orchard:
17.0% (36)
State:
10.3% (121,229)
Number of families with income $100k - 125k:
Crab Orchard:
0.5% (1)
Kentucky:
11.5% (134,935)
Number of families with income $150k - 200k:
Crab Orchard:
2.4% (5)
Kentucky:
8.4% (98,984)
Number of families with income > $200k:
Crab Orchard:
4.4% (9)
State:
8.2% (96,213)
Median income for 2 person families:
Crab Orchard:
$24,408
State:
$67,141
Median non-family income in Crab Orchard in 2022:
Crab Orchard:
$14,802
State:
$33,993
Change in median non-family income between 2000 and 2022:
Crab Orchard, Kentucky:
+69.2%
State:
+79.2%
Median per capita income in Crab Orchard in 2022:
Crab Orchard:
$16,196
Kentucky:
$33,980
Change in median per capita income between 2000 and 2022:
Crab Orchard, Kentucky:
+38.4%
State:
+87.8%
Income statistics for White residents
Median household income in Crab Orchard, KY in 2022:
Crab Orchard:
$27,594
State:
$60,987
Change in median household income between 2000 and 2022:
Crab Orchard, Kentucky:
+28.1%
Kentucky:
+76.2%
Number of households with income < $10k:
Crab Orchard:
15.0% (50)
State:
6.2% (96,690)
Number of households with income $10k - 20k:
Crab Orchard:
23.7% (79)
Kentucky:
9.7% (151,125)
Number of households with income $20k - 30k:
Crab Orchard:
15.6% (52)
State:
8.9% (139,532)
Number of households with income $30k - 40k:
Crab Orchard:
14.1% (47)
Kentucky:
9.1% (142,284)
Number of households with income $40k - 50k:
Crab Orchard:
13.2% (44)
Kentucky:
7.7% (121,151)
Number of households with income $50k - 60k:
Crab Orchard:
2.4% (8)
State:
7.7% (119,790)
Number of households with income $60k - 75k:
Crab Orchard:
8.4% (28)
State:
9.9% (154,174)
Number of households with income $75k - 100k:
Crab Orchard:
2.7% (9)
State:
12.8% (199,740)
Number of households with income $100k - 125k:
Crab Orchard:
0.3% (1)
State:
9.4% (146,284)
Number of households with income $125k - 150k:
Crab Orchard:
0.3% (1)
State:
6.0% (94,180)
Number of households with income $150k - 200k:
Crab Orchard:
1.5% (5)
State:
6.4% (100,702)
Number of households with income > $200k:
Crab Orchard:
2.7% (9)
Kentucky:
6.3% (98,502)
Aggregate household income in Crab Orchard in 2022: $12,499,400
Median family income in Crab Orchard in 2022:
Crab Orchard:
$32,821
Kentucky:
$78,353
Number of families with income < $10k:
Crab Orchard:
19.7% (40)
Kentucky:
3.7% (37,075)
Number of families with income $10k - 20k:
Crab Orchard:
9.5% (19)
State:
4.9% (49,864)
Number of families with income $20k - 30k:
Crab Orchard:
18.9% (38)
Kentucky:
6.4% (64,043)
Number of families with income $30k - 40k:
Crab Orchard:
10.0% (20)
State:
8.0% (81,080)
Number of families with income $40k - 50k:
Crab Orchard:
14.2% (29)
Kentucky:
6.9% (69,099)
Number of families with income $50k - 60k:
Crab Orchard:
5.3% (11)
State:
7.2% (72,955)
Number of families with income $60k - 75k:
Crab Orchard:
14.8% (30)
State:
10.4% (104,587)
Number of families with income $100k - 125k:
Crab Orchard:
0.5% (1)
State:
11.9% (120,340)
Number of families with income $150k - 200k:
Crab Orchard:
2.5% (5)
Kentucky:
8.8% (89,097)
Number of families with income > $200k:
Crab Orchard:
4.5% (9)
State:
8.6% (86,849)
Median non-family income in Crab Orchard in 2022:
Crab Orchard:
$16,444
State:
$34,415
Change in median non-family income between 2000 and 2022:
Crab Orchard, Kentucky:
+78.4%
State:
+78.3%
Median per capita income in Crab Orchard in 2022:
Crab Orchard:
$16,107
State:
$35,352
Change in median per capita income between 2000 and 2022:
Crab Orchard, Kentucky:
+37.0%
State:
+90.2%
Income statistics for Black or African American residents
Aggregate household income in Crab Orchard in 2022: $645,734
Median per capita income in Crab Orchard in 2022:
Crab Orchard:
$51,634
State:
$27,117
Income statistics for Multirace residents
Number of households with income < $10k:
Crab Orchard:
0.0% (0)
Kentucky:
8.3% (6,780)
Number of households with income $10k - 20k:
Crab Orchard:
100.0% (19)
State:
11.0% (9,005)
Number of households with income $20k - 30k:
Crab Orchard:
0.0% (0)
State:
8.6% (7,004)
Number of households with income $30k - 40k:
Crab Orchard:
0.0% (0)
Kentucky:
9.0% (7,406)
Number of households with income $40k - 50k:
Crab Orchard:
0.0% (0)
Kentucky:
8.2% (6,707)
Number of households with income $50k - 60k:
Crab Orchard:
0.0% (0)
Kentucky:
7.4% (6,048)
Number of households with income $60k - 75k:
Crab Orchard:
0.0% (0)
Kentucky:
11.2% (9,202)
Number of households with income $75k - 100k:
Crab Orchard:
0.0% (0)
State:
11.9% (9,767)
Number of households with income $100k - 125k:
Crab Orchard:
0.0% (0)
State:
7.1% (5,846)
Number of households with income $125k - 150k:
Crab Orchard:
0.0% (0)
State:
6.9% (5,667)
Number of households with income $150k - 200k:
Crab Orchard:
0.0% (0)
State:
5.1% (4,171)
Number of households with income > $200k:
Crab Orchard:
0.0% (0)
State:
5.2% (4,241)
Aggregate household income in Crab Orchard in 2022: $98,002
Median per capita income in Crab Orchard in 2022:
Crab Orchard:
$2,782
State:
$25,670
Change in median per capita income between 2000 and 2022:
Crab Orchard, Kentucky:
+131.8%
State:
+132.3%
Discuss Crab Orchard, Kentucky (KY) on our hugely popular Kentucky forum.