Darling, Mississippi (MS) income map, earnings map, and wages data

Data:
The per capita income in 2022 was $13,531, which means an increase of 20.1% compared to 2000 when it was $10,817.
Whole page based on the data from 2000 / 2022 when the population of Darling, Mississippi was 226 / 156
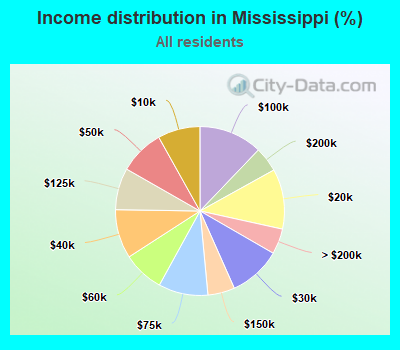
Income statistics for all residents
Number of households with income < $10k:| Darling: | 0.0% (0) |
| State: | 8.1% (93,168) |
Number of households with income $10k - 20k:| Darling: | 36.2% (34) |
| Mississippi: | 11.5% (132,073) |
Number of households with income $20k - 30k:| Darling: | 24.5% (23) |
| State: | 10.0% (114,967) |
Number of households with income $30k - 40k:| Darling: | 0.0% (0) |
| State: | 9.4% (107,844) |
Number of households with income $40k - 50k:| Darling: | 0.0% (0) |
| Mississippi: | 8.6% (98,915) |
Number of households with income $50k - 60k:| Darling: | 35.1% (33) |
| State: | 7.9% (90,333) |
Number of households with income $60k - 75k:| Darling: | 4.3% (4) |
| State: | 9.5% (109,069) |
Number of households with income $75k - 100k:| Darling: | 0.0% (0) |
| State: | 12.1% (139,516) |
Number of households with income $100k - 125k:| Darling: | 0.0% (0) |
| Mississippi: | 8.0% (92,049) |
Number of households with income $125k - 150k:| Darling: | 0.0% (0) |
| State: | 5.1% (59,086) |
Number of households with income $150k - 200k:| Darling: | 0.0% (0) |
| Mississippi: | 4.8% (55,082) |
Number of households with income > $200k:| Darling: | 0.0% (0) |
| Mississippi: | 4.9% (56,238) |
Aggregate household income in Darling in 2022: $2,959,762
Median family income in Darling in 2022:| Darling: | $54,903 |
| State: | $66,973 |
Number of families with income $20k - 30k:| Darling: | 36.9% (22) |
| Mississippi: | 8.2% (62,003) |
Number of families with income $50k - 60k:| Darling: | 56.1% (33) |
| State: | 8.0% (60,662) |
Number of families with income $60k - 75k:| Darling: | 7.0% (4) |
| State: | 10.3% (77,954) |
Median non-family income in Darling in 2022:| Darling: | $13,849 |
| State: | $28,667 |
Change in median non-family income between 2000 and 2022:| Darling, Mississippi: | +35.5% |
| Mississippi: | +72.5% |
Median per capita income in Darling in 2022:| Darling: | $13,532 |
| Mississippi: | $29,045 |
Change in median per capita income between 2000 and 2022:| Darling, Mississippi: | +25.1% |
| Mississippi: | +83.2% |
Income statistics for White residents
Aggregate household income in Darling in 2022: $2,535,038
Median per capita income in Darling in 2022:| Darling: | $46,302 |
| Mississippi: | $35,856 |
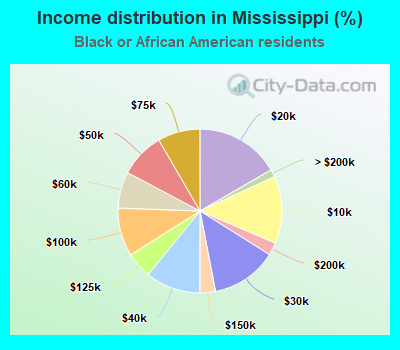
Income statistics for Black or African American residents
Number of households with income < $10k:| Darling: | 0.0% (0) |
| State: | 13.3% (54,463) |
Number of households with income $10k - 20k:| Darling: | 35.4% (29) |
| State: | 16.7% (68,415) |
Number of households with income $20k - 30k:| Darling: | 26.8% (22) |
| State: | 13.0% (53,517) |
Number of households with income $30k - 40k:| Darling: | 0.0% (0) |
| State: | 10.8% (44,492) |
Number of households with income $40k - 50k:| Darling: | 0.0% (0) |
| State: | 8.9% (36,358) |
Number of households with income $50k - 60k:| Darling: | 37.8% (31) |
| State: | 7.2% (29,595) |
Number of households with income $60k - 75k:| Darling: | 0.0% (0) |
| State: | 8.4% (34,343) |
Number of households with income $75k - 100k:| Darling: | 0.0% (0) |
| Mississippi: | 9.5% (39,194) |
Number of households with income $100k - 125k:| Darling: | 0.0% (0) |
| Mississippi: | 5.1% (21,066) |
Number of households with income $125k - 150k:| Darling: | 0.0% (0) |
| State: | 3.1% (12,713) |
Number of households with income $150k - 200k:| Darling: | 0.0% (0) |
| State: | 2.5% (10,278) |
Number of households with income > $200k:| Darling: | 0.0% (0) |
| State: | 1.5% (6,138) |
Aggregate household income in Darling in 2022: $2,550,160
Median per capita income in Darling in 2022:| Darling: | $12,434 |
| State: | $20,283 |
Change in median per capita income between 2000 and 2022:| Darling, Mississippi: | +52.5% |
| State: | +102.0% |