Empire, Nevada (NV) income map, earnings map, and wages data

Data:
The per capita income in 2022 was $19,169, which means a decrease of 26.6% compared to 2000 when it was $24,277.
Whole page based on the data from 2000 / 2022 when the population of Empire, Nevada was 217 / 165
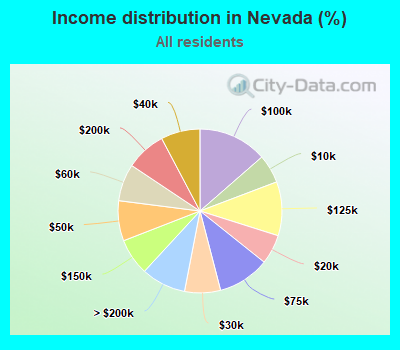
Income statistics for all residents
Number of households with income < $10k:| Empire: | 0.0% (0) |
| State: | 5.6% (67,608) |
Number of households with income $10k - 20k:| Empire: | 0.0% (0) |
| State: | 5.8% (69,869) |
Number of households with income $20k - 30k:| Empire: | 53.7% (29) |
| State: | 7.1% (84,856) |
Number of households with income $30k - 40k:| Empire: | 0.0% (0) |
| State: | 7.7% (92,600) |
Number of households with income $40k - 50k:| Empire: | 0.0% (0) |
| State: | 7.9% (94,898) |
Number of households with income $50k - 60k:| Empire: | 0.0% (0) |
| State: | 7.3% (88,037) |
Number of households with income $60k - 75k:| Empire: | 0.0% (0) |
| Nevada: | 10.2% (122,705) |
Number of households with income $75k - 100k:| Empire: | 46.3% (25) |
| Nevada: | 13.6% (162,870) |
Number of households with income $100k - 125k:| Empire: | 0.0% (0) |
| State: | 10.7% (127,735) |
Number of households with income $125k - 150k:| Empire: | 0.0% (0) |
| State: | 7.3% (86,891) |
Number of households with income $150k - 200k:| Empire: | 0.0% (0) |
| State: | 7.9% (94,679) |
Number of households with income > $200k:| Empire: | 0.0% (0) |
| State: | 8.8% (105,608) |
Aggregate household income in Empire in 2022: $4,580,910
Median per capita income in Empire in 2022:| Empire: | $19,170 |
| State: | $38,183 |
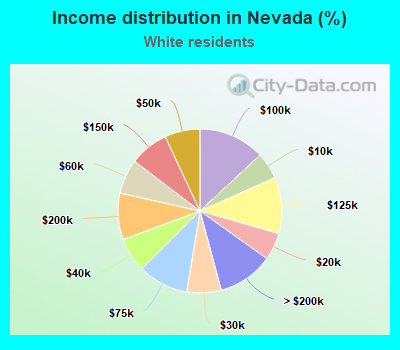
Income statistics for White residents
Number of households with income < $10k:| Empire: | 0.0% (0) |
| State: | 5.3% (36,449) |
Number of households with income $10k - 20k:| Empire: | 0.0% (0) |
| State: | 5.4% (37,351) |
Number of households with income $20k - 30k:| Empire: | 58.9% (33) |
| State: | 6.8% (46,880) |
Number of households with income $30k - 40k:| Empire: | 0.0% (0) |
| State: | 6.8% (46,939) |
Number of households with income $40k - 50k:| Empire: | 0.0% (0) |
| Nevada: | 7.0% (48,126) |
Number of households with income $50k - 60k:| Empire: | 0.0% (0) |
| Nevada: | 6.9% (47,402) |
Number of households with income $60k - 75k:| Empire: | 0.0% (0) |
| Nevada: | 10.0% (68,993) |
Number of households with income $75k - 100k:| Empire: | 41.1% (23) |
| Nevada: | 13.1% (90,439) |
Number of households with income $100k - 125k:| Empire: | 0.0% (0) |
| State: | 11.1% (77,026) |
Number of households with income $125k - 150k:| Empire: | 0.0% (0) |
| Nevada: | 7.7% (53,064) |
Number of households with income $150k - 200k:| Empire: | 0.0% (0) |
| State: | 9.2% (63,350) |
Number of households with income > $200k:| Empire: | 0.0% (0) |
| State: | 11.0% (75,795) |
Aggregate household income in Empire in 2022: $4,006,932
Median per capita income in Empire in 2022:| Empire: | $19,704 |
| Nevada: | $47,995 |