The median household income in Gilman, IA in 2022 was $97,066, which was 28.3% greater than the median annual income of $69,588 across the entire state of Iowa. Compared to the median income of $33,523 in 2000 this represents an increase of 65.5%. The per capita income in 2022 was $39,822, which means an increase of 62.2% compared to 2000 when it was $15,070.
Whole page based on the data from 2000 / 2022 when the population of Gilman, Iowa was 600 / 586
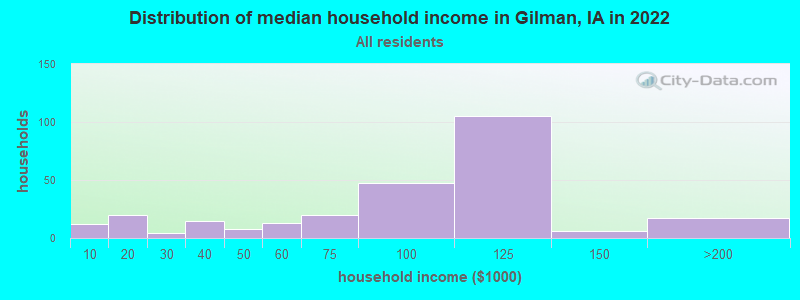
Income statistics for all residents
Median household income in Gilman, IA in 2022:
Gilman:
$97,067
Iowa:
$69,588
Number of households with income < $10k:
Gilman:
4.5% (12)
State:
4.3% (57,792)
Number of households with income $10k - 20k:
Gilman:
7.5% (20)
State:
7.1% (94,476)
Number of households with income $20k - 30k:
Gilman:
1.5% (4)
Iowa:
7.5% (99,451)
Number of households with income $30k - 40k:
Gilman:
5.6% (15)
State:
7.9% (105,366)
Number of households with income $40k - 50k:
Gilman:
3.0% (8)
Iowa:
8.3% (110,374)
Number of households with income $50k - 60k:
Gilman:
4.9% (13)
State:
8.0% (106,753)
Number of households with income $60k - 75k:
Gilman:
7.5% (20)
Iowa:
10.3% (137,637)
Number of households with income $75k - 100k:
Gilman:
17.6% (47)
State:
14.2% (188,515)
Number of households with income $100k - 125k:
Gilman:
39.3% (105)
State:
10.3% (136,469)
Number of households with income $125k - 150k:
Gilman:
2.2% (6)
Iowa:
7.1% (94,270)
Number of households with income $150k - 200k:
Gilman:
6.4% (17)
State:
7.8% (103,165)
Number of households with income > $200k:
Gilman:
0.0% (0)
State:
7.3% (96,727)
Aggregate household income in Gilman in 2022: $24,234,813
Median family income in Gilman in 2022:
Gilman:
$100,993
State:
$90,851
Number of families with income < $10k:
Gilman:
8.9% (13)
Iowa:
2.5% (20,874)
Number of families with income $20k - 30k:
Gilman:
1.3% (2)
Iowa:
4.3% (35,635)
Number of families with income $30k - 40k:
Gilman:
4.0% (6)
State:
5.4% (44,304)
Number of families with income $40k - 50k:
Gilman:
4.3% (6)
State:
6.8% (55,757)
Number of families with income $50k - 60k:
Gilman:
2.7% (4)
State:
6.7% (55,443)
Number of families with income $60k - 75k:
Gilman:
4.9% (7)
State:
10.2% (83,983)
Number of families with income $75k - 100k:
Gilman:
22.6% (33)
Iowa:
16.5% (135,546)
Number of families with income $100k - 125k:
Gilman:
35.6% (52)
State:
13.2% (108,552)
Number of families with income $125k - 150k:
Gilman:
4.1% (6)
State:
9.7% (79,659)
Number of families with income $150k - 200k:
Gilman:
11.5% (17)
State:
11.0% (90,640)
Median non-family income in Gilman in 2022:
Gilman:
$95,558
State:
$41,504
Median per capita income in Gilman in 2022:
Gilman:
$39,823
Iowa:
$38,917
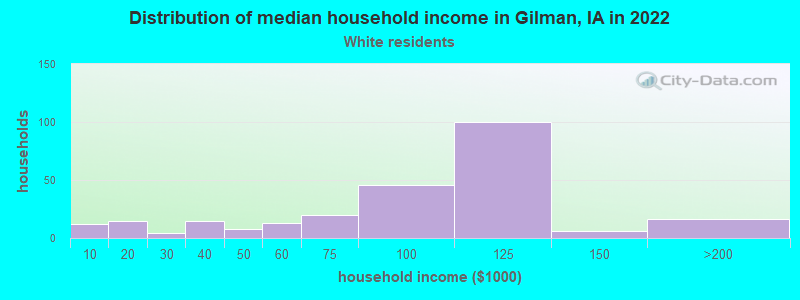
Income statistics for White residents
Median household income in Gilman, IA in 2022:
Gilman:
$97,570
State:
$71,725
Number of households with income < $10k:
Gilman:
4.7% (12)
State:
4.0% (47,459)
Number of households with income $10k - 20k:
Gilman:
5.9% (15)
State:
6.7% (78,901)
Number of households with income $20k - 30k:
Gilman:
1.6% (4)
State:
7.1% (83,759)
Number of households with income $30k - 40k:
Gilman:
5.9% (15)
Iowa:
7.7% (90,779)
Number of households with income $40k - 50k:
Gilman:
3.1% (8)
State:
8.0% (93,777)
Number of households with income $50k - 60k:
Gilman:
5.1% (13)
Iowa:
8.0% (94,176)
Number of households with income $60k - 75k:
Gilman:
7.8% (20)
State:
10.5% (123,053)
Number of households with income $75k - 100k:
Gilman:
18.0% (46)
State:
14.4% (168,483)
Number of households with income $100k - 125k:
Gilman:
39.2% (100)
State:
10.6% (124,515)
Number of households with income $125k - 150k:
Gilman:
2.4% (6)
Iowa:
7.4% (87,043)
Number of households with income $150k - 200k:
Gilman:
6.3% (16)
State:
7.8% (91,953)
Number of households with income > $200k:
Gilman:
0.0% (0)
State:
7.6% (88,587)
Aggregate household income in Gilman in 2022: $23,263,287
Median family income in Gilman in 2022:
Gilman:
$101,086
Iowa:
$93,591
Number of families with income < $10k:
Gilman:
8.8% (12)
State:
2.1% (15,266)
Number of families with income $20k - 30k:
Gilman:
1.5% (2)
State:
4.0% (28,678)
Number of families with income $30k - 40k:
Gilman:
4.1% (6)
Iowa:
5.0% (36,249)
Number of families with income $40k - 50k:
Gilman:
4.3% (6)
Iowa:
6.3% (45,169)
Number of families with income $50k - 60k:
Gilman:
2.9% (4)
State:
6.7% (48,577)
Number of families with income $60k - 75k:
Gilman:
5.1% (7)
State:
10.4% (75,030)
Number of families with income $75k - 100k:
Gilman:
23.0% (32)
State:
16.7% (120,450)
Number of families with income $100k - 125k:
Gilman:
34.5% (48)
State:
13.8% (99,746)
Number of families with income $125k - 150k:
Gilman:
4.3% (6)
State:
10.2% (73,833)
Number of families with income $150k - 200k:
Gilman:
11.6% (16)
Iowa:
11.3% (81,189)
Median non-family income in Gilman in 2022:
Gilman:
$96,198
Iowa:
$41,981
Median per capita income in Gilman in 2022:
Gilman:
$40,541
State:
$41,266
Income statistics for Multirace residents
Aggregate household income in Gilman in 2022: $1,224,851
Median per capita income in Gilman in 2022:
Gilman:
$32,585
Iowa:
$24,977
Discuss Gilman, Iowa (IA) on our hugely popular Iowa forum.