Hillsboro, Kentucky (KY) income map, earnings map, and wages data
The median household income in Hillsboro, KY in 2022 was $45,610, which was 30.1% less than the median annual income of $59,341 across the entire state of Kentucky. Compared to the median income of $25,848 in 2000 this represents an increase of 43.3%. The per capita income in 2022 was $23,900, which means an increase of 47.0% compared to 2000 when it was $12,673.
Income statistics for all residents
Median household income in Hillsboro, KY in 2022:| Hillsboro: | $45,611 |
| Kentucky: | $59,341 |
Change in median household income between 2000 and 2022:| Hillsboro, Kentucky: | +76.5% |
| State: | +76.2% |
Number of households with income < $10k:| Hillsboro: | 6.8% (47,264) |
| Kentucky: | 6.8% (123,697) |
Number of households with income $10k - 20k:| Hillsboro: | 10.0% (70,204) |
| State: | 10.0% (182,645) |
Number of households with income $20k - 30k:| Hillsboro: | 9.0% (62,814) |
| Kentucky: | 9.0% (164,092) |
Number of households with income $30k - 40k:| Hillsboro: | 9.1% (63,591) |
| State: | 9.1% (165,607) |
Number of households with income $40k - 50k:| Hillsboro: | 8.0% (55,688) |
| State: | 8.0% (146,315) |
Number of households with income $50k - 60k:| Hillsboro: | 7.7% (53,975) |
| Kentucky: | 7.7% (140,671) |
Number of households with income $60k - 75k:| Hillsboro: | 9.8% (68,605) |
| State: | 9.8% (180,002) |
Number of households with income $75k - 100k:| Hillsboro: | 12.6% (88,179) |
| State: | 12.6% (230,239) |
Number of households with income $100k - 125k:| Hillsboro: | 9.0% (62,966) |
| Kentucky: | 9.0% (164,398) |
Number of households with income $125k - 150k:| Hillsboro: | 5.9% (41,409) |
| State: | 5.9% (108,602) |
Number of households with income $150k - 200k:| Hillsboro: | 6.1% (42,899) |
| Kentucky: | 6.2% (112,813) |
Number of households with income > $200k:| Hillsboro: | 5.9% (41,408) |
| State: | 6.0% (109,599) |
Aggregate household income in Hillsboro in 2022: $1,802,625,014
Median family income in Hillsboro in 2022:| Hillsboro: | $56,560 |
| Kentucky: | $76,119 |
Median non-family income in Hillsboro in 2022:| Hillsboro: | $19,042 |
| State: | $33,993 |
Change in median non-family income between 2000 and 2022:| Hillsboro, Kentucky: | +80.5% |
| State: | +79.2% |
Median per capita income in Hillsboro in 2022:| Hillsboro: | $23,900 |
| Kentucky: | $33,980 |
Change in median per capita income between 2000 and 2022:| Hillsboro, Kentucky: | +88.6% |
| State: | +87.8% |
Income statistics for White residents
Median household income in Hillsboro, KY in 2022:| Hillsboro: | $45,843 |
| State: | $60,987 |
Change in median household income between 2000 and 2022:| Hillsboro, Kentucky: | +76.6% |
| State: | +76.2% |
Number of households with income < $10k:| Hillsboro: | 6.2% (36,612) |
| Kentucky: | 6.2% (96,690) |
Number of households with income $10k - 20k:| Hillsboro: | 9.8% (57,498) |
| Kentucky: | 9.7% (151,125) |
Number of households with income $20k - 30k:| Hillsboro: | 9.0% (52,773) |
| State: | 8.9% (139,532) |
Number of households with income $30k - 40k:| Hillsboro: | 9.1% (53,879) |
| State: | 9.1% (142,284) |
Number of households with income $40k - 50k:| Hillsboro: | 7.7% (45,402) |
| State: | 7.7% (121,151) |
Number of households with income $50k - 60k:| Hillsboro: | 7.7% (45,413) |
| State: | 7.7% (119,790) |
Number of households with income $60k - 75k:| Hillsboro: | 9.8% (57,820) |
| Kentucky: | 9.9% (154,174) |
Number of households with income $75k - 100k:| Hillsboro: | 12.8% (75,339) |
| State: | 12.8% (199,740) |
Number of households with income $100k - 125k:| Hillsboro: | 9.4% (55,082) |
| State: | 9.4% (146,284) |
Number of households with income $125k - 150k:| Hillsboro: | 6.0% (35,296) |
| State: | 6.0% (94,180) |
Number of households with income $150k - 200k:| Hillsboro: | 6.4% (37,575) |
| State: | 6.4% (100,702) |
Number of households with income > $200k:| Hillsboro: | 6.2% (36,365) |
| State: | 6.3% (98,502) |
Aggregate household income in Hillsboro in 2022: $1,567,626,717
Median family income in Hillsboro in 2022:| Hillsboro: | $57,552 |
| Kentucky: | $78,353 |
Number of families with income < $10k:| Hillsboro: | 8.0% (68) |
| State: | 3.7% (37,075) |
Number of families with income $10k - 20k:| Hillsboro: | 9.4% (80) |
| State: | 4.9% (49,864) |
Number of families with income $20k - 30k:| Hillsboro: | 12.4% (105) |
| Kentucky: | 6.4% (64,043) |
Number of families with income $30k - 40k:| Hillsboro: | 14.9% (127) |
| State: | 8.0% (81,080) |
Number of families with income $40k - 50k:| Hillsboro: | 9.1% (77) |
| State: | 6.9% (69,099) |
Number of families with income $50k - 60k:| Hillsboro: | 9.2% (78) |
| Kentucky: | 7.2% (72,955) |
Number of families with income $60k - 75k:| Hillsboro: | 6.1% (52) |
| State: | 10.4% (104,587) |
Number of families with income $75k - 100k:| Hillsboro: | 8.5% (73) |
| State: | 15.0% (151,545) |
Number of families with income $100k - 125k:| Hillsboro: | 12.4% (105) |
| State: | 11.9% (120,340) |
Number of families with income $150k - 200k:| Hillsboro: | 10.0% (85) |
| State: | 8.8% (89,097) |
Median non-family income in Hillsboro in 2022:| Hillsboro: | $18,953 |
| Kentucky: | $34,415 |
Change in median non-family income between 2000 and 2022:| Hillsboro, Kentucky: | +79.7% |
| State: | +78.3% |
Median per capita income in Hillsboro in 2022:| Hillsboro: | $24,372 |
| Kentucky: | $35,352 |
Change in median per capita income between 2000 and 2022:| Hillsboro, Kentucky: | +90.9% |
| State: | +90.2% |
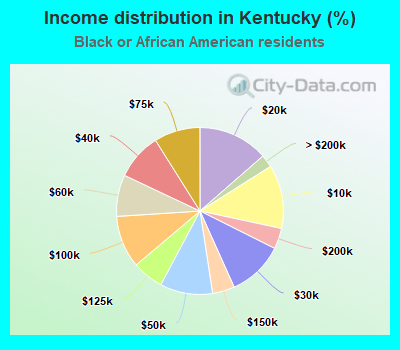
Income statistics for Black or African American residents
Median household income in Hillsboro, KY in 2022:| Hillsboro: | $20,397 |
| State: | $43,977 |
Change in median household income between 2000 and 2022:| Hillsboro, Kentucky: | +81.3% |
| State: | +81.1% |
Number of households with income < $10k:| Hillsboro: | 12.3% (3,962) |
| Kentucky: | 12.3% (17,072) |
Number of households with income $10k - 20k:| Hillsboro: | 13.6% (4,360) |
| State: | 13.6% (18,796) |
Number of households with income $20k - 30k:| Hillsboro: | 10.9% (3,498) |
| State: | 10.9% (15,069) |
Number of households with income $30k - 40k:| Hillsboro: | 9.0% (2,901) |
| Kentucky: | 9.0% (12,510) |
Number of households with income $40k - 50k:| Hillsboro: | 10.2% (3,270) |
| State: | 10.2% (14,121) |
Number of households with income $50k - 60k:| Hillsboro: | 8.1% (2,584) |
| State: | 8.1% (11,147) |
Number of households with income $60k - 75k:| Hillsboro: | 8.9% (2,869) |
| Kentucky: | 8.9% (12,361) |
Number of households with income $75k - 100k:| Hillsboro: | 10.1% (3,242) |
| Kentucky: | 10.1% (14,009) |
Number of households with income $100k - 125k:| Hillsboro: | 6.1% (1,947) |
| State: | 6.1% (8,400) |
Number of households with income $125k - 150k:| Hillsboro: | 4.3% (1,380) |
| State: | 4.3% (5,950) |
Number of households with income $150k - 200k:| Hillsboro: | 4.0% (1,292) |
| State: | 4.0% (5,560) |
Number of households with income > $200k:| Hillsboro: | 2.5% (789) |
| State: | 2.5% (3,413) |
Aggregate household income in Hillsboro in 2022: $227,143
Median family income in Hillsboro in 2022:| Hillsboro: | $19,921 |
| State: | $54,745 |
Median per capita income in Hillsboro in 2022:| Hillsboro: | $4,485 |
| Kentucky: | $27,117 |
Change in median per capita income between 2000 and 2022:| Hillsboro, Kentucky: | +102.4% |
| Kentucky: | +104.9% |