The median household income in Kingston Springs, TN in 2022 was $93,913, which was 30.5% greater than the median annual income of $65,254 across the entire state of Tennessee. Compared to the median income of $58,490 in 2000 this represents an increase of 37.7%. The per capita income in 2022 was $45,655, which means an increase of 46.3% compared to 2000 when it was $24,519.
Whole page based on the data from 2000 / 2022 when the population of Kingston Springs, Tennessee was 2,773 / 2,850
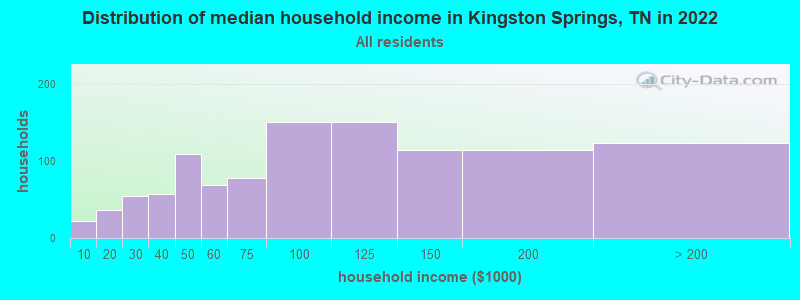
Income statistics for all residents
Median household income in Kingston Springs, TN in 2022:
Kingston Springs:
$93,913
State:
$65,254
Change in median household income between 2000 and 2022:
Kingston Springs, Tennessee:
+60.6%
State:
+79.5%
Number of households with income < $10k:
Kingston Springs:
2.0% (22)
Tennessee:
5.4% (154,793)
Number of households with income $10k - 20k:
Kingston Springs:
3.4% (37)
State:
8.0% (228,599)
Number of households with income $20k - 30k:
Kingston Springs:
5.1% (55)
Tennessee:
7.9% (224,908)
Number of households with income $30k - 40k:
Kingston Springs:
5.3% (57)
State:
8.6% (244,297)
Number of households with income $40k - 50k:
Kingston Springs:
10.1% (109)
State:
8.4% (238,949)
Number of households with income $50k - 60k:
Kingston Springs:
6.4% (69)
State:
7.7% (218,438)
Number of households with income $60k - 75k:
Kingston Springs:
7.2% (78)
State:
10.3% (294,172)
Number of households with income $75k - 100k:
Kingston Springs:
13.9% (151)
State:
13.3% (377,310)
Number of households with income $100k - 125k:
Kingston Springs:
13.9% (151)
State:
9.5% (269,124)
Number of households with income $125k - 150k:
Kingston Springs:
10.6% (115)
Tennessee:
6.3% (178,328)
Number of households with income $150k - 200k:
Kingston Springs:
10.6% (115)
State:
7.2% (204,030)
Number of households with income > $200k:
Kingston Springs:
11.4% (124)
State:
7.5% (213,736)
Aggregate household income in Kingston Springs in 2022: $128,318,790
Median family income in Kingston Springs in 2022:
Kingston Springs:
$100,240
State:
$80,910
Number of families with income < $10k:
Kingston Springs:
2.4% (20)
State:
3.9% (72,917)
Number of families with income $10k - 20k:
Kingston Springs:
1.9% (16)
Tennessee:
4.0% (73,770)
Number of families with income $20k - 30k:
Kingston Springs:
1.7% (14)
State:
5.6% (104,070)
Number of families with income $30k - 40k:
Kingston Springs:
6.1% (51)
State:
7.2% (133,292)
Number of families with income $40k - 50k:
Kingston Springs:
11.0% (92)
Tennessee:
7.4% (136,997)
Number of families with income $50k - 60k:
Kingston Springs:
5.5% (46)
State:
7.1% (131,374)
Number of families with income $60k - 75k:
Kingston Springs:
7.6% (64)
State:
10.8% (198,685)
Number of families with income $75k - 100k:
Kingston Springs:
13.7% (114)
Tennessee:
15.1% (279,195)
Number of families with income $100k - 125k:
Kingston Springs:
17.0% (142)
State:
11.7% (216,356)
Number of families with income $125k - 150k:
Kingston Springs:
11.1% (92)
Tennessee:
7.8% (144,000)
Number of families with income $150k - 200k:
Kingston Springs:
10.0% (83)
State:
9.3% (172,160)
Number of families with income > $200k:
Kingston Springs:
12.1% (101)
Tennessee:
10.0% (183,756)
Median non-family income in Kingston Springs in 2022:
Kingston Springs:
$59,619
State:
$40,285
Change in median non-family income between 2000 and 2022:
Kingston Springs, Tennessee:
+76.6%
State:
+91.5%
Median per capita income in Kingston Springs in 2022:
Kingston Springs:
$45,656
Tennessee:
$36,704
Change in median per capita income between 2000 and 2022:
Kingston Springs, Tennessee:
+86.2%
Tennessee:
+89.3%
Income statistics for White residents
Median household income in Kingston Springs, TN in 2022:
Kingston Springs:
$94,780
State:
$69,826
Change in median household income between 2000 and 2022:
Kingston Springs, Tennessee:
+61.0%
State:
+82.9%
Number of households with income < $10k:
Kingston Springs:
1.3% (13)
State:
4.6% (100,279)
Number of households with income $10k - 20k:
Kingston Springs:
3.8% (37)
Tennessee:
7.6% (165,031)
Number of households with income $20k - 30k:
Kingston Springs:
4.9% (48)
State:
7.4% (160,229)
Number of households with income $30k - 40k:
Kingston Springs:
5.7% (56)
State:
8.1% (174,784)
Number of households with income $40k - 50k:
Kingston Springs:
7.7% (76)
Tennessee:
7.8% (169,622)
Number of households with income $50k - 60k:
Kingston Springs:
7.0% (69)
State:
7.6% (165,508)
Number of households with income $60k - 75k:
Kingston Springs:
7.8% (77)
State:
10.3% (223,937)
Number of households with income $75k - 100k:
Kingston Springs:
13.0% (128)
State:
13.5% (292,688)
Number of households with income $100k - 125k:
Kingston Springs:
13.5% (133)
State:
10.1% (219,251)
Number of households with income $125k - 150k:
Kingston Springs:
11.1% (109)
Tennessee:
6.6% (142,574)
Number of households with income $150k - 200k:
Kingston Springs:
11.3% (111)
Tennessee:
7.7% (166,039)
Number of households with income > $200k:
Kingston Springs:
12.7% (125)
State:
8.5% (184,546)
Aggregate household income in Kingston Springs in 2022: $120,863,041
Median family income in Kingston Springs in 2022:
Kingston Springs:
$102,166
State:
$86,015
Number of families with income < $10k:
Kingston Springs:
1.3% (9)
State:
3.1% (43,751)
Number of families with income $10k - 20k:
Kingston Springs:
2.1% (16)
State:
3.5% (49,925)
Number of families with income $20k - 30k:
Kingston Springs:
1.0% (7)
Tennessee:
5.0% (70,431)
Number of families with income $30k - 40k:
Kingston Springs:
6.6% (49)
Tennessee:
6.6% (93,498)
Number of families with income $40k - 50k:
Kingston Springs:
8.9% (66)
State:
6.8% (96,726)
Number of families with income $50k - 60k:
Kingston Springs:
6.1% (46)
Tennessee:
7.2% (101,879)
Number of families with income $60k - 75k:
Kingston Springs:
8.4% (62)
State:
10.7% (151,997)
Number of families with income $75k - 100k:
Kingston Springs:
12.4% (92)
Tennessee:
15.4% (218,373)
Number of families with income $100k - 125k:
Kingston Springs:
16.8% (124)
Tennessee:
12.6% (178,761)
Number of families with income $125k - 150k:
Kingston Springs:
11.9% (88)
State:
8.2% (116,575)
Number of families with income $150k - 200k:
Kingston Springs:
10.8% (80)
Tennessee:
9.9% (141,123)
Number of families with income > $200k:
Kingston Springs:
13.7% (101)
Tennessee:
11.2% (159,431)
Median non-family income in Kingston Springs in 2022:
Kingston Springs:
$59,358
Tennessee:
$41,178
Change in median non-family income between 2000 and 2022:
Kingston Springs, Tennessee:
+79.2%
Tennessee:
+91.1%
Median per capita income in Kingston Springs in 2022:
Kingston Springs:
$47,859
Tennessee:
$40,126
Change in median per capita income between 2000 and 2022:
Kingston Springs, Tennessee:
+93.3%
Tennessee:
+92.6%
Income statistics for Black or African American residents
Aggregate household income in Kingston Springs in 2022: $948,049
Median per capita income in Kingston Springs in 2022:
Kingston Springs:
$34,596
State:
$27,306
Income statistics for Hispanic or Latino residents
Median household income in Kingston Springs, TN in 2022:
Kingston Springs:
$95,560
State:
$58,385
Number of households with income < $10k:
Kingston Springs:
0.0% (0)
State:
7.2% (8,567)
Number of households with income $10k - 20k:
Kingston Springs:
0.0% (0)
State:
6.4% (7,670)
Number of households with income $20k - 30k:
Kingston Springs:
0.0% (0)
State:
9.4% (11,247)
Number of households with income $30k - 40k:
Kingston Springs:
0.0% (0)
State:
10.1% (12,072)
Number of households with income $40k - 50k:
Kingston Springs:
0.0% (0)
State:
10.0% (11,947)
Number of households with income $50k - 60k:
Kingston Springs:
0.0% (0)
Tennessee:
8.0% (9,569)
Number of households with income $60k - 75k:
Kingston Springs:
30.8% (12)
State:
10.3% (12,315)
Number of households with income $75k - 100k:
Kingston Springs:
23.1% (9)
State:
15.3% (18,285)
Number of households with income $100k - 125k:
Kingston Springs:
46.2% (18)
State:
8.3% (9,886)
Number of households with income $125k - 150k:
Kingston Springs:
0.0% (0)
State:
5.9% (7,066)
Number of households with income $150k - 200k:
Kingston Springs:
0.0% (0)
State:
4.9% (5,822)
Number of households with income > $200k:
Kingston Springs:
0.0% (0)
State:
4.5% (5,337)
Aggregate household income in Kingston Springs in 2022: $3,319,961
Median per capita income in Kingston Springs in 2022:
Kingston Springs:
$45,430
State:
$21,276
Change in median per capita income between 2000 and 2022:
Kingston Springs, Tennessee:
+118.5%
State:
+76.0%
Income statistics for Multirace residents
Number of households with income < $10k:
Kingston Springs:
14.6% (14)
Tennessee:
6.7% (9,867)
Number of households with income $10k - 20k:
Kingston Springs:
0.0% (0)
State:
8.6% (12,639)
Number of households with income $20k - 30k:
Kingston Springs:
5.2% (5)
State:
9.2% (13,555)
Number of households with income $30k - 40k:
Kingston Springs:
0.0% (0)
Tennessee:
10.3% (15,117)
Number of households with income $40k - 50k:
Kingston Springs:
45.8% (44)
State:
9.4% (13,829)
Number of households with income $50k - 60k:
Kingston Springs:
0.0% (0)
Tennessee:
7.5% (10,969)
Number of households with income $60k - 75k:
Kingston Springs:
0.0% (0)
State:
9.2% (13,568)
Number of households with income $75k - 100k:
Kingston Springs:
30.2% (29)
Tennessee:
12.6% (18,516)
Number of households with income $100k - 125k:
Kingston Springs:
0.0% (0)
State:
8.6% (12,656)
Number of households with income $125k - 150k:
Kingston Springs:
4.2% (4)
State:
5.9% (8,674)
Number of households with income $150k - 200k:
Kingston Springs:
0.0% (0)
State:
7.2% (10,611)
Number of households with income > $200k:
Kingston Springs:
0.0% (0)
Tennessee:
4.8% (6,986)
Aggregate household income in Kingston Springs in 2022: $4,628,745
Median per capita income in Kingston Springs in 2022:
Kingston Springs:
$19,979
State:
$24,436
Income statistics for other residents
Number of households with income < $10k:
Kingston Springs:
0.0% (0)
State:
6.8% (2,986)
Number of households with income $10k - 20k:
Kingston Springs:
0.0% (0)
State:
6.3% (2,777)
Number of households with income $20k - 30k:
Kingston Springs:
13.6% (3)
Tennessee:
9.2% (4,034)
Number of households with income $30k - 40k:
Kingston Springs:
0.0% (0)
State:
13.2% (5,819)
Number of households with income $40k - 50k:
Kingston Springs:
0.0% (0)
State:
11.9% (5,244)
Number of households with income $50k - 60k:
Kingston Springs:
0.0% (0)
State:
7.3% (3,232)
Number of households with income $60k - 75k:
Kingston Springs:
0.0% (0)
Tennessee:
12.2% (5,384)
Number of households with income $75k - 100k:
Kingston Springs:
0.0% (0)
State:
13.1% (5,771)
Number of households with income $100k - 125k:
Kingston Springs:
86.4% (19)
State:
7.8% (3,429)
Number of households with income $125k - 150k:
Kingston Springs:
0.0% (0)
State:
4.3% (1,881)
Number of households with income $150k - 200k:
Kingston Springs:
0.0% (0)
Tennessee:
3.4% (1,486)
Number of households with income > $200k:
Kingston Springs:
0.0% (0)
State:
4.6% (2,040)
Aggregate household income in Kingston Springs in 2022: $2,196,876
Median per capita income in Kingston Springs in 2022:
Kingston Springs:
$60,993
State:
$21,430
Discuss Kingston Springs, Tennessee (TN) on our hugely popular Tennessee forum.