Kirkland, North Carolina (NC) income map, earnings map, and wages data
The median household income in Kirkland, NC in 2022 was $98,768, which was 31.7% greater than the median annual income of $67,481 across the entire state of North Carolina. Compared to the median income of $56,292 in 2000 this represents an increase of 43.0%. The per capita income in 2022 was $40,552, which means an increase of 47.1% compared to 2000 when it was $21,439.
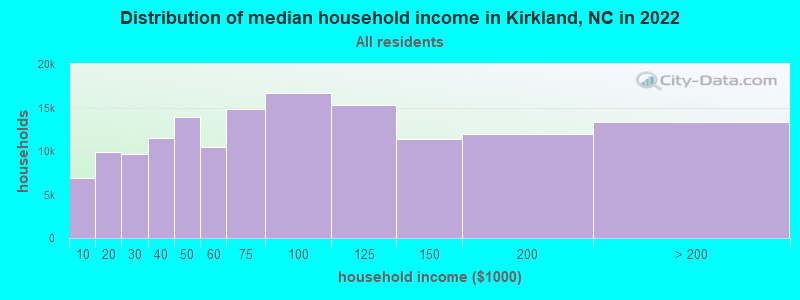
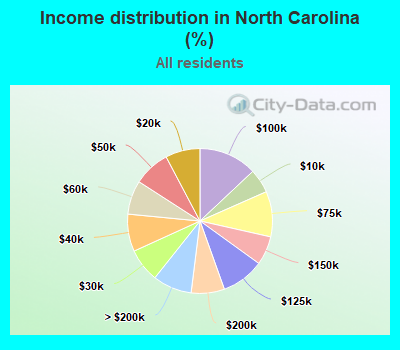
Income statistics for all residents
Median household income in Kirkland, NC in 2022:| Kirkland: | $98,769 |
| State: | $67,481 |
Change in median household income between 2000 and 2022:| Kirkland, North Carolina: | +75.5% |
| State: | +72.2% |
Number of households with income < $10k:| Kirkland: | 4.7% (6,889) |
| North Carolina: | 5.4% (232,212) |
Number of households with income $10k - 20k:| Kirkland: | 6.8% (9,925) |
| State: | 7.7% (331,976) |
Number of households with income $20k - 30k:| Kirkland: | 6.6% (9,676) |
| State: | 7.5% (321,882) |
Number of households with income $30k - 40k:| Kirkland: | 7.9% (11,490) |
| State: | 8.3% (358,489) |
Number of households with income $40k - 50k:| Kirkland: | 9.5% (13,901) |
| State: | 8.2% (350,907) |
Number of households with income $50k - 60k:| Kirkland: | 7.2% (10,442) |
| North Carolina: | 7.6% (326,126) |
Number of households with income $60k - 75k:| Kirkland: | 10.2% (14,837) |
| State: | 10.1% (435,678) |
Number of households with income $75k - 100k:| Kirkland: | 11.4% (16,628) |
| State: | 13.0% (558,943) |
Number of households with income $100k - 125k:| Kirkland: | 10.5% (15,302) |
| North Carolina: | 9.6% (411,954) |
Number of households with income $125k - 150k:| Kirkland: | 7.8% (11,413) |
| State: | 6.4% (276,370) |
Number of households with income $150k - 200k:| Kirkland: | 8.2% (11,921) |
| State: | 7.4% (319,173) |
Number of households with income > $200k:| Kirkland: | 9.1% (13,278) |
| North Carolina: | 8.7% (375,556) |
Aggregate household income in Kirkland in 2022: $53,235,058
Median family income in Kirkland in 2022:| Kirkland: | $106,860 |
| State: | $83,448 |
Median non-family income in Kirkland in 2022:| Kirkland: | $86,883 |
| North Carolina: | $41,534 |
Change in median non-family income between 2000 and 2022:| Kirkland, North Carolina: | +92.5% |
| State: | +78.7% |
Median per capita income in Kirkland in 2022:| Kirkland: | $40,553 |
| North Carolina: | $38,701 |
Change in median per capita income between 2000 and 2022:| Kirkland, North Carolina: | +89.2% |
| State: | +90.6% |
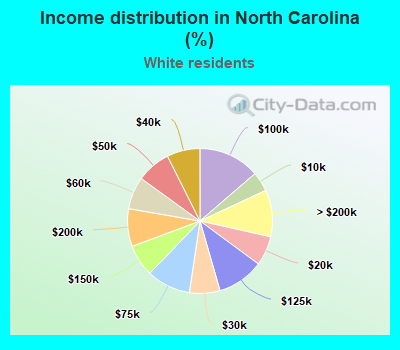
Income statistics for White residents
Median household income in Kirkland, NC in 2022:| Kirkland: | $108,718 |
| North Carolina: | $75,197 |
Change in median household income between 2000 and 2022:| Kirkland, North Carolina: | +71.3% |
| State: | +76.8% |
Number of households with income < $10k:| Kirkland: | 4.3% (5,240) |
| State: | 4.4% (125,166) |
Number of households with income $10k - 20k:| Kirkland: | 5.3% (6,459) |
| North Carolina: | 6.6% (187,893) |
Number of households with income $20k - 30k:| Kirkland: | 6.5% (7,944) |
| State: | 6.8% (194,490) |
Number of households with income $30k - 40k:| Kirkland: | 7.2% (8,804) |
| State: | 7.4% (210,508) |
Number of households with income $40k - 50k:| Kirkland: | 10.1% (12,268) |
| North Carolina: | 7.6% (217,521) |
Number of households with income $50k - 60k:| Kirkland: | 6.4% (7,843) |
| North Carolina: | 7.2% (206,197) |
Number of households with income $60k - 75k:| Kirkland: | 10.6% (12,924) |
| State: | 9.8% (279,732) |
Number of households with income $75k - 100k:| Kirkland: | 11.6% (14,148) |
| State: | 13.7% (390,042) |
Number of households with income $100k - 125k:| Kirkland: | 9.5% (11,581) |
| North Carolina: | 10.4% (297,273) |
Number of households with income $125k - 150k:| Kirkland: | 8.4% (10,214) |
| North Carolina: | 7.2% (203,852) |
Number of households with income $150k - 200k:| Kirkland: | 9.2% (11,240) |
| State: | 8.4% (239,971) |
Number of households with income > $200k:| Kirkland: | 10.7% (13,019) |
| State: | 10.4% (297,649) |
Aggregate household income in Kirkland in 2022: $33,871,753
Median family income in Kirkland in 2022:| Kirkland: | $119,947 |
| State: | $93,403 |
Number of families with income < $10k:| Kirkland: | 6.9% (7) |
| North Carolina: | 2.4% (45,246) |
Number of families with income $50k - 60k:| Kirkland: | 16.2% (17) |
| State: | 6.6% (122,527) |
Number of families with income $60k - 75k:| Kirkland: | 32.2% (34) |
| State: | 9.8% (182,594) |
Number of families with income $75k - 100k:| Kirkland: | 44.7% (47) |
| North Carolina: | 15.5% (287,614) |
Median non-family income in Kirkland in 2022:| Kirkland: | $87,325 |
| State: | $44,158 |
Change in median non-family income between 2000 and 2022:| Kirkland, North Carolina: | +84.3% |
| State: | +76.3% |
Median per capita income in Kirkland in 2022:| Kirkland: | $49,952 |
| State: | $44,946 |
Change in median per capita income between 2000 and 2022:| Kirkland, North Carolina: | +89.0% |
| State: | +95.8% |
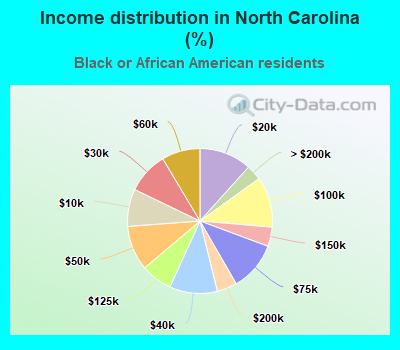
Income statistics for Black or African American residents
Median household income in Kirkland, NC in 2022:| Kirkland: | $85,098 |
| North Carolina: | $50,059 |
Change in median household income between 2000 and 2022:| Kirkland, North Carolina: | +104.0% |
| North Carolina: | +79.8% |
Number of households with income < $10k:| Kirkland: | 7.4% (1,491) |
| State: | 8.3% (74,698) |
Number of households with income $10k - 20k:| Kirkland: | 14.6% (2,925) |
| State: | 11.7% (104,693) |
Number of households with income $20k - 30k:| Kirkland: | 7.5% (1,503) |
| State: | 9.3% (82,966) |
Number of households with income $30k - 40k:| Kirkland: | 10.1% (2,036) |
| State: | 10.7% (95,641) |
Number of households with income $40k - 50k:| Kirkland: | 9.6% (1,927) |
| North Carolina: | 10.0% (89,655) |
Number of households with income $50k - 60k:| Kirkland: | 8.5% (1,706) |
| North Carolina: | 8.6% (76,854) |
Number of households with income $60k - 75k:| Kirkland: | 13.5% (2,715) |
| State: | 11.0% (98,582) |
Number of households with income $75k - 100k:| Kirkland: | 7.4% (1,476) |
| North Carolina: | 11.3% (101,044) |
Number of households with income $100k - 125k:| Kirkland: | 8.8% (1,760) |
| State: | 7.0% (62,890) |
Number of households with income $125k - 150k:| Kirkland: | 4.2% (838) |
| North Carolina: | 4.3% (38,737) |
Number of households with income $150k - 200k:| Kirkland: | 5.1% (1,021) |
| North Carolina: | 4.5% (39,994) |
Number of households with income > $200k:| Kirkland: | 3.4% (674) |
| State: | 3.4% (30,594) |
Aggregate household income in Kirkland in 2022: $6,614,897
Median family income in Kirkland in 2022:| Kirkland: | $106,446 |
| North Carolina: | $61,678 |
Number of families with income $10k - 20k:| Kirkland: | 14.9% (8) |
| North Carolina: | 7.5% (39,405) |
Number of families with income $40k - 50k:| Kirkland: | 27.8% (14) |
| North Carolina: | 9.3% (49,010) |
Number of families with income $50k - 60k:| Kirkland: | 57.3% (29) |
| North Carolina: | 7.9% (41,389) |
Median non-family income in Kirkland in 2022:| Kirkland: | $79,477 |
| North Carolina: | $34,291 |
Change in median non-family income between 2000 and 2022:| Kirkland, North Carolina: | +139.9% |
| North Carolina: | +94.9% |
Median per capita income in Kirkland in 2022:| Kirkland: | $32,039 |
| State: | $28,411 |
Change in median per capita income between 2000 and 2022:| Kirkland, North Carolina: | +118.4% |
| State: | +109.7% |
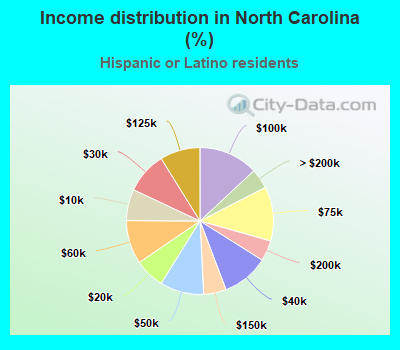
Income statistics for Hispanic or Latino residents
Median household income in Kirkland, NC in 2022:| Kirkland: | $172,323 |
| State: | $57,348 |
Change in median household income between 2000 and 2022:| Kirkland, North Carolina: | +101.6% |
| State: | +77.3% |
Number of households with income < $10k:| Kirkland: | 6.9% (27,898) |
| State: | 6.9% (21,164) |
Number of households with income $10k - 20k:| Kirkland: | 6.6% (26,755) |
| State: | 6.6% (20,272) |
Number of households with income $20k - 30k:| Kirkland: | 9.2% (37,229) |
| State: | 9.2% (28,070) |
Number of households with income $30k - 40k:| Kirkland: | 10.3% (41,393) |
| North Carolina: | 10.3% (31,524) |
Number of households with income $40k - 50k:| Kirkland: | 9.6% (38,801) |
| State: | 9.6% (29,552) |
Number of households with income $50k - 60k:| Kirkland: | 9.6% (38,811) |
| State: | 9.6% (29,493) |
Number of households with income $60k - 75k:| Kirkland: | 11.9% (48,017) |
| State: | 11.9% (36,598) |
Number of households with income $75k - 100k:| Kirkland: | 13.0% (52,553) |
| State: | 13.1% (40,020) |
Number of households with income $100k - 125k:| Kirkland: | 8.8% (35,466) |
| State: | 8.8% (27,080) |
Number of households with income $125k - 150k:| Kirkland: | 5.0% (20,085) |
| State: | 5.0% (15,248) |
Number of households with income $150k - 200k:| Kirkland: | 4.5% (18,268) |
| State: | 4.6% (13,955) |
Number of households with income > $200k:| Kirkland: | 4.4% (17,572) |
| State: | 4.4% (13,490) |
Aggregate household income in Kirkland in 2022: $6,958,491
Median family income in Kirkland in 2022:| Kirkland: | $204,858 |
| North Carolina: | $59,574 |
Number of families with income < $10k:| Kirkland: | 13.1% (2) |
| State: | 6.0% (14,112) |
Number of families with income $50k - 60k:| Kirkland: | 29.0% (4) |
| State: | 9.9% (23,438) |
Number of families with income $60k - 75k:| Kirkland: | 33.7% (5) |
| North Carolina: | 12.5% (29,589) |
Number of families with income $75k - 100k:| Kirkland: | 24.2% (3) |
| State: | 12.9% (30,509) |
Median per capita income in Kirkland in 2022:| Kirkland: | $126,491 |
| North Carolina: | $21,631 |
Change in median per capita income between 2000 and 2022:| Kirkland, North Carolina: | +80.4% |
| State: | +94.9% |