Leicester, Vermont (VT) income map, earnings map, and wages data
The median household income in Leicester, VT in 2022 was $65,241, which was 13.4% less than the median annual income of $73,991 across the entire state of Vermont. Compared to the median income of $35,781 in 2000 this represents an increase of 45.2%. The per capita income in 2022 was $44,930, which means an increase of 51.2% compared to 2000 when it was $21,938.
Income statistics for all residents
Median household income in Leicester, VT in 2022:| Leicester: | $65,241 |
| State: | $73,991 |
Change in median household income between 2000 and 2022:| Leicester, Vermont: | +82.3% |
| State: | +81.1% |
Number of households with income < $10k:| Leicester: | 4.1% (4,982) |
| State: | 4.0% (11,050) |
Number of households with income $10k - 20k:| Leicester: | 6.9% (8,390) |
| Vermont: | 6.8% (18,853) |
Number of households with income $20k - 30k:| Leicester: | 7.5% (9,166) |
| Vermont: | 7.5% (20,673) |
Number of households with income $30k - 40k:| Leicester: | 7.8% (9,557) |
| State: | 7.8% (21,750) |
Number of households with income $40k - 50k:| Leicester: | 7.4% (9,089) |
| State: | 7.4% (20,642) |
Number of households with income $50k - 60k:| Leicester: | 7.2% (8,754) |
| State: | 7.2% (19,901) |
Number of households with income $60k - 75k:| Leicester: | 9.9% (12,067) |
| Vermont: | 9.9% (27,351) |
Number of households with income $75k - 100k:| Leicester: | 13.7% (16,763) |
| State: | 13.8% (38,275) |
Number of households with income $100k - 125k:| Leicester: | 9.6% (11,719) |
| State: | 9.6% (26,632) |
Number of households with income $125k - 150k:| Leicester: | 7.5% (9,161) |
| State: | 7.5% (20,857) |
Number of households with income $150k - 200k:| Leicester: | 9.9% (12,106) |
| Vermont: | 9.9% (27,469) |
Number of households with income > $200k:| Leicester: | 8.5% (10,370) |
| State: | 8.5% (23,637) |
Aggregate household income in Leicester in 2022: $134,866,389
Median family income in Leicester in 2022:| Leicester: | $91,971 |
| Vermont: | $96,345 |
Median non-family income in Leicester in 2022:| Leicester: | $44,635 |
| State: | $46,022 |
Change in median non-family income between 2000 and 2022:| Leicester, Vermont: | +87.9% |
| State: | +87.4% |
Median per capita income in Leicester in 2022:| Leicester: | $44,931 |
| State: | $42,251 |
Change in median per capita income between 2000 and 2022:| Leicester, Vermont: | +104.8% |
| State: | +104.9% |
Income statistics for White residents
Median household income in Leicester, VT in 2022:| Leicester: | $65,690 |
| State: | $73,591 |
Change in median household income between 2000 and 2022:| Leicester, Vermont: | +80.8% |
| State: | +79.2% |
Number of households with income < $10k:| Leicester: | 3.8% (4,307) |
| State: | 3.7% (9,508) |
Number of households with income $10k - 20k:| Leicester: | 6.7% (7,659) |
| Vermont: | 6.7% (17,064) |
Number of households with income $20k - 30k:| Leicester: | 7.3% (8,294) |
| State: | 7.2% (18,552) |
Number of households with income $30k - 40k:| Leicester: | 8.1% (9,265) |
| Vermont: | 8.2% (20,886) |
Number of households with income $40k - 50k:| Leicester: | 7.5% (8,527) |
| State: | 7.5% (19,216) |
Number of households with income $50k - 60k:| Leicester: | 7.4% (8,388) |
| Vermont: | 7.4% (18,898) |
Number of households with income $60k - 75k:| Leicester: | 10.2% (11,563) |
| State: | 10.1% (25,944) |
Number of households with income $75k - 100k:| Leicester: | 13.6% (15,453) |
| State: | 13.7% (34,991) |
Number of households with income $100k - 125k:| Leicester: | 9.5% (10,821) |
| State: | 9.5% (24,409) |
Number of households with income $125k - 150k:| Leicester: | 7.7% (8,744) |
| State: | 7.7% (19,710) |
Number of households with income $150k - 200k:| Leicester: | 9.7% (10,998) |
| State: | 9.7% (24,802) |
Number of households with income > $200k:| Leicester: | 8.5% (9,718) |
| State: | 8.6% (21,983) |
Aggregate household income in Leicester in 2022: $124,192,089
Median family income in Leicester in 2022:| Leicester: | $92,203 |
| Vermont: | $96,147 |
Number of families with income < $10k:| Leicester: | 3.2% (7) |
| State: | 1.8% (2,669) |
Number of families with income $10k - 20k:| Leicester: | 2.6% (5) |
| State: | 3.1% (4,686) |
Number of families with income $20k - 30k:| Leicester: | 7.4% (15) |
| State: | 4.1% (6,266) |
Number of families with income $30k - 40k:| Leicester: | 9.0% (19) |
| Vermont: | 6.1% (9,273) |
Number of families with income $40k - 50k:| Leicester: | 6.1% (13) |
| State: | 6.4% (9,714) |
Number of families with income $50k - 60k:| Leicester: | 8.2% (17) |
| State: | 6.1% (9,310) |
Number of families with income $60k - 75k:| Leicester: | 11.1% (23) |
| State: | 9.3% (14,175) |
Number of families with income $75k - 100k:| Leicester: | 14.6% (30) |
| State: | 15.5% (23,673) |
Number of families with income $100k - 125k:| Leicester: | 6.7% (14) |
| State: | 12.7% (19,323) |
Number of families with income $125k - 150k:| Leicester: | 4.0% (8) |
| State: | 9.7% (14,805) |
Number of families with income $150k - 200k:| Leicester: | 9.6% (20) |
| Vermont: | 13.1% (20,018) |
Number of families with income > $200k:| Leicester: | 17.6% (36) |
| Vermont: | 12.1% (18,463) |
Median non-family income in Leicester in 2022:| Leicester: | $44,820 |
| State: | $45,952 |
Change in median non-family income between 2000 and 2022:| Leicester, Vermont: | +86.8% |
| State: | +86.1% |
Median per capita income in Leicester in 2022:| Leicester: | $45,602 |
| State: | $43,031 |
Change in median per capita income between 2000 and 2022:| Leicester, Vermont: | +106.2% |
| State: | +106.0% |
Income statistics for Hispanic or Latino residents
Median household income in Leicester, VT in 2022:| Leicester: | $14,658 |
| State: | $90,490 |
Change in median household income between 2000 and 2022:| Leicester, Vermont: | +134.5% |
| State: | +133.7% |
Number of households with income < $10k:| Leicester: | 9.2% (81) |
| State: | 9.2% (500) |
Number of households with income $10k - 20k:| Leicester: | 5.2% (46) |
| Vermont: | 5.3% (288) |
Number of households with income $20k - 30k:| Leicester: | 3.6% (32) |
| State: | 3.7% (203) |
Number of households with income $30k - 40k:| Leicester: | 5.4% (47) |
| Vermont: | 5.3% (288) |
Number of households with income $40k - 50k:| Leicester: | 7.0% (61) |
| State: | 7.0% (379) |
Number of households with income $50k - 60k:| Leicester: | 7.0% (61) |
| State: | 6.9% (376) |
Number of households with income $60k - 75k:| Leicester: | 5.2% (46) |
| State: | 5.2% (282) |
Number of households with income $75k - 100k:| Leicester: | 16.6% (146) |
| State: | 16.7% (905) |
Number of households with income $100k - 125k:| Leicester: | 12.5% (110) |
| Vermont: | 12.6% (682) |
Number of households with income $125k - 150k:| Leicester: | 12.3% (108) |
| State: | 12.3% (669) |
Number of households with income $150k - 200k:| Leicester: | 7.5% (66) |
| State: | 7.6% (412) |
Number of households with income > $200k:| Leicester: | 8.3% (73) |
| Vermont: | 8.3% (450) |
Aggregate household income in Leicester in 2022: $82,671
Median non-family income in Leicester in 2022:| Leicester: | $13,974 |
| State: | $51,794 |
Change in median non-family income between 2000 and 2022:| Leicester, Vermont: | +123.6% |
| State: | +99.8% |
Median per capita income in Leicester in 2022:| Leicester: | $13,943 |
| State: | $36,311 |
Change in median per capita income between 2000 and 2022:| Leicester, Vermont: | +132.4% |
| Vermont: | +131.1% |
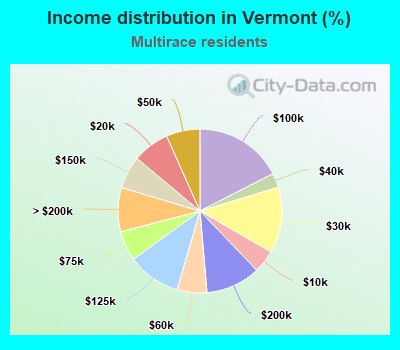
Income statistics for Multirace residents
Median household income in Leicester, VT in 2022:| Leicester: | $62,518 |
| State: | $81,819 |
Number of households with income < $10k:| Leicester: | 4.5% (457) |
| State: | 4.5% (613) |
Number of households with income $10k - 20k:| Leicester: | 7.3% (737) |
| State: | 7.3% (988) |
Number of households with income $20k - 30k:| Leicester: | 13.0% (1,321) |
| Vermont: | 13.0% (1,770) |
Number of households with income $30k - 40k:| Leicester: | 2.8% (288) |
| State: | 2.8% (386) |
Number of households with income $40k - 50k:| Leicester: | 6.7% (675) |
| State: | 6.7% (904) |
Number of households with income $50k - 60k:| Leicester: | 5.9% (595) |
| State: | 5.9% (797) |
Number of households with income $60k - 75k:| Leicester: | 5.9% (600) |
| State: | 5.9% (804) |
Number of households with income $75k - 100k:| Leicester: | 17.5% (1,773) |
| State: | 17.5% (2,376) |
Number of households with income $100k - 125k:| Leicester: | 10.5% (1,065) |
| Vermont: | 10.5% (1,427) |
Number of households with income $125k - 150k:| Leicester: | 6.5% (655) |
| Vermont: | 6.5% (877) |
Number of households with income $150k - 200k:| Leicester: | 10.8% (1,095) |
| Vermont: | 10.8% (1,467) |
Number of households with income > $200k:| Leicester: | 8.7% (881) |
| State: | 8.7% (1,180) |
Aggregate household income in Leicester in 2022: $1,331,771
Median family income in Leicester in 2022:| Leicester: | $43,561 |
| Vermont: | $98,198 |
Number of families with income < $10k:| Leicester: | 60.9% (9) |
| State: | 5.7% (461) |
Number of families with income $20k - 30k:| Leicester: | 39.1% (6) |
| State: | 7.0% (570) |
Median non-family income in Leicester in 2022:| Leicester: | $66,714 |
| Vermont: | $44,940 |
Change in median non-family income between 2000 and 2022:| Leicester, Vermont: | +132.0% |
| State: | +160.3% |
Median per capita income in Leicester in 2022:| Leicester: | $33,284 |
| Vermont: | $34,567 |
Income statistics for other residents
Number of households with income < $10k:| Leicester: | 4.9% (2) |
| State: | 4.4% (48) |
Number of households with income $10k - 20k:| Leicester: | 7.3% (3) |
| State: | 6.4% (69) |
Number of households with income $20k - 30k:| Leicester: | 9.8% (4) |
| State: | 2.7% (29) |
Number of households with income $30k - 40k:| Leicester: | 9.8% (4) |
| State: | 13.6% (147) |
Number of households with income $40k - 50k:| Leicester: | 9.8% (4) |
| State: | 13.4% (145) |
Number of households with income $50k - 60k:| Leicester: | 7.3% (3) |
| State: | 7.8% (84) |
Number of households with income $60k - 75k:| Leicester: | 9.8% (4) |
| Vermont: | 13.7% (148) |
Number of households with income $75k - 100k:| Leicester: | 14.6% (6) |
| State: | 8.1% (87) |
Number of households with income $100k - 125k:| Leicester: | 9.8% (4) |
| State: | 8.4% (91) |
Number of households with income $125k - 150k:| Leicester: | 4.9% (2) |
| State: | 6.1% (66) |
Number of households with income $150k - 200k:| Leicester: | 7.3% (3) |
| State: | 10.7% (116) |
Number of households with income > $200k:| Leicester: | 4.9% (2) |
| State: | 4.6% (50) |
Aggregate household income in Leicester in 2022: $164,010
Median non-family income in Leicester in 2022:| Leicester: | $15,098 |
| State: | $35,516 |
Change in median non-family income between 2000 and 2022:| Leicester, Vermont: | +141.6% |
| Vermont: | +141.6% |
Median per capita income in Leicester in 2022:| Leicester: | $18,667 |
| Vermont: | $36,770 |