Moclips, Washington (WA) income map, earnings map, and wages data

Data:
The per capita income in 2022 was $33,195, which means an increase of 47.6% compared to 2000 when it was $17,411.
Whole page based on the data from 2000 / 2022 when the population of Moclips, Washington was 615 / 79
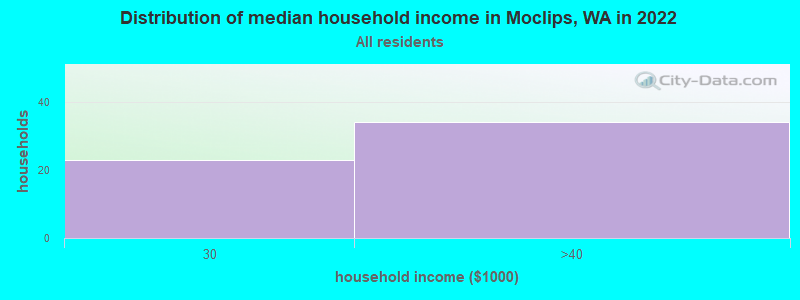
Income statistics for all residents
Number of households with income < $10k:| Moclips: | 0.0% (0) |
| Washington: | 4.5% (139,331) |
Number of households with income $10k - 20k:| Moclips: | 0.0% (0) |
| State: | 5.0% (154,508) |
Number of households with income $20k - 30k:| Moclips: | 40.4% (23) |
| State: | 5.4% (166,555) |
Number of households with income $30k - 40k:| Moclips: | 59.6% (34) |
| State: | 5.5% (170,324) |
Number of households with income $40k - 50k:| Moclips: | 0.0% (0) |
| State: | 6.0% (183,941) |
Number of households with income $50k - 60k:| Moclips: | 0.0% (0) |
| Washington: | 6.1% (187,395) |
Number of households with income $60k - 75k:| Moclips: | 0.0% (0) |
| Washington: | 8.7% (266,771) |
Number of households with income $75k - 100k:| Moclips: | 0.0% (0) |
| State: | 13.1% (404,672) |
Number of households with income $100k - 125k:| Moclips: | 0.0% (0) |
| State: | 11.0% (337,911) |
Number of households with income $125k - 150k:| Moclips: | 0.0% (0) |
| Washington: | 8.0% (244,934) |
Number of households with income $150k - 200k:| Moclips: | 0.0% (0) |
| State: | 10.5% (323,812) |
Number of households with income > $200k:| Moclips: | 0.0% (0) |
| Washington: | 16.2% (499,799) |
Aggregate household income in Moclips in 2022: $7,136,849
Median per capita income in Moclips in 2022:| Moclips: | $33,196 |
| Washington: | $50,764 |
Change in median per capita income between 2000 and 2022:| Moclips, Washington: | +90.7% |
| Washington: | +121.0% |
Income statistics for White residents
Number of households with income < $10k:| Moclips: | 0.0% (0) |
| Washington: | 4.3% (95,850) |
Number of households with income $10k - 20k:| Moclips: | 0.0% (0) |
| State: | 4.8% (106,421) |
Number of households with income $20k - 30k:| Moclips: | 0.0% (0) |
| State: | 5.5% (122,860) |
Number of households with income $30k - 40k:| Moclips: | 100.0% (28) |
| Washington: | 5.4% (119,627) |
Number of households with income $40k - 50k:| Moclips: | 0.0% (0) |
| State: | 5.9% (132,276) |
Number of households with income $50k - 60k:| Moclips: | 0.0% (0) |
| State: | 6.1% (136,212) |
Number of households with income $60k - 75k:| Moclips: | 0.0% (0) |
| Washington: | 8.8% (196,086) |
Number of households with income $75k - 100k:| Moclips: | 0.0% (0) |
| State: | 13.4% (299,192) |
Number of households with income $100k - 125k:| Moclips: | 0.0% (0) |
| Washington: | 11.3% (252,209) |
Number of households with income $125k - 150k:| Moclips: | 0.0% (0) |
| State: | 7.9% (175,962) |
Number of households with income $150k - 200k:| Moclips: | 0.0% (0) |
| State: | 10.7% (239,156) |
Number of households with income > $200k:| Moclips: | 0.0% (0) |
| State: | 16.1% (359,917) |
Aggregate household income in Moclips in 2022: $6,293,080
Median per capita income in Moclips in 2022:| Moclips: | $32,411 |
| State: | $55,212 |
Change in median per capita income between 2000 and 2022:| Moclips, Washington: | +38.6% |
| Washington: | +123.8% |
Income statistics for Hispanic or Latino residents
Number of households with income < $10k:| Moclips: | 0.0% (0) |
| State: | 4.9% (14,456) |
Number of households with income $10k - 20k:| Moclips: | 0.0% (0) |
| State: | 5.3% (15,449) |
Number of households with income $20k - 30k:| Moclips: | 100.0% (19) |
| Washington: | 6.8% (20,016) |
Number of households with income $30k - 40k:| Moclips: | 0.0% (0) |
| State: | 7.7% (22,548) |
Number of households with income $40k - 50k:| Moclips: | 0.0% (0) |
| Washington: | 7.3% (21,450) |
Number of households with income $50k - 60k:| Moclips: | 0.0% (0) |
| Washington: | 7.7% (22,744) |
Number of households with income $60k - 75k:| Moclips: | 0.0% (0) |
| Washington: | 10.5% (30,737) |
Number of households with income $75k - 100k:| Moclips: | 0.0% (0) |
| State: | 14.9% (43,843) |
Number of households with income $100k - 125k:| Moclips: | 0.0% (0) |
| State: | 11.1% (32,554) |
Number of households with income $125k - 150k:| Moclips: | 0.0% (0) |
| Washington: | 7.4% (21,624) |
Number of households with income $150k - 200k:| Moclips: | 0.0% (0) |
| State: | 7.3% (21,360) |
Number of households with income > $200k:| Moclips: | 0.0% (0) |
| State: | 9.2% (27,055) |
Aggregate household income in Moclips in 2022: $1,688,018
Median per capita income in Moclips in 2022:| Moclips: | $14,951 |
| Washington: | $28,252 |
Change in median per capita income between 2000 and 2022:| Moclips, Washington: | +92.9% |
| State: | +150.2% |
Income statistics for other residents
Number of households with income < $10k:| Moclips: | 0.0% (0) |
| Washington: | 5.3% (6,540) |
Number of households with income $10k - 20k:| Moclips: | 0.0% (0) |
| Washington: | 6.0% (7,385) |
Number of households with income $20k - 30k:| Moclips: | 100.0% (24) |
| Washington: | 7.5% (9,289) |
Number of households with income $30k - 40k:| Moclips: | 0.0% (0) |
| State: | 8.9% (11,015) |
Number of households with income $40k - 50k:| Moclips: | 0.0% (0) |
| State: | 7.6% (9,399) |
Number of households with income $50k - 60k:| Moclips: | 0.0% (0) |
| State: | 7.2% (8,867) |
Number of households with income $60k - 75k:| Moclips: | 0.0% (0) |
| State: | 10.5% (13,032) |
Number of households with income $75k - 100k:| Moclips: | 0.0% (0) |
| State: | 14.6% (18,007) |
Number of households with income $100k - 125k:| Moclips: | 0.0% (0) |
| Washington: | 12.2% (15,128) |
Number of households with income $125k - 150k:| Moclips: | 0.0% (0) |
| Washington: | 5.6% (6,950) |
Number of households with income $150k - 200k:| Moclips: | 0.0% (0) |
| State: | 7.1% (8,749) |
Number of households with income > $200k:| Moclips: | 0.0% (0) |
| State: | 7.5% (9,208) |
Aggregate household income in Moclips in 2022: $1,181,174
Median per capita income in Moclips in 2022:| Moclips: | $10,630 |
| Washington: | $27,542 |
Change in median per capita income between 2000 and 2022:| Moclips, Washington: | +74.3% |
| Washington: | +167.8% |