The median household income in New Hope, MS in 2022 was $75,766, which was 30.4% greater than the median annual income of $52,719 across the entire state of Mississippi. Compared to the median income of $54,375 in 2000 this represents an increase of 28.2%. The per capita income in 2022 was $35,947, which means an increase of 30.0% compared to 2000 when it was $25,153.
Whole page based on the data from 2000 / 2022 when the population of New Hope, Mississippi was 1,964 / 2,964
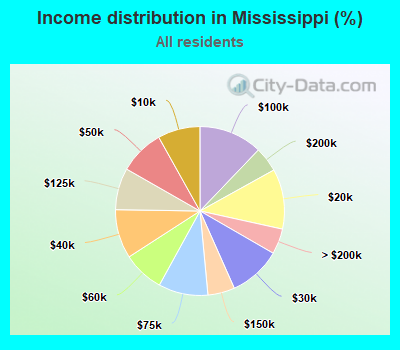
Income statistics for all residents
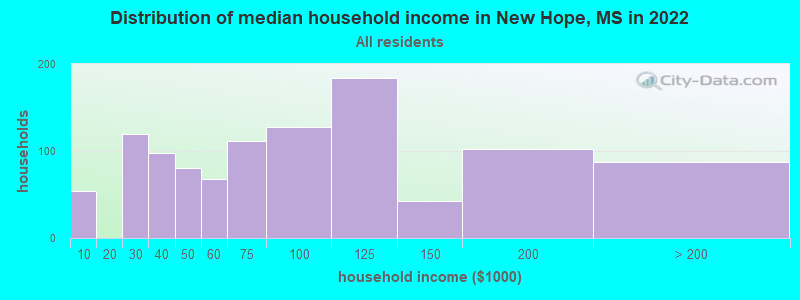
Median household income in New Hope, MS in 2022:
New Hope:
$75,767
State:
$52,719
Change in median household income between 2000 and 2022:
New Hope, Mississippi:
+39.3%
Mississippi:
+68.3%
Number of households with income < $10k:
New Hope:
5.0% (54)
State:
8.1% (93,168)
Number of households with income $10k - 20k:
New Hope:
0.0% (0)
State:
11.5% (132,073)
Number of households with income $20k - 30k:
New Hope:
11.1% (119)
State:
10.0% (114,967)
Number of households with income $30k - 40k:
New Hope:
9.1% (98)
State:
9.4% (107,844)
Number of households with income $40k - 50k:
New Hope:
7.5% (81)
Mississippi:
8.6% (98,915)
Number of households with income $50k - 60k:
New Hope:
6.3% (68)
State:
7.9% (90,333)
Number of households with income $60k - 75k:
New Hope:
10.3% (111)
State:
9.5% (109,069)
Number of households with income $75k - 100k:
New Hope:
11.9% (128)
Mississippi:
12.1% (139,516)
Number of households with income $100k - 125k:
New Hope:
17.1% (184)
State:
8.0% (92,049)
Number of households with income $125k - 150k:
New Hope:
3.9% (42)
Mississippi:
5.1% (59,086)
Number of households with income $150k - 200k:
New Hope:
9.5% (102)
State:
4.8% (55,082)
Number of households with income > $200k:
New Hope:
8.1% (87)
Mississippi:
4.9% (56,238)
Aggregate household income in New Hope in 2022: $99,658,626
Median family income in New Hope in 2022:
New Hope:
$87,139
Mississippi:
$66,973
Number of families with income < $10k:
New Hope:
1.4% (11)
State:
5.1% (38,751)
Number of families with income $20k - 30k:
New Hope:
7.4% (62)
Mississippi:
8.2% (62,003)
Number of families with income $30k - 40k:
New Hope:
6.2% (52)
State:
8.1% (61,301)
Number of families with income $40k - 50k:
New Hope:
5.6% (47)
State:
8.7% (65,403)
Number of families with income $50k - 60k:
New Hope:
4.9% (41)
State:
8.0% (60,662)
Number of families with income $60k - 75k:
New Hope:
10.7% (89)
Mississippi:
10.3% (77,954)
Number of families with income $75k - 100k:
New Hope:
20.7% (173)
State:
14.9% (112,173)
Number of families with income $100k - 125k:
New Hope:
15.5% (130)
State:
10.3% (77,472)
Number of families with income $125k - 150k:
New Hope:
5.0% (42)
Mississippi:
6.9% (51,783)
Number of families with income $150k - 200k:
New Hope:
12.2% (102)
State:
6.6% (49,581)
Number of families with income > $200k:
New Hope:
10.4% (87)
Mississippi:
6.5% (49,404)
Median non-family income in New Hope in 2022:
New Hope:
$30,823
Mississippi:
$28,667
Change in median non-family income between 2000 and 2022:
New Hope, Mississippi:
+1.2%
State:
+72.5%
Median per capita income in New Hope in 2022:
New Hope:
$35,947
Mississippi:
$29,045
Change in median per capita income between 2000 and 2022:
New Hope, Mississippi:
+42.9%
Mississippi:
+83.2%
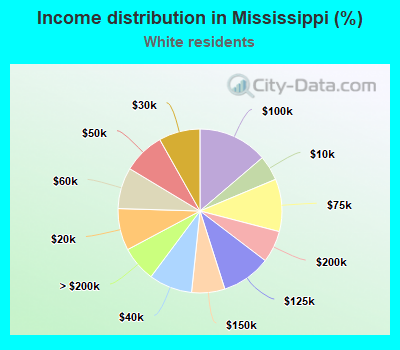
Income statistics for White residents
Median household income in New Hope, MS in 2022:
New Hope:
$76,183
State:
$64,236
Change in median household income between 2000 and 2022:
New Hope, Mississippi:
+31.1%
State:
+71.7%
Number of households with income < $10k:
New Hope:
6.0% (50)
State:
5.0% (33,159)
Number of households with income $10k - 20k:
New Hope:
0.0% (0)
State:
8.3% (55,463)
Number of households with income $20k - 30k:
New Hope:
8.7% (72)
Mississippi:
8.1% (54,574)
Number of households with income $30k - 40k:
New Hope:
8.1% (67)
Mississippi:
8.6% (57,298)
Number of households with income $40k - 50k:
New Hope:
9.4% (78)
State:
8.2% (54,982)
Number of households with income $50k - 60k:
New Hope:
8.3% (69)
State:
8.1% (54,570)
Number of households with income $60k - 75k:
New Hope:
10.9% (90)
Mississippi:
10.4% (69,376)
Number of households with income $75k - 100k:
New Hope:
10.6% (88)
Mississippi:
13.8% (92,090)
Number of households with income $100k - 125k:
New Hope:
20.4% (169)
State:
9.7% (65,195)
Number of households with income $125k - 150k:
New Hope:
5.1% (42)
State:
6.6% (43,892)
Number of households with income $150k - 200k:
New Hope:
9.5% (79)
State:
6.3% (42,176)
Number of households with income > $200k:
New Hope:
2.9% (24)
Mississippi:
7.0% (46,852)
Aggregate household income in New Hope in 2022: $72,944,768
Median family income in New Hope in 2022:
New Hope:
$89,114
State:
$81,605
Number of families with income < $10k:
New Hope:
1.9% (12)
State:
2.8% (12,892)
Number of families with income $20k - 30k:
New Hope:
5.1% (31)
State:
5.4% (24,708)
Number of families with income $30k - 40k:
New Hope:
3.9% (24)
Mississippi:
7.0% (31,647)
Number of families with income $40k - 50k:
New Hope:
6.7% (41)
Mississippi:
7.2% (32,697)
Number of families with income $50k - 60k:
New Hope:
6.9% (42)
State:
8.1% (36,852)
Number of families with income $60k - 75k:
New Hope:
11.3% (69)
Mississippi:
10.9% (49,441)
Number of families with income $75k - 100k:
New Hope:
21.2% (129)
State:
16.3% (74,187)
Number of families with income $100k - 125k:
New Hope:
19.5% (119)
Mississippi:
12.3% (56,064)
Number of families with income $125k - 150k:
New Hope:
6.8% (41)
State:
8.4% (38,362)
Number of families with income $150k - 200k:
New Hope:
12.7% (78)
State:
8.3% (37,610)
Number of families with income > $200k:
New Hope:
3.9% (24)
Mississippi:
9.1% (41,392)
Median non-family income in New Hope in 2022:
New Hope:
$36,739
State:
$35,826
Change in median non-family income between 2000 and 2022:
New Hope, Mississippi:
+20.9%
Mississippi:
+82.0%
Median per capita income in New Hope in 2022:
New Hope:
$36,011
State:
$35,856
Change in median per capita income between 2000 and 2022:
New Hope, Mississippi:
+40.2%
State:
+84.9%
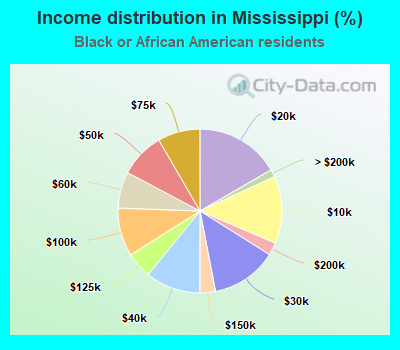
Income statistics for Black or African American residents
Median household income in New Hope, MS in 2022:
New Hope:
$75,677
Mississippi:
$36,215
Number of households with income < $10k:
New Hope:
0.0% (0)
Mississippi:
13.3% (54,463)
Number of households with income $10k - 20k:
New Hope:
0.0% (0)
State:
16.7% (68,415)
Number of households with income $20k - 30k:
New Hope:
21.2% (47)
State:
13.0% (53,517)
Number of households with income $30k - 40k:
New Hope:
13.5% (30)
Mississippi:
10.8% (44,492)
Number of households with income $40k - 50k:
New Hope:
0.0% (0)
Mississippi:
8.9% (36,358)
Number of households with income $50k - 60k:
New Hope:
0.0% (0)
State:
7.2% (29,595)
Number of households with income $60k - 75k:
New Hope:
9.5% (21)
State:
8.4% (34,343)
Number of households with income $75k - 100k:
New Hope:
17.1% (38)
State:
9.5% (39,194)
Number of households with income $100k - 125k:
New Hope:
3.6% (8)
State:
5.1% (21,066)
Number of households with income $125k - 150k:
New Hope:
0.0% (0)
State:
3.1% (12,713)
Number of households with income $150k - 200k:
New Hope:
8.6% (19)
State:
2.5% (10,278)
Number of households with income > $200k:
New Hope:
26.6% (59)
State:
1.5% (6,138)
Aggregate household income in New Hope in 2022: $24,669,101
Median per capita income in New Hope in 2022:
New Hope:
$36,103
State:
$20,283
Change in median per capita income between 2000 and 2022:
New Hope, Mississippi:
+125.5%
Mississippi:
+102.0%
Income statistics for Multirace residents
Median per capita income in New Hope in 2022:
New Hope:
$89,928
State:
$19,761
Discuss New Hope, Mississippi (MS) on our hugely popular Mississippi forum.