The median household income in Newell, CA in 2022 was $32,828, which was 178.9% less than the median annual income of $91,551 across the entire state of California. Compared to the median income of $27,522 in 2000 this represents an increase of 16.2%. The per capita income in 2022 was $17,784, which means an increase of 2.8% compared to 2000 when it was $17,285.
Whole page based on the data from 2000 / 2022 when the population of Newell, California was 449 / 427
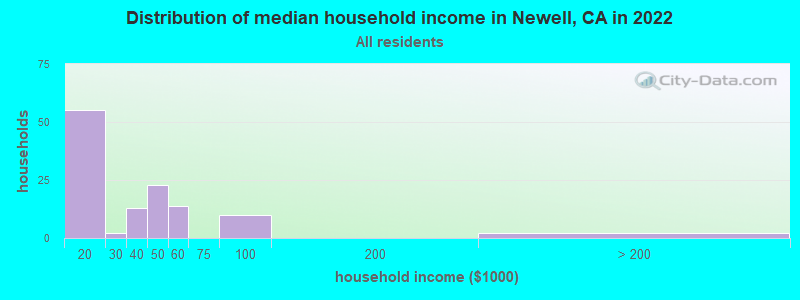
Income statistics for all residents
Median household income in Newell, CA in 2022:
Newell:
$32,828
State:
$91,551
Change in median household income between 2000 and 2022:
Newell, California:
+19.3%
California:
+92.8%
Number of households with income < $10k:
Newell:
0.0% (0)
State:
4.8% (654,370)
Number of households with income $10k - 20k:
Newell:
46.2% (55)
California:
5.8% (789,493)
Number of households with income $20k - 30k:
Newell:
1.7% (2)
State:
5.7% (778,318)
Number of households with income $30k - 40k:
Newell:
10.9% (13)
State:
5.8% (783,170)
Number of households with income $40k - 50k:
Newell:
19.3% (23)
State:
5.8% (781,352)
Number of households with income $50k - 60k:
Newell:
11.8% (14)
California:
5.6% (760,175)
Number of households with income $60k - 75k:
Newell:
0.0% (0)
State:
8.2% (1,104,699)
Number of households with income $75k - 100k:
Newell:
8.4% (10)
State:
12.0% (1,627,633)
Number of households with income $100k - 125k:
Newell:
0.0% (0)
State:
10.0% (1,358,619)
Number of households with income $125k - 150k:
Newell:
0.0% (0)
State:
7.6% (1,027,455)
Number of households with income $150k - 200k:
Newell:
0.0% (0)
California:
10.6% (1,439,811)
Number of households with income > $200k:
Newell:
1.7% (2)
State:
18.0% (2,445,491)
Aggregate household income in Newell in 2022: $4,743,454
Median family income in Newell in 2022:
Newell:
$34,597
State:
$104,823
Number of families with income $10k - 20k:
Newell:
34.7% (27)
California:
3.5% (322,064)
Number of families with income $20k - 30k:
Newell:
2.4% (2)
State:
4.7% (433,722)
Number of families with income $30k - 40k:
Newell:
14.2% (11)
State:
5.2% (478,213)
Number of families with income $40k - 50k:
Newell:
28.5% (22)
State:
5.6% (511,647)
Number of families with income $50k - 60k:
Newell:
17.7% (14)
State:
5.5% (498,926)
Number of families with income > $200k:
Newell:
2.6% (2)
State:
21.5% (1,963,769)
Median income for 2 person families:
Newell:
$40,965
State:
$92,781
Median per capita income in Newell in 2022:
Newell:
$17,785
State:
$46,661
Change in median per capita income between 2000 and 2022:
Newell, California:
+2.9%
State:
+105.5%
Income statistics for White residents
Median household income in Newell, CA in 2022:
Newell:
$33,750
State:
$100,917
Change in median household income between 2000 and 2022:
Newell, California:
+15.9%
State:
+96.8%
Number of households with income < $10k:
Newell:
0.0% (0)
California:
4.4% (284,109)
Number of households with income $10k - 20k:
Newell:
47.4% (46)
State:
5.3% (340,330)
Number of households with income $20k - 30k:
Newell:
2.1% (2)
California:
5.3% (343,145)
Number of households with income $30k - 40k:
Newell:
9.3% (9)
California:
5.1% (330,146)
Number of households with income $40k - 50k:
Newell:
18.6% (18)
California:
5.2% (335,310)
Number of households with income $50k - 60k:
Newell:
11.3% (11)
State:
5.1% (326,299)
Number of households with income $60k - 75k:
Newell:
0.0% (0)
California:
7.6% (487,640)
Number of households with income $75k - 100k:
Newell:
9.3% (9)
State:
11.5% (736,578)
Number of households with income $100k - 125k:
Newell:
0.0% (0)
State:
10.1% (648,782)
Number of households with income $125k - 150k:
Newell:
0.0% (0)
California:
7.8% (499,671)
Number of households with income $150k - 200k:
Newell:
0.0% (0)
State:
11.4% (729,603)
Number of households with income > $200k:
Newell:
2.1% (2)
California:
21.2% (1,364,246)
Aggregate household income in Newell in 2022: $4,129,687
Median family income in Newell in 2022:
Newell:
$37,520
State:
$125,379
Number of families with income $10k - 20k:
Newell:
34.7% (19)
State:
2.5% (97,716)
Number of families with income $30k - 40k:
Newell:
14.8% (8)
California:
3.9% (152,947)
Number of families with income $40k - 50k:
Newell:
28.5% (16)
California:
4.3% (169,197)
Number of families with income $50k - 60k:
Newell:
18.6% (10)
State:
4.5% (176,192)
Number of families with income > $200k:
Newell:
3.4% (2)
State:
27.6% (1,086,948)
Median per capita income in Newell in 2022:
Newell:
$16,778
State:
$61,706
Change in median per capita income between 2000 and 2022:: -11.7%
Newell, California:
-11.7%
California:
+122.7%
Income statistics for Hispanic or Latino residents
Number of households with income < $10k:
Newell:
0.0% (0)
State:
4.3% (183,294)
Number of households with income $10k - 20k:
Newell:
100.0% (27)
California:
6.0% (253,903)
Number of households with income $20k - 30k:
Newell:
0.0% (0)
State:
6.8% (286,386)
Number of households with income $30k - 40k:
Newell:
0.0% (0)
State:
7.4% (313,728)
Number of households with income $40k - 50k:
Newell:
0.0% (0)
California:
7.4% (313,199)
Number of households with income $50k - 60k:
Newell:
0.0% (0)
State:
7.2% (305,366)
Number of households with income $60k - 75k:
Newell:
0.0% (0)
State:
10.3% (434,937)
Number of households with income $75k - 100k:
Newell:
0.0% (0)
California:
14.4% (607,302)
Number of households with income $100k - 125k:
Newell:
0.0% (0)
State:
10.6% (447,424)
Number of households with income $125k - 150k:
Newell:
0.0% (0)
State:
7.5% (316,022)
Number of households with income $150k - 200k:
Newell:
0.0% (0)
California:
9.2% (386,269)
Number of households with income > $200k:
Newell:
0.0% (0)
State:
8.8% (372,651)
Aggregate household income in Newell in 2022: $3,877,777
Median per capita income in Newell in 2022:
Newell:
$10,424
State:
$27,240
Change in median per capita income between 2000 and 2022:
Newell, California:
+52.6%
State:
+133.3%
Income statistics for Multirace residents
Aggregate household income in Newell in 2022: $174,243,541
Median per capita income in Newell in 2022:
Newell:
$21,785
State:
$32,124
Change in median per capita income between 2000 and 2022:
Newell, California:
+111.2%
State:
+120.4%
Income statistics for other residents
Median per capita income in Newell in 2022:
Newell:
$16,895
State:
$25,164
Change in median per capita income between 2000 and 2022:
Newell, California:
+138.7%
State:
+137.9%
Discuss Newell, California (CA) on our hugely popular California forum.